POS Terminals Market Size 2026-2030
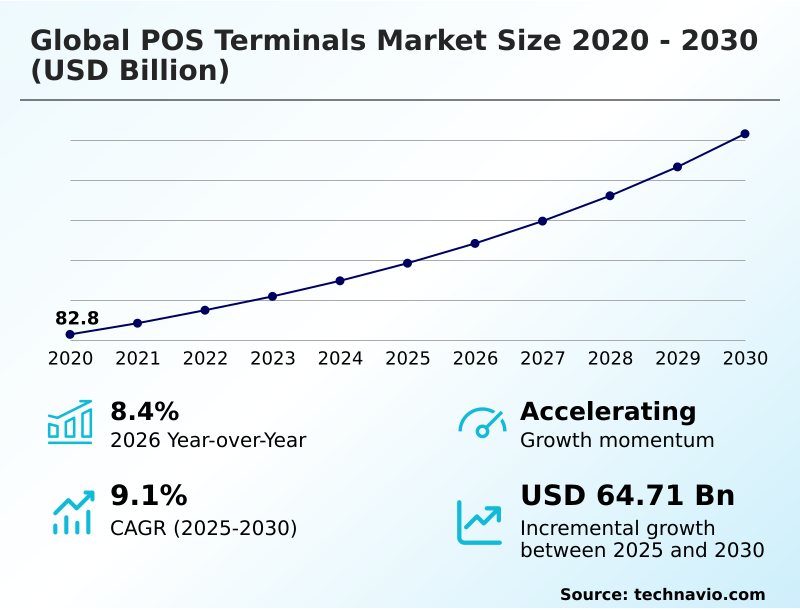
The pos terminals market size is valued to increase by USD 64.71 billion, at a CAGR of 9.1% from 2025 to 2030. Rapid growth of cashless payments and digital transaction adoption will drive the pos terminals market.
Major Market Trends & Insights
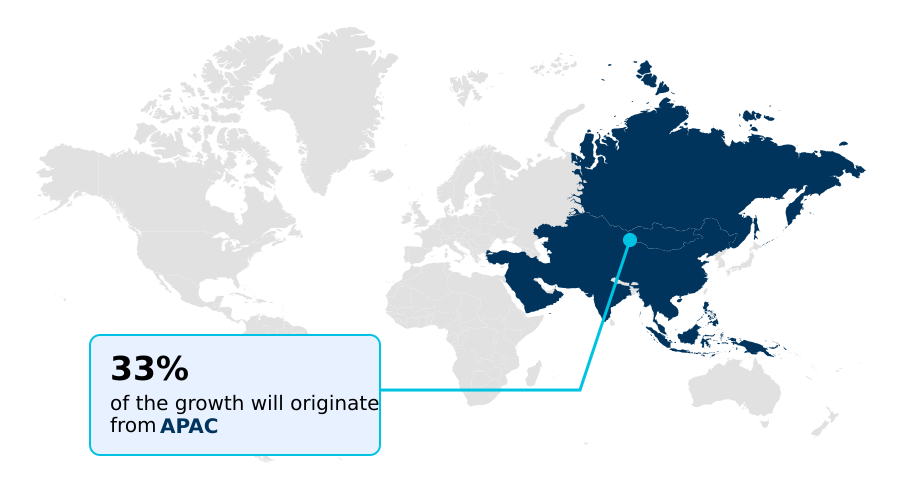
- APAC dominated the market and accounted for a 32.9% growth during the forecast period.
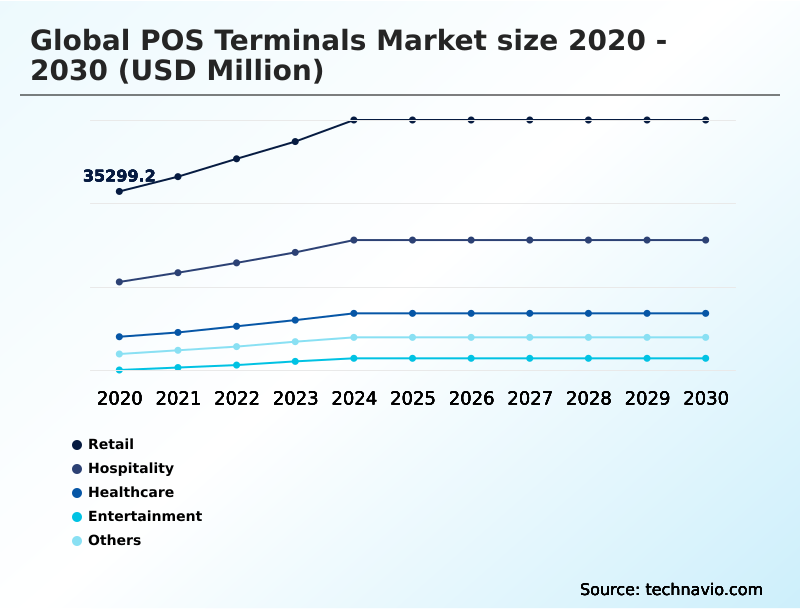
- By End-user - Retail segment was valued at USD 46.90 billion in 2024
- By Component - Hardware segment accounted for the largest market revenue share in 2024
Market Size & Forecast
- Market Opportunities: USD 100.31 billion
- Market Future Opportunities: USD 64.71 billion
- CAGR from 2025 to 2030 : 9.1%
Market Summary
- The POS terminals market is undergoing a significant transformation, evolving from simple transaction devices to sophisticated business management hubs. This shift is driven by the widespread consumer move to digital payments and the need for merchants to streamline operations. Modern systems now feature cloud-based POS software, providing businesses with real-time data and remote management capabilities.
- For example, a multi-location retail business can use an omnichannel commerce platform to synchronize retail inventory control across all stores and its e-commerce site, preventing stockouts and improving customer satisfaction. Key technologies such as the EMV chip reader, NFC payment technology, and QR code scanning are now standard.
- Security is a critical aspect, with end-to-end encryption and tokenization becoming essential for achieving PCI compliance and ensuring point of sale data security. The adoption of the mobile point of sale (mPOS) and tablet POS system offers flexibility, particularly for small businesses and the hospitality sector.
- These devices, often operating on a subscription-based software model, integrate inventory management software and customer relationship management (CRM) tools, making the all-in-one POS system a strategic asset for growth.
What will be the Size of the POS Terminals Market during the forecast period?
Get Key Insights on Market Forecast (PDF) Get Free Sample
How is the POS Terminals Market Segmented?
The pos terminals industry research report provides comprehensive data (region-wise segment analysis), with forecasts and estimates in "USD million" for the period 2026-2030, as well as historical data from 2020-2024 for the following segments.
- End-user
- Retail
- Hospitality
- Healthcare
- Entertainment
- Others
- Component
- Hardware
- Software
- Services
- Product
- Fixed
- Mobile
- Geography
- North America
- US
- Canada
- Mexico
- APAC
- China
- Japan
- India
- Europe
- UK
- Germany
- France
- Middle East and Africa
- UAE
- Saudi Arabia
- South Africa
- South America
- Brazil
- Argentina
- Rest of World (ROW)
- North America
By End-user Insights
The retail segment is estimated to witness significant growth during the forecast period.
The retail sector is accelerating its adoption of modern payment systems, driven by the need for greater operational efficiency and enhanced customer engagement.
Grocers and mass merchants are upgrading to advanced retail POS hardware with a touchscreen interface to streamline checkout and support digital receipt management.
Specialty retailers are leveraging cloud POS for retail platforms to enable omnichannel retail integration, which unifies physical and digital sales channels. This approach supports e-commerce POS integration and effective retail inventory control.
Centralized device management platforms are proving essential, with some solutions reducing terminal maintenance costs by up to 75%.
Furthermore, integrating customer loyalty program integration directly into the point of sale is becoming a standard for fostering repeat business and personalizing the shopping experience.
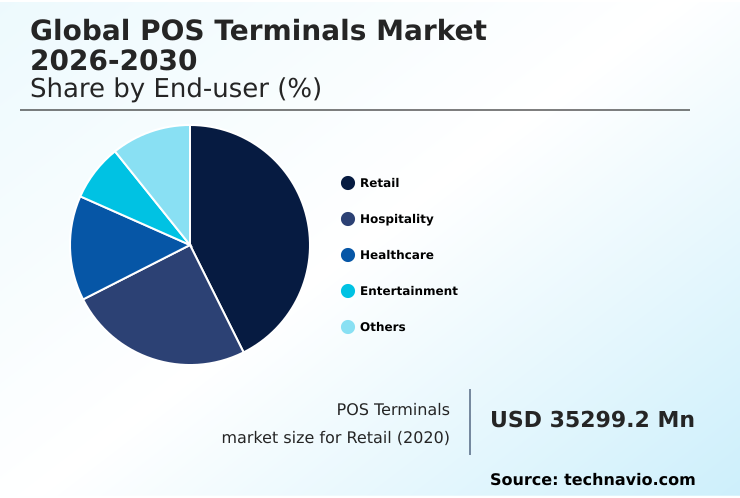
The Retail segment was valued at USD 46.90 billion in 2024 and showed a gradual increase during the forecast period.
Regional Analysis
APAC is estimated to contribute 32.9% to the growth of the global market during the forecast period.Technavio’s analysts have elaborately explained the regional trends and drivers that shape the market during the forecast period.
See How POS Terminals Market Demand is Rising in APAC Get Free Sample
The market's geographic landscape is characterized by diverse regional dynamics. North America and Europe continue to be mature markets focused on upgrading to systems with advanced features like the EMV chip reader and self-checkout system models.
However, the most rapid expansion is occurring in emerging economies.
The APAC region is projected to contribute nearly 33% of the total market growth, driven by the widespread adoption of mobile payment technologies like QR code scanning using a QR code payment terminal.
Markets in the Middle East and Africa are also exhibiting high growth, with a CAGR surpassing 10.7%, as businesses adopt the handheld POS terminal and mobile card reader to support financial inclusion.
In hospitality, restaurant management software integrated with self-service kiosk technology is gaining traction globally.
Market Dynamics
Our researchers analyzed the data with 2025 as the base year, along with the key drivers, trends, and challenges. A holistic analysis of drivers will help companies refine their marketing strategies to gain a competitive advantage.
- Businesses evaluating how to choose a POS system must consider several critical factors beyond upfront cost. For a cafe owner, the best POS system for restaurants might be different than for a retailer, with features like table management being paramount. The debate over cloud-based POS vs on-premise solutions often comes down to scalability and remote access needs.
- A key consideration is finding a POS terminal with inventory management, as this integration is vital for optimizing stock levels and reducing waste. For businesses on the move, like those using mobile POS for food trucks, portability and reliable connectivity are non-negotiable.
- The benefits of omnichannel POS systems are clear, especially for retailers aiming to provide a consistent brand experience online and in-store. A crucial element is ensuring strict PCI compliance for POS terminals to mitigate the security risks in POS systems. Modern platforms excel at improving checkout speed with POS technology, directly impacting customer satisfaction.
- The top features of modern POS terminals often include integrating POS with CRM software and a built-in POS system with loyalty program to drive customer retention. A strategic implementation can yield significant operational improvements; for example, automated authorization processes integrated with POS systems for healthcare clinics have been shown to increase approval rates to nearly 85% compared to manual methods.
- Ultimately, the choice of POS hardware for retail stores or any other business depends on a thorough analysis of specific operational needs, from managing multiple stores with POS to leveraging the android POS terminal advantages for custom app development.
What are the key market drivers leading to the rise in the adoption of POS Terminals Industry?
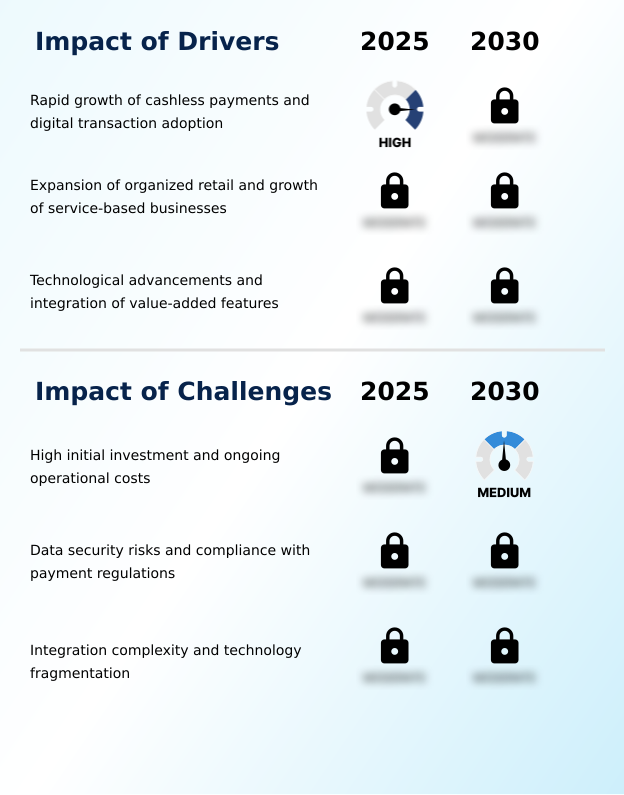
- The rapid expansion of cashless payments and the increasing adoption of digital transactions are the primary drivers propelling market growth.
- The accelerated shift toward digital payments is a primary market driver. Businesses require secure payment terminals that support real-time transaction processing and are fully EMV compliant terminals.
- The expansion of organized retail and service industries fuels demand for the all-in-one POS system. These systems offer integrated payment gateway integration and advanced POS analytics and reporting, providing operational insights that improve efficiency by up to 15%.
- Technological advancements, including the integration of biometric authentication and customer loyalty program integration, are transforming terminals into comprehensive business tools. As industries like hospitality demand more sophisticated hospitality payment solutions, ongoing innovation reinforces long-term market growth and adoption.
What are the market trends shaping the POS Terminals Industry?
- The rising adoption of mobile and cloud-based POS solutions is becoming a prominent market trend. This development is transforming how businesses handle transactions and oversee their operational processes.
- The adoption of mobile and cloud-based solutions is a defining market trend, with merchants shifting to flexible systems. The mobile point of sale (mPOS) and tablet POS system are gaining traction, allowing businesses to process payments anywhere. This shift is supported by the subscription-based software model, which lowers initial investment.
- The expansion of tap-to-pay functionality via an NFC enabled POS and contactless payment device options significantly reduces checkout times, improving customer throughput by over 20%. Cloud-based POS software enables centralized management and seamless online ordering integration. These technologies converge within the omnichannel commerce platform, which unifies sales channels and enhances data visibility.
- For instance, automation in related sectors has been shown to reduce processing times by approximately 70%.
What challenges does the POS Terminals Industry face during its growth?
- The significant initial investment and continuous operational costs required for POS systems pose a key challenge to widespread market adoption.
- Data security risks and regulatory requirements present critical challenges. Ensuring robust point of sale data security is paramount, as breaches can lead to significant financial penalties. Merchants must invest in PCI certified hardware and maintain strict PCI compliance. Implementing technologies like end-to-end encryption, tokenization, and a hardware security module (HSM) is essential but adds complexity and cost.
- Furthermore, integration issues with legacy systems and POS peripheral devices can delay deployment by over 40% and increase expenses. The complexity of achieving seamless e-commerce POS integration or effective cash drawer management across fragmented technology stacks slows adoption, particularly for small businesses with limited technical expertise.
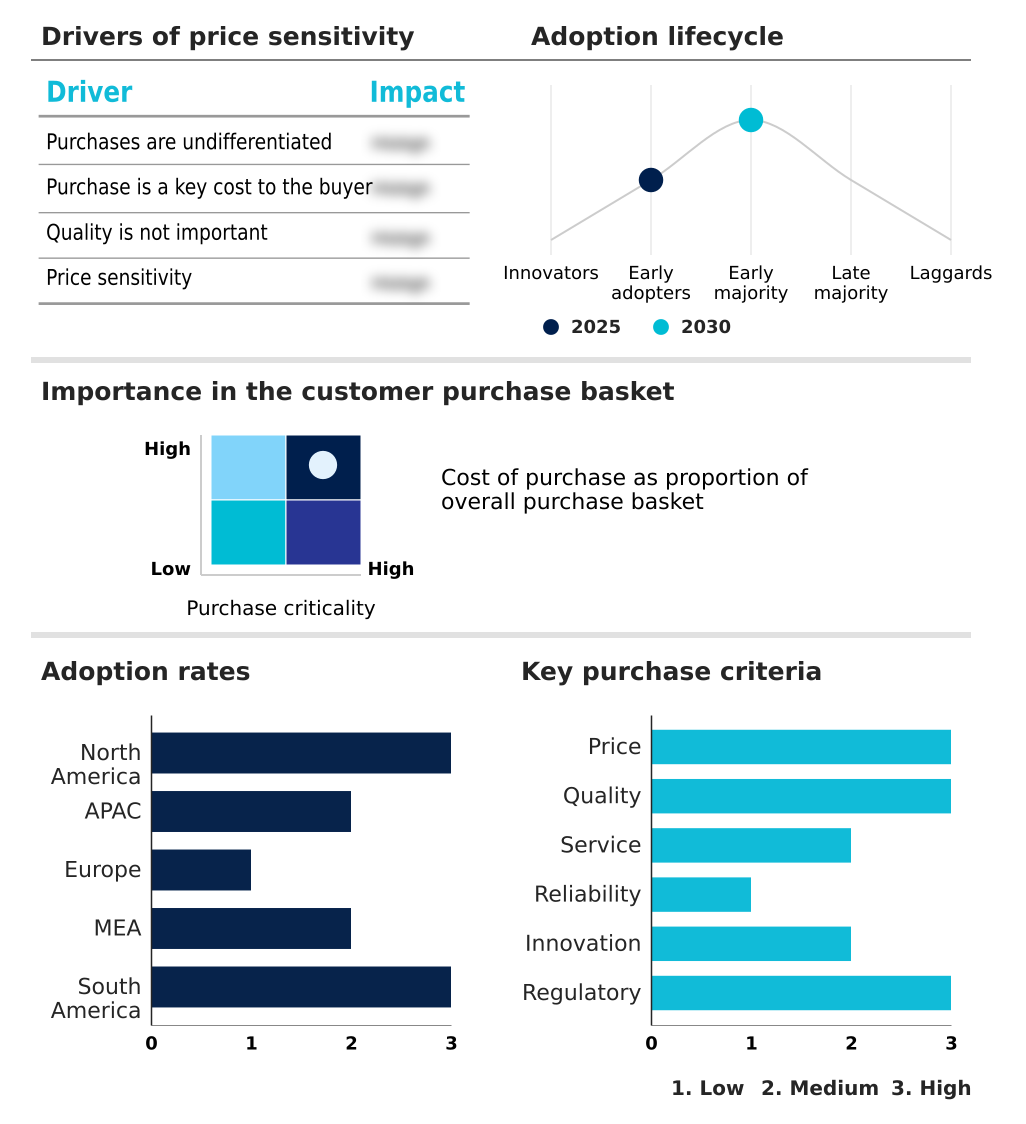
Exclusive Technavio Analysis on Customer Landscape
The pos terminals market forecasting report includes the adoption lifecycle of the market, covering from the innovator’s stage to the laggard’s stage. It focuses on adoption rates in different regions based on penetration. Furthermore, the pos terminals market report also includes key purchase criteria and drivers of price sensitivity to help companies evaluate and develop their market growth analysis strategies.
Customer Landscape of POS Terminals Industry
Competitive Landscape
Companies are implementing various strategies, such as strategic alliances, pos terminals market forecast, partnerships, mergers and acquisitions, geographical expansion, and product/service launches, to enhance their presence in the industry.
Adyen NV - Offers a suite of integrated point-of-sale hardware and software, enabling small to medium-sized businesses to streamline payment acceptance and manage operations efficiently.
The industry research and growth report includes detailed analyses of the competitive landscape of the market and information about key companies, including:
- Adyen NV
- Agilysys Inc.
- Block Inc.
- CASIO Computer Co. Ltd.
- Cegid Group
- Epicor Software Corp.
- Fiserv Inc.
- GK Software SE
- Ingenico Group SA
- Lightspeed Commerce Inc.
- NCR Payment Solutions LLC
- Oracle Corp.
- Panasonic Holdings Corp.
- PAX Global Technology Ltd.
- SumUp Inc.
- Toast Inc.
- Toshiba Corp.
- TouchBistro Inc.
- VeriFone Inc.
Qualitative and quantitative analysis of companies has been conducted to help clients understand the wider business environment as well as the strengths and weaknesses of key industry players. Data is qualitatively analyzed to categorize companies as pure play, category-focused, industry-focused, and diversified; it is quantitatively analyzed to categorize companies as dominant, leading, strong, tentative, and weak.
Recent Development and News in Pos terminals market
- In August 2024, Pine Labs, through its fintech arm Setu, launched UPISetu, India's first dedicated UPI-focused payments platform for businesses, in partnership with Axis Bank.
- In October 2024, Fiserv announced an enhanced suite of all-in-one Clover solutions tailored to help small businesses in restaurants, retail, and service industries.
- In February 2025, Waystar launched Auth Accelerate, a comprehensive solution designed to automate and streamline the prior authorization process for healthcare providers.
- In May 2025, Stripe announced a wide range of product innovations, including an AI foundation model for payments and expanded money management capabilities supported by stablecoins.
Dive into Technavio’s robust research methodology, blending expert interviews, extensive data synthesis, and validated models for unparalleled POS Terminals Market insights. See full methodology.
| Market Scope | |
|---|---|
| Page number | 299 |
| Base year | 2025 |
| Historic period | 2020-2024 |
| Forecast period | 2026-2030 |
| Growth momentum & CAGR | Accelerate at a CAGR of 9.1% |
| Market growth 2026-2030 | USD 64708.4 million |
| Market structure | Fragmented |
| YoY growth 2025-2026(%) | 8.4% |
| Key countries | US, Canada, Mexico, China, Japan, India, South Korea, Australia, Indonesia, UK, Germany, France, Italy, Spain, The Netherlands, UAE, Saudi Arabia, South Africa, Israel, Turkey, Brazil, Argentina and Chile |
| Competitive landscape | Leading Companies, Market Positioning of Companies, Competitive Strategies, and Industry Risks |
Research Analyst Overview
- The market is rapidly evolving beyond simple payment acceptance, with a strong focus on integrated commerce platforms. An all-in-one POS system now functions as a central hub for business operations, featuring a touchscreen interface and cloud-based POS software. This transition is evident in the adoption of the mobile point of sale (mPOS), which provides flexibility for various environments.
- For boardroom consideration, the strategic shift toward a subscription-based software model is critical, as it changes capital expenditure to operational expenditure. Security remains a top priority, addressed by end-to-end encryption, tokenization, and a hardware security module (HSM) to ensure PCI compliance.
- Core hardware, including the EMV chip reader and retail POS hardware, is being enhanced with NFC payment technology and tap-to-pay functionality. Features like QR code scanning and biometric authentication are becoming more common. These systems integrate essential business tools like inventory management software and customer relationship management (CRM), enabling real-time transaction processing and digital receipt management.
- Solutions offering centralized device management can reduce operational costs by as much as 75%, highlighting a clear return on investment.
What are the Key Data Covered in this POS Terminals Market Research and Growth Report?
-
What is the expected growth of the POS Terminals Market between 2026 and 2030?
-
USD 64.71 billion, at a CAGR of 9.1%
-
-
What segmentation does the market report cover?
-
The report is segmented by End-user (Retail, Hospitality, Healthcare, Entertainment, and Others), Component (Hardware, Software, and Services), Product (Fixed, and Mobile) and Geography (North America, APAC, Europe, Middle East and Africa, South America)
-
-
Which regions are analyzed in the report?
-
North America, APAC, Europe, Middle East and Africa and South America
-
-
What are the key growth drivers and market challenges?
-
Rapid growth of cashless payments and digital transaction adoption, High initial investment and ongoing operational costs
-
-
Who are the major players in the POS Terminals Market?
-
Adyen NV, Agilysys Inc., Block Inc., CASIO Computer Co. Ltd., Cegid Group, Epicor Software Corp., Fiserv Inc., GK Software SE, Ingenico Group SA, Lightspeed Commerce Inc., NCR Payment Solutions LLC, Oracle Corp., Panasonic Holdings Corp., PAX Global Technology Ltd., SumUp Inc., Toast Inc., Toshiba Corp., TouchBistro Inc. and VeriFone Inc.
-
Market Research Insights
- Market dynamics are increasingly shaped by the demand for integrated and efficient commerce solutions. Businesses are adopting the omnichannel commerce platform to unify customer experiences across online and physical stores, supported by seamless e-commerce POS integration. The POS system for small business is becoming more accessible, with flexible options like the mobile card reader and tablet POS system.
- In specialized sectors, hospitality payment solutions and restaurant management software are crucial for operational efficiency. Investing in advanced systems yields clear returns; for instance, integrated platforms can reduce device maintenance costs by up to 75%, while automation in related financial workflows has demonstrated a 70% reduction in processing times.
- This focus on POS analytics and reporting and customer loyalty program integration is turning transactional devices into strategic business intelligence tools.
We can help! Our analysts can customize this pos terminals market research report to meet your requirements.
 RIA -
RIA - 
