Power Transmission Seals Market Analysis APAC, Europe, North America, Middle East and Africa, South America - US, China, Japan, India, Germany - Size and Forecast 2024-2028

Power Transmission Seals Market Analysis APAC, Europe, North America, Middle East and Africa, South America - US, China, Japan, India, Germany - Size and Forecast 2024-2028

Published: Dec 2023 183 Pages SKU: IRTNTR45416

Market Overview at a Glance

$1.27 B
Market Opportunity
4.46%
CAGR
4.0
YoY growth 2023-2024(%)

Power Transmission Seals Market Size 2024-2028

The power transmission seals market size is forecast to increase by USD 1.27 billion at a CAGR of 4.46% between 2023 and 2028.

  • The market is driven by several key factors, including the need for effective leakage and wear protection in hydraulic systems. Design advancements, particularly in radial shaft seals, are also contributing to market growth. However, fluctuations In the prices of raw materials used In the production of power transmission seals pose a significant challenge to market participants. Radial shaft seals, commonly referred to as lip seals, are essential components in rotary applications, including hydraulic pumps, axles, valves, and power steering systems. These trends and challenges are shaping the market, providing opportunities for innovation and growth. Effective seals are crucial for maintaining the efficiency and reliability of hydraulic systems, making the development of advanced seals a priority for manufacturers. At the same time, the volatility of raw material prices necessitates a focus on cost management and supply chain optimization. Overall, the market is expected to experience steady growth In the coming years, driven by these market dynamics.

What will be the Size of the Power Transmission Seals Market During the Forecast Period?

Power Transmission Seals Market Size

 Request Free Sample

  • The market plays a crucial role in ensuring the efficient and reliable operation of water purification systems, particularly those employing membrane filtration, deionization, ion exchange, ultraviolet oxidation, reverse osmosis, distillation, activated carbon filtration, electrodialysis, and microporous filtration technologies. Seals In these systems prevent contaminants, including bacteria, suspended particles, and organic compounds, from entering the system and compromising water purity. Water sources, ranging from tap water to ultrapure water, necessitate varying levels of pre-treatment and post-treatment, which in turn impact the demand for power transmission seals. Technologies such as membrane filtration, deionization, and ion exchange require ultrapure water, necessitating seals capable of withstanding stringent purity requirements.
  • Analytical instruments, glassware, and equipment used in cell biology and molecular biology applications also require water of the highest purity, further driving the demand for reliable and accurate power transmission seals. The market is expected to grow due to increasing water treatment infrastructure investments and the need for water purification systems in various industries, including pharmaceuticals, electronics, and food and beverage. Seals must meet stringent requirements for purity, reliability, accuracy, and repeatability to maintain the integrity of water purification systems and ensure the success of downstream applications.

How is this Power Transmission Seals Industry segmented and which is the largest segment?

The power transmission seals industry research report provides comprehensive data (region-wise segment analysis), with forecasts and estimates in "USD billion" for the period 2024-2028, as well as historical data from 2018-2022 for the following segments.

  • Type
    • Radial shaft seals
    • Axial clamp seals
    • Metal face seals
    • Cassette seals
    • Others
  • End-user
    • Heavy industry
    • Automotive industry
    • Machine tools industry
    • Others
  • Geography
    • APAC
      • China
      • India
      • Japan
    • Europe
      • Germany
    • North America
      • US
    • Middle East and Africa
    • South America

By Type Insights

  • The radial shaft seals segment is estimated to witness significant growth during the forecast period.

Radial shaft seals, commonly referred to as lip seals, are essential components in rotary applications, including hydraulic pumps, axles, valves, and power steering systems. These seals ensure the efficient transmission of power by sealing the rotating shaft against the stationary housing. The seals consist of two primary parts: a cylindrical outer cover with an interference fit against the housing bore and a sealing lip that dynamically and statically seals against the shaft. The sealing edge applies a defined radial load against the counter face surface of the shaft. In various industries, such as water, reagent, and pharmaceuticals, the demand for radial shaft seals is significant due to their role in maintaining water quality and quantity in water purification systems, ensuring the reliability and accuracy of analytical instruments, and extending the service life of equipment in laboratory experiments and industrial applications.

Power Transmission Seals Market Size

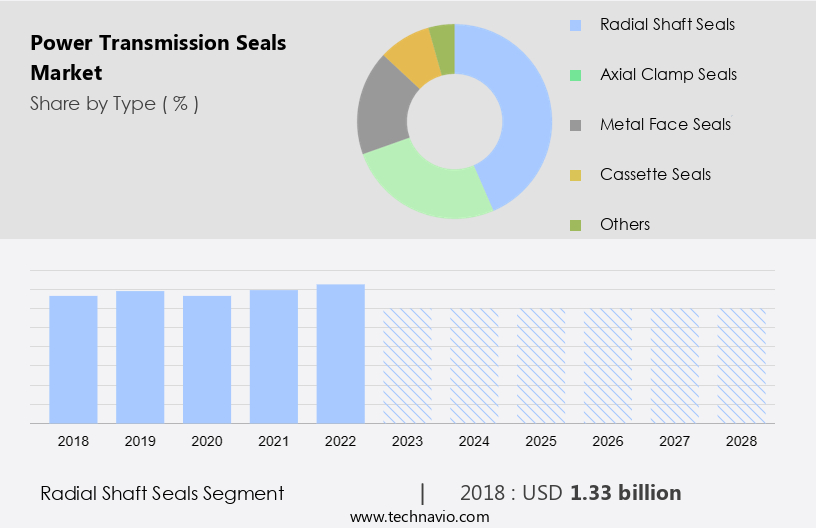
Get a glance at the Power Transmission Seals Industry report of share of various segments Request Free Sample

The radial shaft seals segment was valued at USD 1.33 billion in 2018 and showed a gradual increase during the forecast period.

Regional Analysis

  • APAC is estimated to contribute 44% to the growth of the global market during the forecast period.

Technavio’s analysts have elaborately explained the regional trends and drivers that shape the market during the forecast period.

Power Transmission Seals Market Share by Geography

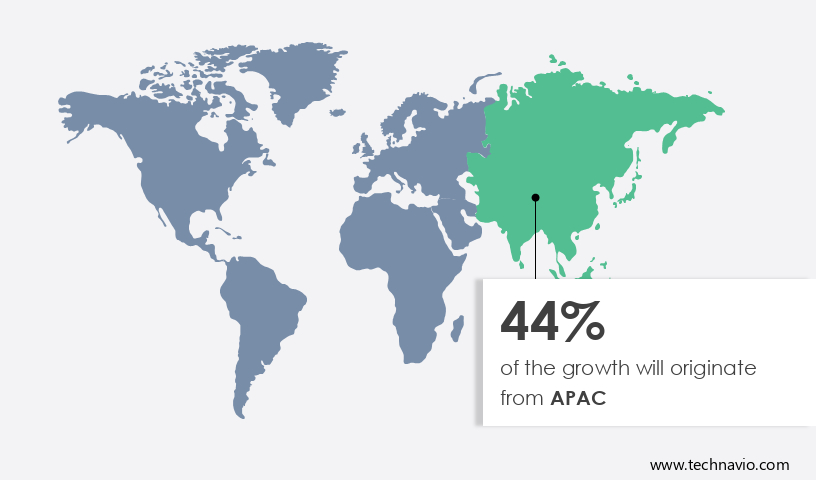
For more insights on the market share of various regions, Request Free Sample

The Asia Pacific market for power transmission seals is witnessing significant growth due to the region's economic expansion and increased industrial activities. With a large number of small and medium enterprises in APAC, there is a growing demand for cost-effective sealing solutions. This has led to intense competition among global manufacturers, with regional companies offering affordable alternatives. The heavy industry sector, which is primarily driven by construction and engineering activities, is a major consumer of power transmission seals. Equipment used in this sector, such as cranes, concrete machinery, excavators, and wheel loaders, require strong and reliable seals to function optimally.

Market Dynamics

Our researchers analyzed the data with 2023 as the base year, along with the key drivers, trends, and challenges. A holistic analysis of drivers will help companies refine their marketing strategies to gain a competitive advantage.

What are the key market drivers leading to the rise In the adoption of Power Transmission Seals Industry?

Protection against leakage and wear in hydraulic systems is the key driver of the market.

  • Power transmission seals play a crucial role in maintaining the efficiency and reliability of various industrial applications, particularly those involving hydraulic systems. In these systems, water contamination is a significant challenge due to the presence of tap water, which may contain various contaminants such as bacteria, suspended particles, and organic compounds. To ensure water purity, various water purification systems, including membrane filtration, deionization, ion exchange, ultraviolet oxidation, reverse osmosis, distillation, and activated carbon filtration, are employed. The selection of appropriate sealing solutions, such as rotary applications like piston seals, rod seals, fluid handling seals, O-rings, back-up rings, wiper seals, and machined seals, is essential to prevent leakage and power loss.
  • In addition, pre-treatment and post-treatment techniques are also employed to enhance the performance and service life of these seals. The purification techniques' reliability, accuracy, and repeatability are essential factors in ensuring the quality and quantity of water used in laboratory experiments and industrial applications. Financial burden, water quality, and water quantity are critical considerations In the selection of sealing solutions, as the cost of maintenance and replacement can be substantial. Sustainability is another essential factor, as seals that reduce friction and require minimal maintenance contribute to the overall efficiency and eco-friendliness of the system.

What are the market trends shaping the Power Transmission Seals Industry?

Design improvements in radial shaft seals is the upcoming market trend.

  • Power transmission seals, including radial shaft seals, play a crucial role in maintaining the efficiency and reliability of water-handling systems in various industries. These seals, used in rotary applications such as pumps, turbines, and compressors, ensure the containment of water and prevent contaminants from entering the system. Water sources for power transmission systems range from tap water to ultrapure water produced through water purification systems. Contaminants in water, such as bacteria, suspended particles, and organic compounds, can negatively impact the performance and service life of seals. Therefore, advanced purification techniques like membrane filtration, deionization, ion exchange, ultraviolet oxidation, reverse osmosis, distillation, activated carbon filtration, electrodialysis, and microporous filtration are employed to ensure water purity.
  • The selection of appropriate sealing solutions for power transmission applications depends on the water quality and quantity requirements, as well as the specific application and equipment performance considerations. Sealing materials, such as elastomers, ceramics, and metals, are chosen based on their compatibility with the water chemistry and the operating conditions. The reliability, accuracy, and repeatability of power transmission seals are essential to minimize financial burdens associated with maintenance and downtime. Proper pre-treatment and post-treatment of water can extend the service life of seals and reduce friction. Sustainability is another critical factor In the selection of sealing solutions, as the industry strives for eco-friendly and cost-effective alternatives.

What challenges does the Power Transmission Seals Industry face during its growth?

Fluctuations in raw material prices of power transmission seals is a key challenge affecting the industry growth.

  • Power transmission seals are essential components in various industries, including water treatment and laboratory applications. In water purification systems, these seals ensure the reliability and accuracy of water treatment processes by preventing contaminants such as bacteria, suspended particles, and organic compounds from entering the system. The purity of the water being treated, whether it's tap water or ultrapure water, is critical in determining the appropriate sealing solution. Manufacturers of power transmission seals use raw materials like cast iron, steel, aluminum, silicon carbide, tungsten carbide, carbon, and alloys to produce seals for rotary applications, piston seals, rod seals, fluid handling seals, O-rings, back-up rings, wiper seals, and machined seals.
  • The prices of these raw materials can significantly impact The market due to fluctuations in market dynamics. For instance, steel, which is commonly used for the outer casing of seals, experiences price changes based on macroeconomic factors such as inflation, labor costs, and regulatory policy changes. The water treatment industry relies heavily on various purification techniques like membrane filtration, deionization, ion exchange, ultraviolet oxidation, reverse osmosis, distillation, and activated carbon filtration. These techniques require precise and consistent performance from power transmission seals to maintain equipment performance and ensure sustainability. Pre-treatment and post-treatment processes also necessitate the use of power transmission seals to ensure the purity and quantity of water used in laboratory experiments and industrial applications.

Exclusive Customer Landscape

The power transmission seals market forecasting report includes the adoption lifecycle of the market, covering from the innovator’s stage to the laggard’s stage. It focuses on adoption rates in different regions based on penetration. Furthermore, the power transmission seals market report also includes key purchase criteria and drivers of price sensitivity to help companies evaluate and develop their market growth analysis strategies.
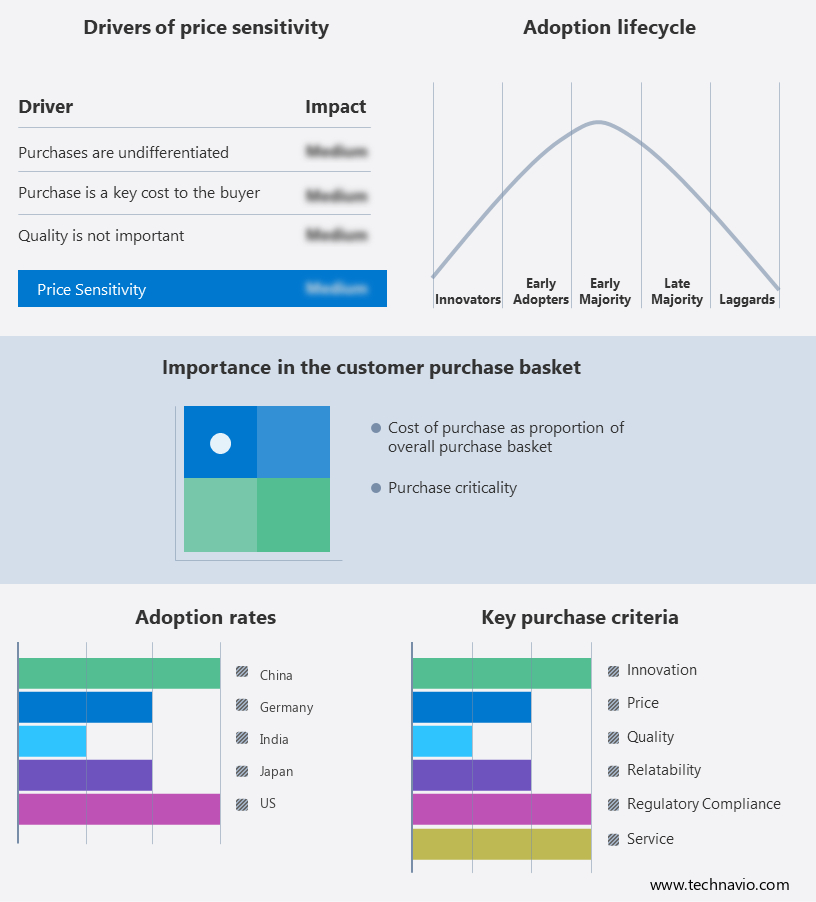
Power Transmission Seals Market Share by Geography

 Customer Landscape

Key Companies & Market Insights

Companies are implementing various strategies, such as strategic alliances, power transmission seals market forecast, partnerships, mergers and acquisitions, geographical expansion, and product/service launches, to enhance their presence In the industry.

The industry research and growth report includes detailed analyses of the competitive landscape of the market and information about key companies, including:

  • A.W. Chesterton Co.
  • AB SKF
  • American High Performance Seals Inc.
  • Antifriction Components Ltd
  • billi sealing technology gmbh
  • Colonial Seal Co.
  • DXP Enterprises Inc.
  • Freudenberg and Co. KG
  • Greene Tweed and Co.
  • Hallite Seals International Ltd.
  • Hi tech Seals Industries
  • IST innovative sealing technologies GmbH
  • James Walker Group Ltd.
  • LATTY International S.A.
  • MFPSeals
  • NAK Sealing Technologies Corp.
  • Parker Hannifin Corp.
  • PRH SEALS GROUP
  • Trelleborg AB
  • Roxtec International AB

Qualitative and quantitative analysis of companies has been conducted to help clients understand the wider business environment as well as the strengths and weaknesses of key industry players. Data is qualitatively analyzed to categorize companies as pure play, category-focused, industry-focused, and diversified; it is quantitatively analyzed to categorize companies as dominant, leading, strong, tentative, and weak.

Research Analyst Overview

The market encompasses a diverse range of sealing solutions designed to ensure the efficient and reliable transfer of power in various industrial applications. These seals play a crucial role in maintaining the performance and service life of equipment by reducing friction, preventing leakage, and protecting against contaminants. Power transmission seals are essential in rotary applications, including piston seals and rod seals, which are commonly used in hydraulic and pneumatic systems. Fluid handling seals, such as o-rings, back-up rings, wiper seals, and machined seals, are also integral components In the transfer of power and fluids in industrial processes. The demand for power transmission seals is driven by the need for improved equipment performance and sustainability.

In addition, the importance of water quality and quantity in industrial processes has led to the increasing use of ultrapure water in various applications, including cell biology and molecular biology. This, in turn, has created a growing demand for seals that can withstand the rigors of ultrapure water environments. The reliability and accuracy of power transmission seals are critical factors in ensuring the repeatability and financial burden of industrial processes. Seals that offer long service life and require minimal maintenance are preferred by manufacturers to reduce downtime and maintenance costs. The market is characterized by a high degree of customization to meet the unique requirements of various industries and applications.

Furthermore, sealing solutions are designed to meet specific performance criteria, including friction reduction, pressure resistance, and temperature tolerance. The sustainability of power transmission seals is a growing concern In the industry, with an increasing focus on the use of eco-friendly materials and manufacturing processes. Seals that offer extended service life and reduced waste are becoming increasingly popular as manufacturers seek to minimize their environmental footprint.

Market Scope

Report Coverage

Details

Page number

183

Base year

2023

Historic period

2018-2022

Forecast period

2024-2028

Growth momentum & CAGR

Accelerate at a CAGR of 4.46%

Market growth 2024-2028

USD 1.27 billion

Market structure

Fragmented

YoY growth 2023-2024(%)

4.0

Key countries

US, China, Japan, India, and Germany

Competitive landscape

Leading Companies, market growth and forecasting, Market Positioning of Companies, Competitive Strategies, and Industry Risks

Request Free Sample

What are the Key Data Covered in this Market Research and Growth Report?

  • CAGR of the Power Transmission Seals industry during the forecast period
  • Detailed information on factors that will drive the growth and forecasting between 2024 and 2028
  • Precise estimation of the size of the market and its contribution of the industry in focus to the parent market
  • Accurate predictions about upcoming growth and trends and changes in consumer behaviour
  • Growth of the market across APAC, Europe, North America, Middle East and Africa, and South America
  • Thorough analysis of the market’s competitive landscape and detailed information about companies
  • Comprehensive analysis of factors that will challenge the power transmission seals market growth of industry companies

We can help! Our analysts can customize this power transmission seals market research report to meet your requirements.

Get in touch

1 Executive Summary

  • 1.1 Market overview
    • Exhibit 01: Executive Summary – Chart on Market Overview
    • Exhibit 02: Executive Summary – Data Table on Market Overview
    • Exhibit 03: Executive Summary – Chart on Global Market Characteristics
    • Exhibit 04: Executive Summary – Chart on Market by Geography
    • Exhibit 05: Executive Summary – Chart on Market Segmentation by Type
    • Exhibit 06: Executive Summary – Chart on Market Segmentation by End-user
    • Exhibit 07: Executive Summary – Chart on Incremental Growth
    • Exhibit 08: Executive Summary – Data Table on Incremental Growth
    • Exhibit 09: Executive Summary – Chart on Vendor Market Positioning

2 Market Landscape

  • 2.1 Market ecosystem
    • Exhibit 10: Parent market
    • Exhibit 11: Market Characteristics

3 Market Sizing

  • 3.1 Market definition
    • Exhibit 12: Offerings of vendors included in the market definition
  • 3.2 Market segment analysis
    • Exhibit 13: Market segments
  • 3.3 Market size 2023
    • 3.4 Market outlook: Forecast for 2023-2028
      • Exhibit 14: Chart on Global - Market size and forecast 2023-2028 ($ billion)
      • Exhibit 15: Data Table on Global - Market size and forecast 2023-2028 ($ billion)
      • Exhibit 16: Chart on Global Market: Year-over-year growth 2023-2028 (%)
      • Exhibit 17: Data Table on Global Market: Year-over-year growth 2023-2028 (%)

    4 Historic Market Size

    • 4.1 Global power transmission seals market 2018 - 2022
      • Exhibit 18: Historic Market Size – Data Table on global power transmission seals market 2018 - 2022 ($ billion)
    • 4.2 Type Segment Analysis 2018 - 2022
      • Exhibit 19: Historic Market Size – Type Segment 2018 - 2022 ($ billion)
    • 4.3 End-user Segment Analysis 2018 - 2022
      • Exhibit 20: Historic Market Size – End-user Segment 2018 - 2022 ($ billion)
    • 4.4 Geography Segment Analysis 2018 - 2022
      • Exhibit 21: Historic Market Size – Geography Segment 2018 - 2022 ($ billion)
    • 4.5 Country Segment Analysis 2018 - 2022
      • Exhibit 22: Historic Market Size – Country Segment 2018 - 2022 ($ billion)

    5 Five Forces Analysis

    • 5.1 Five forces summary
      • Exhibit 23: Five forces analysis - Comparison between 2023 and 2028
    • 5.2 Bargaining power of buyers
      • Exhibit 24: Chart on Bargaining power of buyers – Impact of key factors 2023 and 2028
    • 5.3 Bargaining power of suppliers
      • Exhibit 25: Bargaining power of suppliers – Impact of key factors in 2023 and 2028
    • 5.4 Threat of new entrants
      • Exhibit 26: Threat of new entrants – Impact of key factors in 2023 and 2028
    • 5.5 Threat of substitutes
      • Exhibit 27: Threat of substitutes – Impact of key factors in 2023 and 2028
    • 5.6 Threat of rivalry
      • Exhibit 28: Threat of rivalry – Impact of key factors in 2023 and 2028
    • 5.7 Market condition
      • Exhibit 29: Chart on Market condition - Five forces 2023 and 2028

    6 Market Segmentation by Type

    • 6.1 Market segments
      • Exhibit 30: Chart on Type - Market share 2023-2028 (%)
      • Exhibit 31: Data Table on Type - Market share 2023-2028 (%)
    • 6.2 Comparison by Type
      • Exhibit 32: Chart on Comparison by Type
      • Exhibit 33: Data Table on Comparison by Type
    • 6.3 Radial shaft seals - Market size and forecast 2023-2028
      • Exhibit 34: Chart on Radial shaft seals - Market size and forecast 2023-2028 ($ billion)
      • Exhibit 35: Data Table on Radial shaft seals - Market size and forecast 2023-2028 ($ billion)
      • Exhibit 36: Chart on Radial shaft seals - Year-over-year growth 2023-2028 (%)
      • Exhibit 37: Data Table on Radial shaft seals - Year-over-year growth 2023-2028 (%)
    • 6.4 Axial clamp seals - Market size and forecast 2023-2028
      • Exhibit 38: Chart on Axial clamp seals - Market size and forecast 2023-2028 ($ billion)
      • Exhibit 39: Data Table on Axial clamp seals - Market size and forecast 2023-2028 ($ billion)
      • Exhibit 40: Chart on Axial clamp seals - Year-over-year growth 2023-2028 (%)
      • Exhibit 41: Data Table on Axial clamp seals - Year-over-year growth 2023-2028 (%)
    • 6.5 Metal face seals - Market size and forecast 2023-2028
      • Exhibit 42: Chart on Metal face seals - Market size and forecast 2023-2028 ($ billion)
      • Exhibit 43: Data Table on Metal face seals - Market size and forecast 2023-2028 ($ billion)
      • Exhibit 44: Chart on Metal face seals - Year-over-year growth 2023-2028 (%)
      • Exhibit 45: Data Table on Metal face seals - Year-over-year growth 2023-2028 (%)
    • 6.6 Cassette seals - Market size and forecast 2023-2028
      • Exhibit 46: Chart on Cassette seals - Market size and forecast 2023-2028 ($ billion)
      • Exhibit 47: Data Table on Cassette seals - Market size and forecast 2023-2028 ($ billion)
      • Exhibit 48: Chart on Cassette seals - Year-over-year growth 2023-2028 (%)
      • Exhibit 49: Data Table on Cassette seals - Year-over-year growth 2023-2028 (%)
    • 6.7 Others - Market size and forecast 2023-2028
      • Exhibit 50: Chart on Others - Market size and forecast 2023-2028 ($ billion)
      • Exhibit 51: Data Table on Others - Market size and forecast 2023-2028 ($ billion)
      • Exhibit 52: Chart on Others - Year-over-year growth 2023-2028 (%)
      • Exhibit 53: Data Table on Others - Year-over-year growth 2023-2028 (%)
    • 6.8 Market opportunity by Type
      • Exhibit 54: Market opportunity by Type ($ billion)
      • Exhibit 55: Data Table on Market opportunity by Type ($ billion)

    7 Market Segmentation by End-user

    • 7.1 Market segments
      • Exhibit 56: Chart on End-user - Market share 2023-2028 (%)
      • Exhibit 57: Data Table on End-user - Market share 2023-2028 (%)
    • 7.2 Comparison by End-user
      • Exhibit 58: Chart on Comparison by End-user
      • Exhibit 59: Data Table on Comparison by End-user
    • 7.3 Heavy industry - Market size and forecast 2023-2028
      • Exhibit 60: Chart on Heavy industry - Market size and forecast 2023-2028 ($ billion)
      • Exhibit 61: Data Table on Heavy industry - Market size and forecast 2023-2028 ($ billion)
      • Exhibit 62: Chart on Heavy industry - Year-over-year growth 2023-2028 (%)
      • Exhibit 63: Data Table on Heavy industry - Year-over-year growth 2023-2028 (%)
    • 7.4 Automative industry - Market size and forecast 2023-2028
      • Exhibit 64: Chart on Automative industry - Market size and forecast 2023-2028 ($ billion)
      • Exhibit 65: Data Table on Automative industry - Market size and forecast 2023-2028 ($ billion)
      • Exhibit 66: Chart on Automative industry - Year-over-year growth 2023-2028 (%)
      • Exhibit 67: Data Table on Automative industry - Year-over-year growth 2023-2028 (%)
    • 7.5 Machine tools industry - Market size and forecast 2023-2028
      • Exhibit 68: Chart on Machine tools industry - Market size and forecast 2023-2028 ($ billion)
      • Exhibit 69: Data Table on Machine tools industry - Market size and forecast 2023-2028 ($ billion)
      • Exhibit 70: Chart on Machine tools industry - Year-over-year growth 2023-2028 (%)
      • Exhibit 71: Data Table on Machine tools industry - Year-over-year growth 2023-2028 (%)
    • 7.6 Others - Market size and forecast 2023-2028
      • Exhibit 72: Chart on Others - Market size and forecast 2023-2028 ($ billion)
      • Exhibit 73: Data Table on Others - Market size and forecast 2023-2028 ($ billion)
      • Exhibit 74: Chart on Others - Year-over-year growth 2023-2028 (%)
      • Exhibit 75: Data Table on Others - Year-over-year growth 2023-2028 (%)
    • 7.7 Market opportunity by End-user
      • Exhibit 76: Market opportunity by End-user ($ billion)
      • Exhibit 77: Data Table on Market opportunity by End-user ($ billion)

    8 Customer Landscape

    • 8.1 Customer landscape overview
      • Exhibit 78: Analysis of price sensitivity, lifecycle, customer purchase basket, adoption rates, and purchase criteria

    9 Geographic Landscape

    • 9.1 Geographic segmentation
      • Exhibit 79: Chart on Market share by geography 2023-2028 (%)
      • Exhibit 80: Data Table on Market share by geography 2023-2028 (%)
    • 9.2 Geographic comparison
      • Exhibit 81: Chart on Geographic comparison
      • Exhibit 82: Data Table on Geographic comparison
    • 9.3 APAC - Market size and forecast 2023-2028
      • Exhibit 83: Chart on APAC - Market size and forecast 2023-2028 ($ billion)
      • Exhibit 84: Data Table on APAC - Market size and forecast 2023-2028 ($ billion)
      • Exhibit 85: Chart on APAC - Year-over-year growth 2023-2028 (%)
      • Exhibit 86: Data Table on APAC - Year-over-year growth 2023-2028 (%)
    • 9.4 Europe - Market size and forecast 2023-2028
      • Exhibit 87: Chart on Europe - Market size and forecast 2023-2028 ($ billion)
      • Exhibit 88: Data Table on Europe - Market size and forecast 2023-2028 ($ billion)
      • Exhibit 89: Chart on Europe - Year-over-year growth 2023-2028 (%)
      • Exhibit 90: Data Table on Europe - Year-over-year growth 2023-2028 (%)
    • 9.5 North America - Market size and forecast 2023-2028
      • Exhibit 91: Chart on North America - Market size and forecast 2023-2028 ($ billion)
      • Exhibit 92: Data Table on North America - Market size and forecast 2023-2028 ($ billion)
      • Exhibit 93: Chart on North America - Year-over-year growth 2023-2028 (%)
      • Exhibit 94: Data Table on North America - Year-over-year growth 2023-2028 (%)
    • 9.6 Middle East and Africa - Market size and forecast 2023-2028
      • Exhibit 95: Chart on Middle East and Africa - Market size and forecast 2023-2028 ($ billion)
      • Exhibit 96: Data Table on Middle East and Africa - Market size and forecast 2023-2028 ($ billion)
      • Exhibit 97: Chart on Middle East and Africa - Year-over-year growth 2023-2028 (%)
      • Exhibit 98: Data Table on Middle East and Africa - Year-over-year growth 2023-2028 (%)
    • 9.7 South America - Market size and forecast 2023-2028
      • Exhibit 99: Chart on South America - Market size and forecast 2023-2028 ($ billion)
      • Exhibit 100: Data Table on South America - Market size and forecast 2023-2028 ($ billion)
      • Exhibit 101: Chart on South America - Year-over-year growth 2023-2028 (%)
      • Exhibit 102: Data Table on South America - Year-over-year growth 2023-2028 (%)
    • 9.8 China - Market size and forecast 2023-2028
      • Exhibit 103: Chart on China - Market size and forecast 2023-2028 ($ billion)
      • Exhibit 104: Data Table on China - Market size and forecast 2023-2028 ($ billion)
      • Exhibit 105: Chart on China - Year-over-year growth 2023-2028 (%)
      • Exhibit 106: Data Table on China - Year-over-year growth 2023-2028 (%)
    • 9.9 US - Market size and forecast 2023-2028
      • Exhibit 107: Chart on US - Market size and forecast 2023-2028 ($ billion)
      • Exhibit 108: Data Table on US - Market size and forecast 2023-2028 ($ billion)
      • Exhibit 109: Chart on US - Year-over-year growth 2023-2028 (%)
      • Exhibit 110: Data Table on US - Year-over-year growth 2023-2028 (%)
    • 9.10 Germany - Market size and forecast 2023-2028
      • Exhibit 111: Chart on Germany - Market size and forecast 2023-2028 ($ billion)
      • Exhibit 112: Data Table on Germany - Market size and forecast 2023-2028 ($ billion)
      • Exhibit 113: Chart on Germany - Year-over-year growth 2023-2028 (%)
      • Exhibit 114: Data Table on Germany - Year-over-year growth 2023-2028 (%)
    • 9.11 Japan - Market size and forecast 2023-2028
      • Exhibit 115: Chart on Japan - Market size and forecast 2023-2028 ($ billion)
      • Exhibit 116: Data Table on Japan - Market size and forecast 2023-2028 ($ billion)
      • Exhibit 117: Chart on Japan - Year-over-year growth 2023-2028 (%)
      • Exhibit 118: Data Table on Japan - Year-over-year growth 2023-2028 (%)
    • 9.12 India - Market size and forecast 2023-2028
      • Exhibit 119: Chart on India - Market size and forecast 2023-2028 ($ billion)
      • Exhibit 120: Data Table on India - Market size and forecast 2023-2028 ($ billion)
      • Exhibit 121: Chart on India - Year-over-year growth 2023-2028 (%)
      • Exhibit 122: Data Table on India - Year-over-year growth 2023-2028 (%)
    • 9.13 Market opportunity by geography
      • Exhibit 123: Market opportunity by geography ($ billion)
      • Exhibit 124: Data Tables on Market opportunity by geography ($ billion)

    10 Drivers, Challenges, and Trends

    • 10.1 Market drivers
      • 10.2 Market challenges
        • 10.3 Impact of drivers and challenges
          • Exhibit 125: Impact of drivers and challenges in 2023 and 2028
        • 10.4 Market trends

          11 Vendor Landscape

          • 11.1 Overview
            • 11.2 Vendor landscape
              • Exhibit 126: Overview on Criticality of inputs and Factors of differentiation
            • 11.3 Landscape disruption
              • Exhibit 127: Overview on factors of disruption
            • 11.4 Industry risks
              • Exhibit 128: Impact of key risks on business

            12 Vendor Analysis

            • 12.1 Vendors covered
              • Exhibit 129: Vendors covered
            • 12.2 Market positioning of vendors
              • Exhibit 130: Matrix on vendor position and classification
            • 12.3 A.W. Chesterton Co.
              • Exhibit 131: A.W. Chesterton Co. - Overview
              • Exhibit 132: A.W. Chesterton Co. - Product / Service
              • Exhibit 133: A.W. Chesterton Co. - Key offerings
            • 12.4 AB SKF
              • Exhibit 134: AB SKF - Overview
              • Exhibit 135: AB SKF - Business segments
              • Exhibit 136: AB SKF - Key news
              • Exhibit 137: AB SKF - Key offerings
              • Exhibit 138: AB SKF - Segment focus
            • 12.5 American High Performance Seals Inc.
              • Exhibit 139: American High Performance Seals Inc. - Overview
              • Exhibit 140: American High Performance Seals Inc. - Product / Service
              • Exhibit 141: American High Performance Seals Inc. - Key offerings
            • 12.6 Antifriction Components Ltd
              • Exhibit 142: Antifriction Components Ltd - Overview
              • Exhibit 143: Antifriction Components Ltd - Product / Service
              • Exhibit 144: Antifriction Components Ltd - Key offerings
            • 12.7 Colonial Seal Co.
              • Exhibit 145: Colonial Seal Co. - Overview
              • Exhibit 146: Colonial Seal Co. - Product / Service
              • Exhibit 147: Colonial Seal Co. - Key offerings
            • 12.8 DXP Enterprises Inc.
              • Exhibit 148: DXP Enterprises Inc. - Overview
              • Exhibit 149: DXP Enterprises Inc. - Business segments
              • Exhibit 150: DXP Enterprises Inc. - Key offerings
              • Exhibit 151: DXP Enterprises Inc. - Segment focus
            • 12.9 Freudenberg and Co. KG
              • Exhibit 152: Freudenberg and Co. KG - Overview
              • Exhibit 153: Freudenberg and Co. KG - Business segments
              • Exhibit 154: Freudenberg and Co. KG - Key news
              • Exhibit 155: Freudenberg and Co. KG - Key offerings
              • Exhibit 156: Freudenberg and Co. KG - Segment focus
            • 12.10 Greene Tweed and Co.
              • Exhibit 157: Greene Tweed and Co. - Overview
              • Exhibit 158: Greene Tweed and Co. - Product / Service
              • Exhibit 159: Greene Tweed and Co. - Key offerings
            • 12.11 Hallite Seals International Ltd.
              • Exhibit 160: Hallite Seals International Ltd. - Overview
              • Exhibit 161: Hallite Seals International Ltd. - Product / Service
              • Exhibit 162: Hallite Seals International Ltd. - Key offerings
            • 12.12 James Walker Group Ltd.
              • Exhibit 163: James Walker Group Ltd. - Overview
              • Exhibit 164: James Walker Group Ltd. - Product / Service
              • Exhibit 165: James Walker Group Ltd. - Key offerings
            • 12.13 LATTY International S.A.
              • Exhibit 166: LATTY International S.A. - Overview
              • Exhibit 167: LATTY International S.A. - Product / Service
              • Exhibit 168: LATTY International S.A. - Key offerings
            • 12.14 MFPSeals
              • Exhibit 169: MFPSeals - Overview
              • Exhibit 170: MFPSeals - Product / Service
              • Exhibit 171: MFPSeals - Key offerings
            • 12.15 NAK Sealing Technologies Corp.
              • Exhibit 172: NAK Sealing Technologies Corp. - Overview
              • Exhibit 173: NAK Sealing Technologies Corp. - Product / Service
              • Exhibit 174: NAK Sealing Technologies Corp. - Key offerings
            • 12.16 Parker Hannifin Corp.
              • Exhibit 175: Parker Hannifin Corp. - Overview
              • Exhibit 176: Parker Hannifin Corp. - Business segments
              • Exhibit 177: Parker Hannifin Corp. - Key news
              • Exhibit 178: Parker Hannifin Corp. - Key offerings
              • Exhibit 179: Parker Hannifin Corp. - Segment focus
            • 12.17 Trelleborg AB
              • Exhibit 180: Trelleborg AB - Overview
              • Exhibit 181: Trelleborg AB - Business segments
              • Exhibit 182: Trelleborg AB - Key news
              • Exhibit 183: Trelleborg AB - Key offerings
              • Exhibit 184: Trelleborg AB - Segment focus

            13 Appendix

            • 13.1 Scope of the report
              • 13.2 Inclusions and exclusions checklist
                • Exhibit 185: Inclusions checklist
                • Exhibit 186: Exclusions checklist
              • 13.3 Currency conversion rates for US$
                • Exhibit 187: Currency conversion rates for US$
              • 13.4 Research methodology
                • Exhibit 188: Research methodology
                • Exhibit 189: Validation techniques employed for market sizing
                • Exhibit 190: Information sources
              • 13.5 List of abbreviations
                • Exhibit 191: List of abbreviations

              Research Methodology

              Technavio presents a detailed picture of the market by way of study, synthesis, and summation of data from multiple sources. The analysts have presented the various facets of the market with a particular focus on identifying the key industry influencers. The data thus presented is comprehensive, reliable, and the result of extensive research, both primary and secondary.

              INFORMATION SOURCES

              Primary sources

              • Manufacturers and suppliers
              • Channel partners
              • Industry experts
              • Strategic decision makers

              Secondary sources

              • Industry journals and periodicals
              • Government data
              • Financial reports of key industry players
              • Historical data
              • Press releases

              DATA ANALYSIS

              Data Synthesis

              • Collation of data
              • Estimation of key figures
              • Analysis of derived insights

              Data Validation

              • Triangulation with data models
              • Reference against proprietary databases
              • Corroboration with industry experts

              REPORT WRITING

              Qualitative

              • Market drivers
              • Market challenges
              • Market trends
              • Five forces analysis

              Quantitative

              • Market size and forecast
              • Market segmentation
              • Geographical insights
              • Competitive landscape

              Interested in this report?

              Get your sample now to see our research methodology and insights!

              Download Now

              Frequently Asked Questions

              Power Transmission Seals market growth will increase by $ 1.27 bn during 2024-2028 .

              The Power Transmission Seals market is expected to grow at a CAGR of 4.46% during 2024-2028 .

              Power Transmission Seals market is segmented by Type( Radial shaft seals, Axial clamp seals, Metal face seals, Cassette seals, Others) End-user( Heavy industry, Automotive industry, Machine tools industry, Others)

              A.W. Chesterton Co., AB SKF, American High Performance Seals Inc., Antifriction Components Ltd, billi sealing technology gmbh, Colonial Seal Co., DXP Enterprises Inc., Freudenberg and Co. KG, Greene Tweed and Co., Hallite Seals International Ltd., Hi tech Seals Industries, IST innovative sealing technologies GmbH, James Walker Group Ltd., LATTY International S.A., MFPSeals, NAK Sealing Technologies Corp., Parker Hannifin Corp., PRH SEALS GROUP, Trelleborg AB, Roxtec International AB are a few of the key vendors in the Power Transmission Seals market.

              APAC will register the highest growth rate of 44% among the other regions. Therefore, the Power Transmission Seals market in APAC is expected to garner significant business opportunities for the vendors during the forecast period.

              US, China, Japan, India, Germany

              • Protection against leakage and wear in hydraulic systemsHydraulic systems are distinct from other general systems is the driving factor this market.
              • as they have to deal extensively with an excessive amount of moisture; even the equipment that is specifically designed to handle moisture is prone to rusting after a certain period of time is the driving factor this market.
              • as not every part used in equipment can withstand the same moisture level. Leakage can result from poor system design is the driving factor this market.
              • poor quality control tolerances during the manufacturing of a component is the driving factor this market.
              • incorrect component selection is the driving factor this market.
              • and the incorrect overhaul of rebuilt components. System performance is the driving factor this market.
              • reliability is the driving factor this market.
              • and increased operating temperatures are the first signs of excessive internal leakage. The major power loss hydraulic systems usually experience is due to the result of internal leakage on pumps and motors. This leakage is the result of excessive clearances within the pumping mechanisms of pumps and motors is the driving factor this market.
              • resulting in reduced volumetric efficiency. Hence is the driving factor this market.
              • leakage in such equipment results in damage to the internal components or peripheral equipment. In general is the driving factor this market.
              • an appropriate volume of leakage protection is needed between the rod and the seal of the equipment to prevent leakage and wear. Over a certain period of time is the driving factor this market.
              • seals that are made for general operations start getting contaminated when exposed to a large amount of moisture content. However is the driving factor this market.
              • power transmission seals not only work efficiently in such environments but also perform well for a longer period of time when compared with regular seals. With the higher requirement of leakage protection in heavy-duty industrial applications is the driving factor this market.
              • the demand for power transmission seals will increase the growth rate of the global power transmission seals market during the forecast period. is the driving factor this market.

              The Power Transmission Seals market vendors should focus on grabbing business opportunities from the Radial shaft seals segment as it accounted for the largest market share in the base year.