Ultrapure Water Market Size 2023-2027
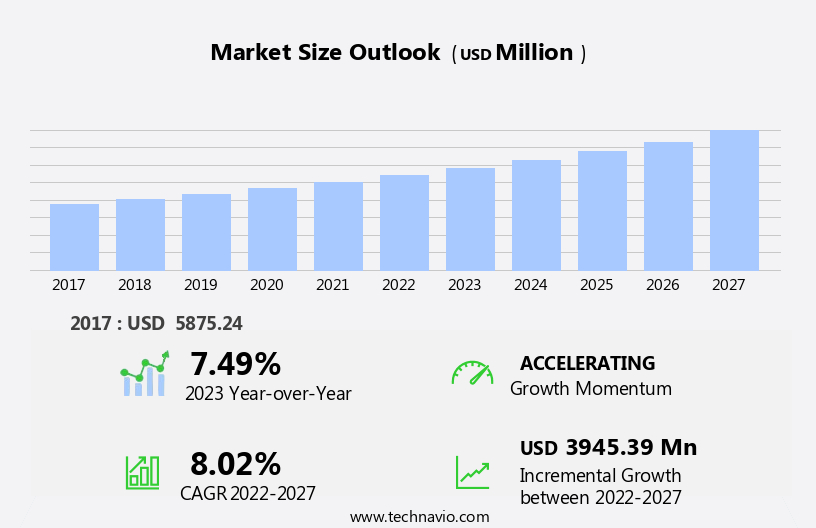
The ultrapure water market size is forecast to increase by USD 3.95 billion, at a CAGR of 8.02% between 2022 and 2027.
- The market is driven by the increasing demand for larger semiconductor wafer sizes and the rapid evolution in the microelectronics sector. Ultrapure water is essential in the production of semiconductors, and the trend towards larger wafer sizes necessitates a corresponding increase in the demand for high-quality ultrapure water. This need is further amplified by the continuous advancements in microelectronics, which require increasingly stringent water purity standards. However, the market also faces significant challenges. Contamination in ultrapure water piping systems remains a major obstacle, threatening the integrity of the water supply and potentially leading to costly production downtime.
- Ensuring the maintenance and integrity of these systems is a critical concern for market participants. Effective management of contamination risks will be key to mitigating this challenge and ensuring the long-term success of ultrapure water suppliers in the industry. Companies seeking to capitalize on market opportunities and navigate these challenges effectively must prioritize the development and implementation of robust water purification technologies and rigorous system maintenance protocols.
What will be the Size of the Ultrapure Water Market during the forecast period?

Request Free Sample
The market continues to evolve, driven by the diverse requirements of various sectors. Entities such as purified water and high-purity water play a crucial role in semiconductor manufacturing, ensuring the production of flawless chips. Water reuse, a key focus in water conservation, is gaining momentum in power generation, enabling energy efficiency and reducing water footprint. Water dechlorination is essential in water treatment systems, removing harmful chlorine and chloramines. Membrane filtration, including reverse osmosis and nanofiltration membranes, is a cornerstone of water polishing and process control. Ultraviolet oxidation and electrodialysis reversal are integral to water quality monitoring, removing heavy metals and dissolved organic matter.
Di resins, essential in water softening, contribute to process control and water treatment systems. In the pharmaceutical sector, water for injection and analytical chemistry necessitate the highest water purity standards. The integration of ultrafiltration membranes, activated carbon, and water filtration systems ensures the production of water suitable for these applications. The market dynamics of ultrapure water are continually unfolding, with ongoing research in areas like water footprint, particle count, and energy efficiency shaping the future landscape. The interplay between these entities underscores the importance of adaptability and innovation in the market.
How is this Ultrapure Water Industry segmented?
The ultrapure water industry research report provides comprehensive data (region-wise segment analysis), with forecasts and estimates in "USD million" for the period 2023-2027, as well as historical data from 2017-2021 for the following segments.
- Application
- Washing fluid
- Process feed
- End-user
- Semiconductor
- Power
- Pharmaceutical
- Others
- Technology
- Reverse Osmosis
- Ultrafiltration
- Nanofiltration
- Ion Exchange Resin
- Tank Vent Filtration
- Resin Trap Filtration
- Degasification
- Electrodeionization
- Others
- Geography
- North America
- Europe
- Middle East and Africa
- APAC
- South America
- Rest of World (ROW)
By Application Insights
The washing fluid segment is estimated to witness significant growth during the forecast period.
Ultrapure water is an essential component in various industries, serving as a washing fluid to maintain cleanliness and purity in processes. In semiconductor manufacturing, for instance, ultrapure water is indispensable due to the industry's stringent requirements for impurity-free environments. This water is used to remove particles, contaminants, and residues that could negatively impact product performance, quality, and safety. Water recycling plays a significant role in ultrapure water production, reducing the overall water footprint and promoting sustainability. Membrane filtration technologies, including reverse osmosis and nanofiltration membranes, are widely used for water purification. These membranes effectively remove heavy metals, total organic carbon, and dissolved oxygen, ensuring the highest water quality.
Water softening and water treatment systems employ di resins and activated carbon to further enhance water purity. Energy efficiency is a crucial factor in ultrapure water production, with technologies like electrodialysis reversal and UV oxidation contributing to minimizing energy consumption. Water reuse is another trend, with industries focusing on water conservation and reducing their reliance on freshwater sources. Pharmaceutical manufacturing, power generation, and laboratory research also rely on ultrapure water for their processes. Water polishing, membrane filtration, and process control techniques ensure consistent water quality. Analytical chemistry and water quality monitoring are integral parts of maintaining the purity and integrity of ultrapure water.
In summary, the demand for ultrapure water continues to grow as industries seek to enhance their processes, ensure product quality, and promote sustainability. Technologies like membrane filtration, water recycling, and energy-efficient production methods are driving the market's evolution.

Request Free Sample
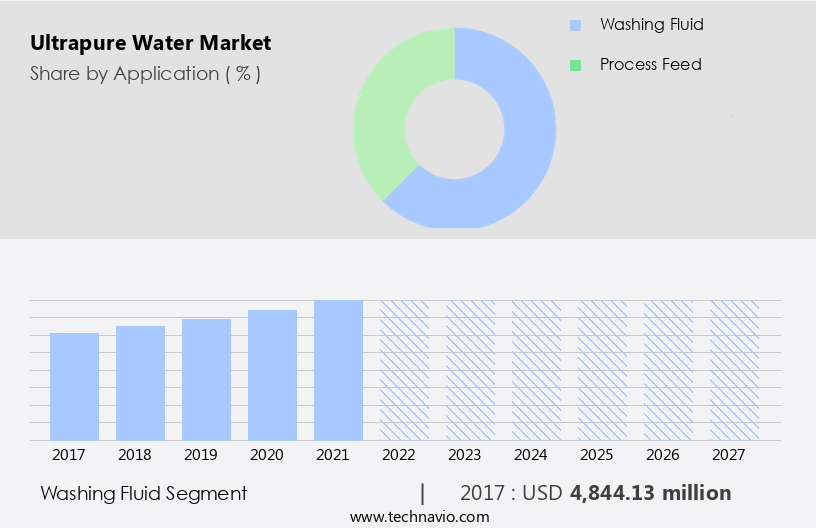
The Washing fluid segment was valued at USD 4.84 billion in 2017 and showed a gradual increase during the forecast period.
Regional Analysis
APAC is estimated to contribute 49% to the growth of the global market during the forecast period. Technavio's analysts have elaborately explained the regional trends and drivers that shape the market during the forecast period.

Request Free Sample
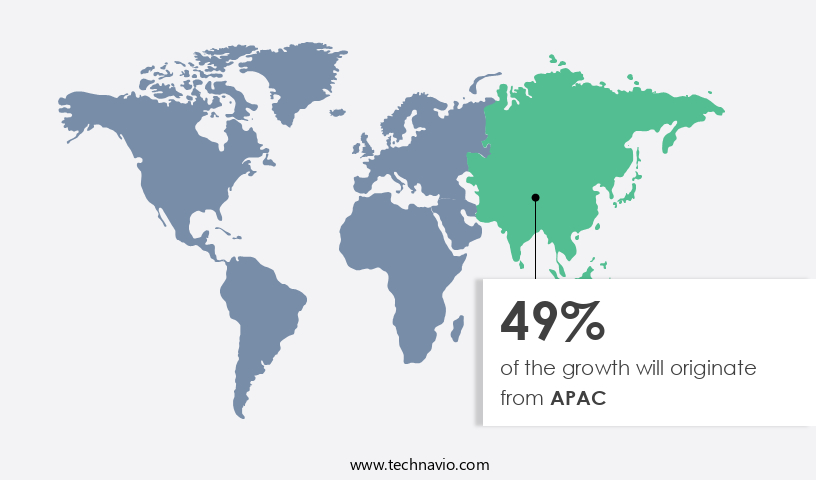
The market is witnessing significant growth, particularly in Asia Pacific (APAC), driven by the increasing demand from industries such as pharmaceuticals, semiconductor manufacturing, and power generation. In APAC, China, Taiwan, South Korea, and Japan are the major contributors to the market due to the presence of key players like Taiwan Semiconductor Manufacturing Co. (TSMC), Samsung Electronics Co. Ltd., United Microelectronics Corp., and Semiconductor Manufacturing International Corp. (SMIC), which require large quantities of ultrapure water for their manufacturing processes. The demand for ultrapure water is increasing due to the need for water recycling in semiconductor manufacturing, energy efficiency, and water conservation.
Reverse osmosis, ultrafiltration membranes, and nanofiltration membranes are commonly used technologies for producing ultrapure water. Additionally, water quality monitoring, heavy metals removal, and dissolved oxygen control are essential for maintaining water purity. Water reuse, water dechlorination, and power generation are other applications driving the market's growth. Water treatment systems, water filtration systems, and water purification systems are used to ensure the production of high-quality ultrapure water. The market is also witnessing advancements in technologies such as electrodialysis reversal, UV oxidation, and membrane filtration. Analytical chemistry and process control are crucial aspects of ultrapure water production, ensuring the removal of total organic carbon, particle count, and other contaminants.
The market's growth is expected to continue as industries prioritize water recycling, energy efficiency, and water conservation.
Market Dynamics
Our researchers analyzed the data with 2022 as the base year, along with the key drivers, trends, and challenges. A holistic analysis of drivers will help companies refine their marketing strategies to gain a competitive advantage.
What are the key market drivers leading to the rise in the adoption of Ultrapure Water Industry?
- The expansion in semiconductor wafer size serves as the primary catalyst for market growth.
- Ultrapure water plays a vital role in semiconductor manufacturing, specifically in the production of contaminant-free semiconductor wafers. The semiconductor industry's shift towards larger 300mm wafers, which have reduced manufacturing costs, has led to increased demand for ultrapure water. According to industry estimates, existing 300mm fabs require 1.5-4.5 million gallons of ultrapure water daily. This water undergoes rigorous water quality monitoring, including particle count and water footprint assessment, to ensure its purity.
- Technologies such as ultrafiltration membranes, water polishing, and reverse osmosis membranes are employed for water purification. Semiconductor manufacturers are investing heavily to upgrade and construct new facilities, emphasizing the importance of energy efficiency and analytical chemistry in the ultrapure water production process.
What are the market trends shaping the Ultrapure Water Industry?
- The microelectronics sector is currently undergoing rapid evolution, serving as the most significant market trend. This sector's continuous advancements are crucial for technological progress.
- Ultrapure water plays a crucial role in the microelectronics industry, particularly in semiconductor manufacturing, where it is used to clean semiconductor wafers. The semiconductor sector, which includes flat panel displays and photovoltaics, is experiencing significant growth, leading to an increasing demand for large volumes of ultrapure water. In addition to semiconductors, this high-purity water is essential for various applications in power generation, such as cooling and demineralization. Membrane filtration and deionization processes are commonly used to produce ultrapure water. Di resins, a type of ion exchange resin, are often employed in these processes to remove impurities. Water reuse is also a significant trend in the industry, with wastewater being treated and recycled for various applications.
- The complexity of modern microelectronics devices, including photovoltaics and flat panel displays, is driving the need for increasingly pure water. As the microelectronics industry continues to grow and innovate, the demand for ultrapure water is expected to follow suit. The microelectronics industry's reliance on ultrapure water is a critical factor in the production of semiconductors, flat panel displays, and photovoltaics. The increasing complexity of these devices, coupled with the industry's growth trajectory, ensures that the demand for ultrapure water will remain strong.
What challenges does the Ultrapure Water Industry face during its growth?
- Ultrapure water piping systems face a significant challenge from contamination, which poses a threat to industry growth. This issue necessitates continuous efforts to maintain stringent purity standards and prevent potential contaminants from entering the water supply.
- Ultrapure water is essential for various industries, including laboratory research and water treatment. The quality of ultrapure water is paramount to ensure its effectiveness and prevent contamination. Contamination in ultrapure water systems can occur due to several reasons, including the quality of piping systems. Ionic contamination is a significant concern and can result from the presence of chlorides, nitrites, nitrates, sulfates, fluorides, and phosphates. Organic contamination can stem from biological growth, while metallic contamination can originate from the piping material itself. To address these challenges, advanced water filtration systems employ technologies such as nanofiltration membranes, UV oxidation, electrodialysis reversal, and activated carbon.
- These systems ensure the removal of contaminants, providing high-purity water. The importance of water conservation has led to the development of more efficient and sustainable water treatment and purification systems. By implementing these technologies, industries can maintain the integrity of their ultrapure water systems and ensure the success of their operations.
Exclusive Customer Landscape
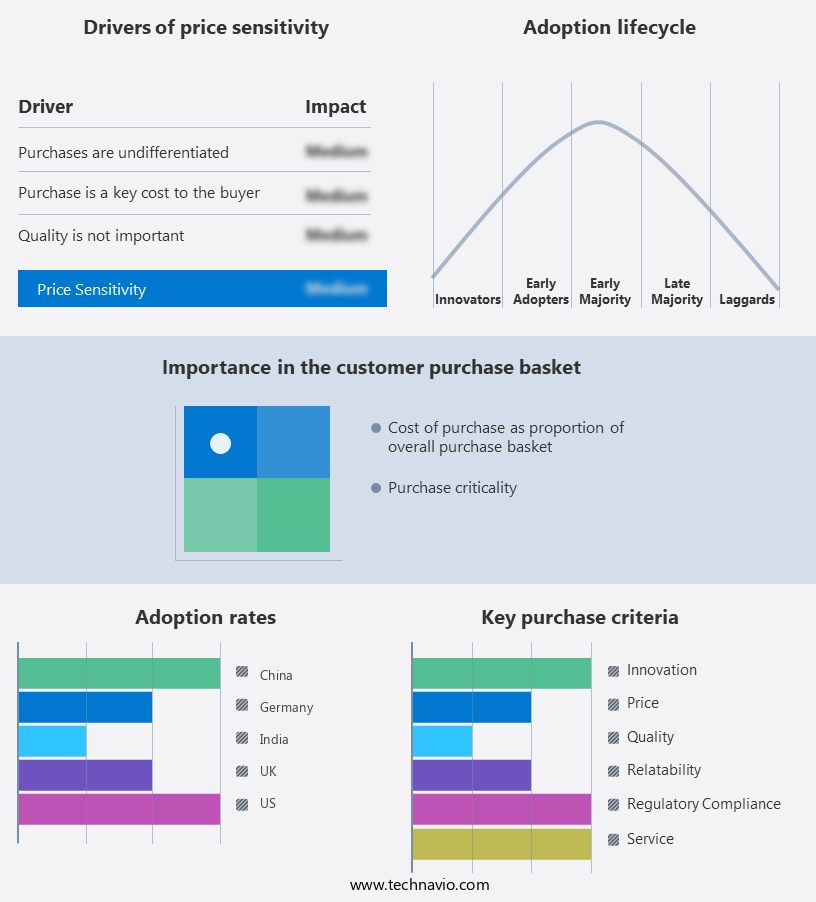
The ultrapure water market forecasting report includes the adoption lifecycle of the market, covering from the innovator's stage to the laggard's stage. It focuses on adoption rates in different regions based on penetration. Furthermore, the ultrapure water market report also includes key purchase criteria and drivers of price sensitivity to help companies evaluate and develop their market growth analysis strategies.

Customer Landscape
Key Companies & Market Insights
Companies are implementing various strategies, such as strategic alliances, ultrapure water market forecast, partnerships, mergers and acquisitions, geographical expansion, and product/service launches, to enhance their presence in the industry.
3M - The company specializes in providing ultrapure water solutions tailored to the semiconductor industry.
The industry research and growth report includes detailed analyses of the competitive landscape of the market and information about key companies, including:
- 3M
- Asahi Kasei Corporation
- Dow
- DuPont
- Ecolab
- Evoqua Water Technologies
- GE Water and Process Technologies
- Hitachi Ltd.
- Hongsen Huanbao
- Hyflux
- Kurita Water Industries Ltd.
- Labaqua
- Mar-Cor Purification
- MANN+HUMMEL Water & Fluid Solutions
- Nalco
- Organo Corp
- Osmoflo
- Ovivo Inc.
- Pall Corporation
- Pure Water No.1
- Suez
- Thermo Fisher Scientific
- Veolia
- WaterProfessionals
- Xylem Inc.
Qualitative and quantitative analysis of companies has been conducted to help clients understand the wider business environment as well as the strengths and weaknesses of key industry players. Data is qualitatively analyzed to categorize companies as pure play, category-focused, industry-focused, and diversified; it is quantitatively analyzed to categorize companies as dominant, leading, strong, tentative, and weak.
Recent Development and News in Ultrapure Water Market
- In March 2025, Siemens Water Technologies announced the launch of its new Ultrapure Water System, featuring advanced membrane filtration technology, which can produce water with a resistivity of up to 18.2 megohm-cm, catering to the stringent requirements of the semiconductor and pharmaceutical industries (Siemens Press Release, 2025).
- In January 2024, Veolia Water Technologies and Dow Water & Process Solutions formed a strategic partnership to offer integrated ultrapure water solutions, combining Veolia's expertise in water treatment and Dow's membrane filtration technologies, targeting the electronics, pharmaceutical, and food industries (Veolia Water Technologies Press Release, 2024).
- In July 2023, Evoqua Water Technologies completed the acquisition of UltraPure Water Technologies, expanding its ultrapure water business and enhancing its product portfolio with UltraPure's advanced reverse osmosis and nanofiltration technologies (Evoqua Water Technologies Press Release, 2023).
- In April 2022, the European Union passed the Drinking Water Directive 2022/XX, which mandates stricter regulations for ultrapure water used in critical applications, driving the market growth and investment in advanced water treatment technologies (European Parliament and Council of the European Union, 2022).
Research Analyst Overview
- The market encompasses various technologies and equipment used in the production and management of water with exceptional purity levels. Key trends include water reuse technology and process optimization in water purification plants. Water quality control is paramount in ensuring water sustainability and security. Water sampling and analysis employ techniques such as membrane technology, UV lamps, ozone generators, and ion exchange. Water treatment engineering integrates filtration technology, water treatment equipment, and water distribution systems to ensure water quality. Water treatment plants address water scarcity through online monitoring, water testing, and water recycling technology. Chlorine generators and water treatment chemicals are essential components in maintaining water quality.
- Cleaning validation and water softeners are crucial in various industries, with carbon filters and mixed bed systems used for specific applications. Ultrapure water production relies on advanced technologies, ensuring stringent water quality standards for diverse sectors. Overall, the market focuses on enhancing water management and ensuring water security through continuous innovation and technology advancements.
Dive into Technavio's robust research methodology, blending expert interviews, extensive data synthesis, and validated models for unparalleled Ultrapure Water Market insights. See full methodology.
Market Scope
|
Report Coverage
|
Details
|
Page number
|
176
|
Base year
|
2022
|
Historic period
|
2017-2021 |
Forecast period
|
2023-2027
|
Growth momentum & CAGR
|
Accelerate at a CAGR of 8.02%
|
Market growth 2023-2027
|
USD 3945.39 million
|
Market structure
|
Fragmented
|
YoY growth 2022-2023(%)
|
7.49
|
Key countries
|
US, Canada, Germany, UK, Italy, France, China, India, Japan, Egypt, Oman, Argentina, KSA, UAE, and Brazil
|
Competitive landscape
|
Leading Companies, Market Positioning of Companies, Competitive Strategies, and Industry Risks
|
Request Free Sample
What are the Key Data Covered in this Ultrapure Water Market Research and Growth Report?
- CAGR of the Ultrapure Water industry during the forecast period
- Detailed information on factors that will drive the growth and forecasting between 2023 and 2027
- Precise estimation of the size of the market and its contribution of the industry in focus to the parent market
- Accurate predictions about upcoming growth and trends and changes in consumer behaviour
- Growth of the market across APAC, Europe, North America, Middle East and Africa, and South America
- Thorough analysis of the market's competitive landscape and detailed information about companies
- Comprehensive analysis of factors that will challenge the ultrapure water market growth of industry companies
We can help! Our analysts can customize this ultrapure water market research report to meet your requirements.
Get in touch
1 Executive Summary
- 1.1 Market overview
- Exhibit 01: Executive Summary – Chart on Market Overview
- Exhibit 02: Executive Summary – Data Table on Market Overview
- Exhibit 03: Executive Summary – Chart on Global Market Characteristics
- Exhibit 04: Executive Summary – Chart on Market by Geography
- Exhibit 05: Executive Summary – Chart on Market Segmentation by Application
- Exhibit 06: Executive Summary – Chart on Market Segmentation by End-user
- Exhibit 07: Executive Summary – Chart on Incremental Growth
- Exhibit 08: Executive Summary – Data Table on Incremental Growth
- Exhibit 09: Executive Summary – Chart on Vendor Market Positioning
2 Market Landscape
- 2.1 Market ecosystem
- Exhibit 10: Parent market
- Exhibit 11: Market Characteristics
3 Market Sizing
- 3.1 Market definition
- Exhibit 12: Offerings of vendors included in the market definition
- 3.2 Market segment analysis
- Exhibit 13: Market segments
- 3.4 Market outlook: Forecast for 2022-2027
- Exhibit 14: Chart on Global - Market size and forecast 2022-2027 ($ million)
- Exhibit 15: Data Table on Global - Market size and forecast 2022-2027 ($ million)
- Exhibit 16: Chart on Global Market: Year-over-year growth 2022-2027 (%)
- Exhibit 17: Data Table on Global Market: Year-over-year growth 2022-2027 (%)
4 Historic Market Size
- 4.1 Global ultrapure water market 2017 - 2021
- Exhibit 18: Historic Market Size – Data Table on global ultrapure water market 2017 - 2021 ($ million)
- 4.2 Geography Segment Analysis 2017 - 2021
- Exhibit 19: Historic Market Size – Geography Segment 2017 - 2021 ($ million)
- 4.3 Application Segment Analysis 2017 - 2021
- Exhibit 20: Historic Market Size – Application Segment 2017 - 2021 ($ million)
- 4.4 End-user Segment Analysis 2017 - 2021
- Exhibit 21: Historic Market Size – End-user Segment 2017 - 2021 ($ million)
- 4.5 Country Segment Analysis 2017 - 2021
- Exhibit 22: Historic Market Size – Country Segment 2017 - 2021 ($ million)
5 Five Forces Analysis
- 5.1 Five forces summary
- Exhibit 23: Five forces analysis - Comparison between 2022 and 2027
- 5.2 Bargaining power of buyers
- Exhibit 24: Chart on Bargaining power of buyers – Impact of key factors 2022 and 2027
- 5.3 Bargaining power of suppliers
- Exhibit 25: Bargaining power of suppliers – Impact of key factors in 2022 and 2027
- 5.4 Threat of new entrants
- Exhibit 26: Threat of new entrants – Impact of key factors in 2022 and 2027
- 5.5 Threat of substitutes
- Exhibit 27: Threat of substitutes – Impact of key factors in 2022 and 2027
- 5.6 Threat of rivalry
- Exhibit 28: Threat of rivalry – Impact of key factors in 2022 and 2027
- 5.7 Market condition
- Exhibit 29: Chart on Market condition - Five forces 2022 and 2027
6 Market Segmentation by Application
- 6.1 Market segments
- Chart on Application - Market share (2022-2027) (%)
- Data Table on Application - Market share (2022-2027) (%)
- 6.2 Comparison by Application
- Chart on Comparison by Application
- Data Table on Comparison by Application
- 6.3 Washing fluid - Market size and forecast (2022-2027)
- Chart on Washing fluid - Market size and forecast (2022-2027) ($ million)
- Data Table on Washing fluid - Market size and forecast (2022-2027) ($ million)
- Chart on Washing fluid - Year-over-year growth (2022-2027) (%)
- Data Table on Washing fluid - Year-over-year growth (2022-2027) (%)
- 6.4 Process feed - Market size and forecast (2022-2027)
- Chart on Process feed - Market size and forecast (2022-2027) ($ million)
- Data Table on Process feed - Market size and forecast (2022-2027) ($ million)
- Chart on Process feed - Year-over-year growth (2022-2027) (%)
- Data Table on Process feed - Year-over-year growth (2022-2027) (%)
- 6.5 Market opportunity by Application
- Market opportunity by Application ($ million)
- Data Table on Market opportunity by Application ($ million)
7 Market Segmentation by End-user
- 7.1 Market segments
- Chart on End-user - Market share (2022-2027) (%)
- Data Table on End-user - Market share (2022-2027) (%)
- 7.2 Comparison by End-user
- Chart on Comparison by End-user
- Data Table on Comparison by End-user
- 7.3 Semiconductor - Market size and forecast (2022-2027)
- Chart on Semiconductor - Market size and forecast (2022-2027) ($ million)
- Data Table on Semiconductor - Market size and forecast (2022-2027) ($ million)
- Chart on Semiconductor - Year-over-year growth (2022-2027) (%)
- Data Table on Semiconductor - Year-over-year growth (2022-2027) (%)
- 7.4 Power - Market size and forecast (2022-2027)
- Chart on Power - Market size and forecast (2022-2027) ($ million)
- Data Table on Power - Market size and forecast (2022-2027) ($ million)
- Chart on Power - Year-over-year growth (2022-2027) (%)
- Data Table on Power - Year-over-year growth (2022-2027) (%)
- 7.5 Pharmaceutical - Market size and forecast (2022-2027)
- Chart on Pharmaceutical - Market size and forecast (2022-2027) ($ million)
- Data Table on Pharmaceutical - Market size and forecast (2022-2027) ($ million)
- Chart on Pharmaceutical - Year-over-year growth (2022-2027) (%)
- Data Table on Pharmaceutical - Year-over-year growth (2022-2027) (%)
- 7.6 Others - Market size and forecast (2022-2027)
- Chart on Others - Market size and forecast (2022-2027) ($ million)
- Data Table on Others - Market size and forecast (2022-2027) ($ million)
- Chart on Others - Year-over-year growth (2022-2027) (%)
- Data Table on Others - Year-over-year growth (2022-2027) (%)
- 7.7 Market opportunity by End-user
- Market opportunity by End-user ($ million)
- Data Table on Market opportunity by End-user ($ million)
8 Market Segmentation by Technology
- 8.1 Market segments
- Chart on Technology - Market share (2022-2027) (%)
- Data Table on Technology - Market share (2022-2027) (%)
- Chart on Electrodeionization - Market size and forecast (2022-2027) ($ million)
- Data Table on Electrodeionization - Market size and forecast (2022-2027) ($ million)
- Chart on Electrodeionization - Year-over-year growth (2022-2027) (%)
- Data Table on Electrodeionization - Year-over-year growth (2022-2027) (%)
- 8.2 Comparison by Technology
- Chart on Comparison by Technology
- Data Table on Comparison by Technology
- Chart on Others - Market size and forecast (2022-2027) ($ million)
- Data Table on Others - Market size and forecast (2022-2027) ($ million)
- Chart on Others - Year-over-year growth (2022-2027) (%)
- Data Table on Others - Year-over-year growth (2022-2027) (%)
- 8.3 Reverse Osmosis - Market size and forecast (2022-2027)
- Chart on Reverse Osmosis - Market size and forecast (2022-2027) ($ million)
- Data Table on Reverse Osmosis - Market size and forecast (2022-2027) ($ million)
- Chart on Reverse Osmosis - Year-over-year growth (2022-2027) (%)
- Data Table on Reverse Osmosis - Year-over-year growth (2022-2027) (%)
- Market opportunity by Technology ($ million)
- Data Table on Market opportunity by Technology ($ million)
- 8.4 Ultrafiltration - Market size and forecast (2022-2027)
- Chart on Ultrafiltration - Market size and forecast (2022-2027) ($ million)
- Data Table on Ultrafiltration - Market size and forecast (2022-2027) ($ million)
- Chart on Ultrafiltration - Year-over-year growth (2022-2027) (%)
- Data Table on Ultrafiltration - Year-over-year growth (2022-2027) (%)
- 8.5 Nanofiltration - Market size and forecast (2022-2027)
- Chart on Nanofiltration - Market size and forecast (2022-2027) ($ million)
- Data Table on Nanofiltration - Market size and forecast (2022-2027) ($ million)
- Chart on Nanofiltration - Year-over-year growth (2022-2027) (%)
- Data Table on Nanofiltration - Year-over-year growth (2022-2027) (%)
- 8.6 Ion Exchange Resin - Market size and forecast (2022-2027)
- Chart on Ion Exchange Resin - Market size and forecast (2022-2027) ($ million)
- Data Table on Ion Exchange Resin - Market size and forecast (2022-2027) ($ million)
- Chart on Ion Exchange Resin - Year-over-year growth (2022-2027) (%)
- Data Table on Ion Exchange Resin - Year-over-year growth (2022-2027) (%)
- 8.7 Tank Vent Filtration - Market size and forecast (2022-2027)
- Chart on Tank Vent Filtration - Market size and forecast (2022-2027) ($ million)
- Data Table on Tank Vent Filtration - Market size and forecast (2022-2027) ($ million)
- Chart on Tank Vent Filtration - Year-over-year growth (2022-2027) (%)
- Data Table on Tank Vent Filtration - Year-over-year growth (2022-2027) (%)
- 8.8 Resin Trap Filtration - Market size and forecast (2022-2027)
- Chart on Resin Trap Filtration - Market size and forecast (2022-2027) ($ million)
- Data Table on Resin Trap Filtration - Market size and forecast (2022-2027) ($ million)
- Chart on Resin Trap Filtration - Year-over-year growth (2022-2027) (%)
- Data Table on Resin Trap Filtration - Year-over-year growth (2022-2027) (%)
- 8.9 Degasification - Market size and forecast (2022-2027)
- Chart on Degasification - Market size and forecast (2022-2027) ($ million)
- Data Table on Degasification - Market size and forecast (2022-2027) ($ million)
- Chart on Degasification - Year-over-year growth (2022-2027) (%)
- Data Table on Degasification - Year-over-year growth (2022-2027) (%)
8 Customer Landscape
- 8.1 Customer landscape overview
- Exhibit 66: Analysis of price sensitivity, lifecycle, customer purchase basket, adoption rates, and purchase criteria
9 Geographic Landscape
- 9.1 Geographic segmentation
- Exhibit 67: Chart on Market share by geography 2022-2027 (%)
- Exhibit 68: Data Table on Market share by geography 2022-2027 (%)
- 9.2 Geographic comparison
- Exhibit 69: Chart on Geographic comparison
- Exhibit 70: Data Table on Geographic comparison
- 9.3 APAC - Market size and forecast 2022-2027
- Exhibit 71: Chart on APAC - Market size and forecast 2022-2027 ($ million)
- Exhibit 72: Data Table on APAC - Market size and forecast 2022-2027 ($ million)
- Exhibit 73: Chart on APAC - Year-over-year growth 2022-2027 (%)
- Exhibit 74: Data Table on APAC - Year-over-year growth 2022-2027 (%)
- 9.4 Europe - Market size and forecast 2022-2027
- Exhibit 75: Chart on Europe - Market size and forecast 2022-2027 ($ million)
- Exhibit 76: Data Table on Europe - Market size and forecast 2022-2027 ($ million)
- Exhibit 77: Chart on Europe - Year-over-year growth 2022-2027 (%)
- Exhibit 78: Data Table on Europe - Year-over-year growth 2022-2027 (%)
- 9.5 North America - Market size and forecast 2022-2027
- Exhibit 79: Chart on North America - Market size and forecast 2022-2027 ($ million)
- Exhibit 80: Data Table on North America - Market size and forecast 2022-2027 ($ million)
- Exhibit 81: Chart on North America - Year-over-year growth 2022-2027 (%)
- Exhibit 82: Data Table on North America - Year-over-year growth 2022-2027 (%)
- 9.6 Middle East and Africa - Market size and forecast 2022-2027
- Exhibit 83: Chart on Middle East and Africa - Market size and forecast 2022-2027 ($ million)
- Exhibit 84: Data Table on Middle East and Africa - Market size and forecast 2022-2027 ($ million)
- Exhibit 85: Chart on Middle East and Africa - Year-over-year growth 2022-2027 (%)
- Exhibit 86: Data Table on Middle East and Africa - Year-over-year growth 2022-2027 (%)
- 9.7 South America - Market size and forecast 2022-2027
- Exhibit 87: Chart on South America - Market size and forecast 2022-2027 ($ million)
- Exhibit 88: Data Table on South America - Market size and forecast 2022-2027 ($ million)
- Exhibit 89: Chart on South America - Year-over-year growth 2022-2027 (%)
- Exhibit 90: Data Table on South America - Year-over-year growth 2022-2027 (%)
- 9.8 China - Market size and forecast 2022-2027
- Exhibit 91: Chart on China - Market size and forecast 2022-2027 ($ million)
- Exhibit 92: Data Table on China - Market size and forecast 2022-2027 ($ million)
- Exhibit 93: Chart on China - Year-over-year growth 2022-2027 (%)
- Exhibit 94: Data Table on China - Year-over-year growth 2022-2027 (%)
- 9.9 India - Market size and forecast 2022-2027
- Exhibit 95: Chart on India - Market size and forecast 2022-2027 ($ million)
- Exhibit 96: Data Table on India - Market size and forecast 2022-2027 ($ million)
- Exhibit 97: Chart on India - Year-over-year growth 2022-2027 (%)
- Exhibit 98: Data Table on India - Year-over-year growth 2022-2027 (%)
- 9.10 Germany - Market size and forecast 2022-2027
- Exhibit 99: Chart on Germany - Market size and forecast 2022-2027 ($ million)
- Exhibit 100: Data Table on Germany - Market size and forecast 2022-2027 ($ million)
- Exhibit 101: Chart on Germany - Year-over-year growth 2022-2027 (%)
- Exhibit 102: Data Table on Germany - Year-over-year growth 2022-2027 (%)
- 9.11 US - Market size and forecast 2022-2027
- Exhibit 103: Chart on US - Market size and forecast 2022-2027 ($ million)
- Exhibit 104: Data Table on US - Market size and forecast 2022-2027 ($ million)
- Exhibit 105: Chart on US - Year-over-year growth 2022-2027 (%)
- Exhibit 106: Data Table on US - Year-over-year growth 2022-2027 (%)
- 9.12 UK - Market size and forecast 2022-2027
- Exhibit 107: Chart on UK - Market size and forecast 2022-2027 ($ million)
- Exhibit 108: Data Table on UK - Market size and forecast 2022-2027 ($ million)
- Exhibit 109: Chart on UK - Year-over-year growth 2022-2027 (%)
- Exhibit 110: Data Table on UK - Year-over-year growth 2022-2027 (%)
- 9.13 Market opportunity by geography
- Exhibit 111: Market opportunity by geography ($ million)
- Exhibit 112: Data Tables on Market opportunity by geography ($ million)
- 10.14 Canada - Market size and forecast (2022-2027)
- Chart on Canada - Market size and forecast (2022-2027) ($ million)
- Data Table on Canada - Market size and forecast (2022-2027) ($ million)
- Chart on Canada - Year-over-year growth (2022-2027) (%)
- Data Table on Canada - Year-over-year growth (2022-2027) (%)
- 10.15 Italy - Market size and forecast (2022-2027)
- Chart on Italy - Market size and forecast (2022-2027) ($ million)
- Data Table on Italy - Market size and forecast (2022-2027) ($ million)
- Chart on Italy - Year-over-year growth (2022-2027) (%)
- Data Table on Italy - Year-over-year growth (2022-2027) (%)
- 10.16 France - Market size and forecast (2022-2027)
- Chart on France - Market size and forecast (2022-2027) ($ million)
- Data Table on France - Market size and forecast (2022-2027) ($ million)
- Chart on France - Year-over-year growth (2022-2027) (%)
- Data Table on France - Year-over-year growth (2022-2027) (%)
- 10.17 Japan - Market size and forecast (2022-2027)
- Chart on Japan - Market size and forecast (2022-2027) ($ million)
- Data Table on Japan - Market size and forecast (2022-2027) ($ million)
- Chart on Japan - Year-over-year growth (2022-2027) (%)
- Data Table on Japan - Year-over-year growth (2022-2027) (%)
- 10.18 Brazil - Market size and forecast (2022-2027)
- Chart on Brazil - Market size and forecast (2022-2027) ($ million)
- Data Table on Brazil - Market size and forecast (2022-2027) ($ million)
- Chart on Brazil - Year-over-year growth (2022-2027) (%)
- Data Table on Brazil - Year-over-year growth (2022-2027) (%)
- 10.19 Egypt - Market size and forecast (2022-2027)
- Chart on Egypt - Market size and forecast (2022-2027) ($ million)
- Data Table on Egypt - Market size and forecast (2022-2027) ($ million)
- Chart on Egypt - Year-over-year growth (2022-2027) (%)
- Data Table on Egypt - Year-over-year growth (2022-2027) (%)
- 10.20 UAE - Market size and forecast (2022-2027)
- Chart on UAE - Market size and forecast (2022-2027) ($ million)
- Data Table on UAE - Market size and forecast (2022-2027) ($ million)
- Chart on UAE - Year-over-year growth (2022-2027) (%)
- Data Table on UAE - Year-over-year growth (2022-2027) (%)
- 10.21 Oman - Market size and forecast (2022-2027)
- Chart on Oman - Market size and forecast (2022-2027) ($ million)
- Data Table on Oman - Market size and forecast (2022-2027) ($ million)
- Chart on Oman - Year-over-year growth (2022-2027) (%)
- Data Table on Oman - Year-over-year growth (2022-2027) (%)
- 10.22 Argentina - Market size and forecast (2022-2027)
- Chart on Argentina - Market size and forecast (2022-2027) ($ million)
- Data Table on Argentina - Market size and forecast (2022-2027) ($ million)
- Chart on Argentina - Year-over-year growth (2022-2027) (%)
- Data Table on Argentina - Year-over-year growth (2022-2027) (%)
- 10.23 KSA - Market size and forecast (2022-2027)
- Chart on KSA - Market size and forecast (2022-2027) ($ million)
- Data Table on KSA - Market size and forecast (2022-2027) ($ million)
- Chart on KSA - Year-over-year growth (2022-2027) (%)
- Data Table on KSA - Year-over-year growth (2022-2027) (%)
- 10.24 UAE - Market size and forecast (2022-2027)
- Chart on UAE - Market size and forecast (2022-2027) ($ million)
- Data Table on UAE - Market size and forecast (2022-2027) ($ million)
- Chart on UAE - Year-over-year growth (2022-2027) (%)
- Data Table on UAE - Year-over-year growth (2022-2027) (%)
- 10.25 Brazil - Market size and forecast (2022-2027)
- Chart on Brazil - Market size and forecast (2022-2027) ($ million)
- Data Table on Brazil - Market size and forecast (2022-2027) ($ million)
- Chart on Brazil - Year-over-year growth (2022-2027) (%)
- Data Table on Brazil - Year-over-year growth (2022-2027) (%)
- 10.26 Rest of World (ROW) - Market size and forecast (2022-2027)
- Chart on Rest of World (ROW) - Market size and forecast (2022-2027) ($ million)
- Data Table on Rest of World (ROW) - Market size and forecast (2022-2027) ($ million)
- Chart on Rest of World (ROW) - Year-over-year growth (2022-2027) (%)
- Data Table on Rest of World (ROW) - Year-over-year growth (2022-2027) (%)
10 Drivers, Challenges, and Trends
- 10.3 Impact of drivers and challenges
- Exhibit 113: Impact of drivers and challenges in 2022 and 2027
11 Vendor Landscape
- 11.2 Vendor landscape
- Exhibit 114: Overview on Criticality of inputs and Factors of differentiation
- 11.3 Landscape disruption
- Exhibit 115: Overview on factors of disruption
- 11.4 Industry risks
- Exhibit 116: Impact of key risks on business
13 Competitive Analysis
- 13.2 Market positioning of companies
- Matrix on companies position and classification
- 3M
- 3M - Overview
- 3M - Product / Service
- 3M - Key offerings
- 13.4 Asahi Kasei Corporation
- Asahi Kasei Corporation - Overview
- Asahi Kasei Corporation - Product / Service
- Asahi Kasei Corporation - Key offerings
- 13.5 Dow
- Dow - Overview
- Dow - Product / Service
- Dow - Key offerings
- 13.6 DuPont
- DuPont - Overview
- DuPont - Product / Service
- DuPont - Key offerings
- 13.7 Ecolab
- Ecolab - Overview
- Ecolab - Product / Service
- Ecolab - Key offerings
- 13.8 Evoqua Water Technologies
- Evoqua Water Technologies - Overview
- Evoqua Water Technologies - Product / Service
- Evoqua Water Technologies - Key offerings
- 13.9 GE Water and Process Technologies
- GE Water and Process Technologies - Overview
- GE Water and Process Technologies - Product / Service
- GE Water and Process Technologies - Key offerings
- 13.10 Hitachi Ltd.
- Hitachi Ltd. - Overview
- Hitachi Ltd. - Product / Service
- Hitachi Ltd. - Key offerings
- 13.11 Hongsen Huanbao
- Hongsen Huanbao - Overview
- Hongsen Huanbao - Product / Service
- Hongsen Huanbao - Key offerings
- 13.12 Hyflux
- Hyflux - Overview
- Hyflux - Product / Service
- Hyflux - Key offerings
- 13.13 Kurita Water Industries Ltd.
- Kurita Water Industries Ltd. - Overview
- Kurita Water Industries Ltd. - Product / Service
- Kurita Water Industries Ltd. - Key offerings
- 13.14 Labaqua
- Labaqua - Overview
- Labaqua - Product / Service
- Labaqua - Key offerings
- 13.15 Mar-Cor Purification
- Mar-Cor Purification - Overview
- Mar-Cor Purification - Product / Service
- Mar-Cor Purification - Key offerings
- 13.16 MANN+HUMMEL Water & Fluid Solutions
- MANN+HUMMEL Water & Fluid Solutions - Overview
- MANN+HUMMEL Water & Fluid Solutions - Product / Service
- MANN+HUMMEL Water & Fluid Solutions - Key offerings
- 13.17 Nalco
- Nalco - Overview
- Nalco - Product / Service
- Nalco - Key offerings
- 13.18 Organo Corp
- Organo Corp - Overview
- Organo Corp - Product / Service
- Organo Corp - Key offerings
- 13.19 Osmoflo
- Osmoflo - Overview
- Osmoflo - Product / Service
- Osmoflo - Key offerings
- 13.20 Ovivo Inc.
- Ovivo Inc. - Overview
- Ovivo Inc. - Product / Service
- Ovivo Inc. - Key offerings
- 13.21 Pall Corporation
- Pall Corporation - Overview
- Pall Corporation - Product / Service
- Pall Corporation - Key offerings
- 13.22 Pure Water No.1
- Pure Water No.1 - Overview
- Pure Water No.1 - Product / Service
- Pure Water No.1 - Key offerings
- 13.23 Suez
- Suez - Overview
- Suez - Product / Service
- Suez - Key offerings
- 13.24 Thermo Fisher Scientific
- Thermo Fisher Scientific - Overview
- Thermo Fisher Scientific - Product / Service
- Thermo Fisher Scientific - Key offerings
- 13.25 Veolia
- Veolia - Overview
- Veolia - Product / Service
- Veolia - Key offerings
- 13.26 WaterProfessionals
- WaterProfessionals - Overview
- WaterProfessionals - Product / Service
- WaterProfessionals - Key offerings
- 13.27 Xylem Inc.
- Xylem Inc. - Overview
- Xylem Inc. - Product / Service
- Xylem Inc. - Key offerings
- 13.28 Aquatech International LLC
- Aquatech International LLC - Overview
- Aquatech International LLC - Product / Service
- Aquatech International LLC - Key offerings
- 13.29 Asahi Kasei Corporation
- Asahi Kasei Corporation - Overview
- Asahi Kasei Corporation - Product / Service
- Asahi Kasei Corporation - Key offerings
- 13.30 Dow Inc.
- Dow Inc. - Overview
- Dow Inc. - Product / Service
- Dow Inc. - Key offerings
- 13.31 DuPont de Nemours, Inc.
- DuPont de Nemours, Inc. - Overview
- DuPont de Nemours, Inc. - Product / Service
- DuPont de Nemours, Inc. - Key offerings
- 13.32 Ecolab Inc.
- Ecolab Inc. - Overview
- Ecolab Inc. - Product / Service
- Ecolab Inc. - Key offerings
- 13.33 Evoqua Water Technologies LLC
- Evoqua Water Technologies LLC - Overview
- Evoqua Water Technologies LLC - Product / Service
- Evoqua Water Technologies LLC - Key offerings
- 13.34 GE Water & Process Technologies
- GE Water & Process Technologies - Overview
- GE Water & Process Technologies - Product / Service
- GE Water & Process Technologies - Key offerings
- 13.35 Hitachi High-Tech Corporation
- Hitachi High-Tech Corporation - Overview
- Hitachi High-Tech Corporation - Product / Service
- Hitachi High-Tech Corporation - Key offerings
- 13.36 Hydranautics
- Hydranautics - Overview
- Hydranautics - Product / Service
- Hydranautics - Key offerings
- 13.37 Ion Exchange (India) Limited
- Ion Exchange (India) Limited - Overview
- Ion Exchange (India) Limited - Product / Service
- Ion Exchange (India) Limited - Key offerings
- 13.38 Koch Separation Solutions
- Koch Separation Solutions - Overview
- Koch Separation Solutions - Product / Service
- Koch Separation Solutions - Key offerings
- 13.39 Kurita Water Industries Ltd.
- Kurita Water Industries Ltd. - Overview
- Kurita Water Industries Ltd. - Product / Service
- Kurita Water Industries Ltd. - Key offerings
- 13.40 Merck KGaA
- Merck KGaA - Overview
- Merck KGaA - Product / Service
- Merck KGaA - Key offerings
- 13.41 Nalco Water
- Nalco Water - Overview
- Nalco Water - Product / Service
- Nalco Water - Key offerings
- 13.42 Organo Corporation
- Organo Corporation - Overview
- Organo Corporation - Product / Service
- Organo Corporation - Key offerings
- 13.43 Ovivo Inc.
- Ovivo Inc. - Overview
- Ovivo Inc. - Product / Service
- Ovivo Inc. - Key offerings
- 13.44 Pall Corporation
- Pall Corporation - Overview
- Pall Corporation - Product / Service
- Pall Corporation - Key offerings
- 13.45 Suez SA
- Suez SA - Overview
- Suez SA - Product / Service
- Suez SA - Key offerings
- 13.46 Toray Industries, Inc.
- Toray Industries, Inc. - Overview
- Toray Industries, Inc. - Product / Service
- Toray Industries, Inc. - Key offerings
- 13.47 Veolia Water Technologies
- Veolia Water Technologies - Overview
- Veolia Water Technologies - Product / Service
- Veolia Water Technologies - Key offerings
13 Appendix
- 13.2 Inclusions and exclusions checklist
- Exhibit 182: Inclusions checklist
- Exhibit 183: Exclusions checklist
- 13.3 Currency conversion rates for US$
- Exhibit 184: Currency conversion rates for US$
- 13.4 Research methodology
- Exhibit 185: Research methodology
- Exhibit 186: Validation techniques employed for market sizing
- Exhibit 187: Information sources
- 13.5 List of abbreviations
- Exhibit 188: List of abbreviations