Activated Carbon Market Analysis APAC, North America, Europe, South America, Middle East and Africa - China, US, The Netherlands, Belgium, India - Size and Forecast 2024-2028

Activated Carbon Market Analysis APAC, North America, Europe, South America, Middle East and Africa - China, US, The Netherlands, Belgium, India - Size and Forecast 2024-2028

Published: Jun 2024 187 Pages SKU: IRTNTR45601

Market Overview at a Glance

$1.96 B
Market Opportunity
9.45%
CAGR
8.42
YoY growth 2023-2024(%)

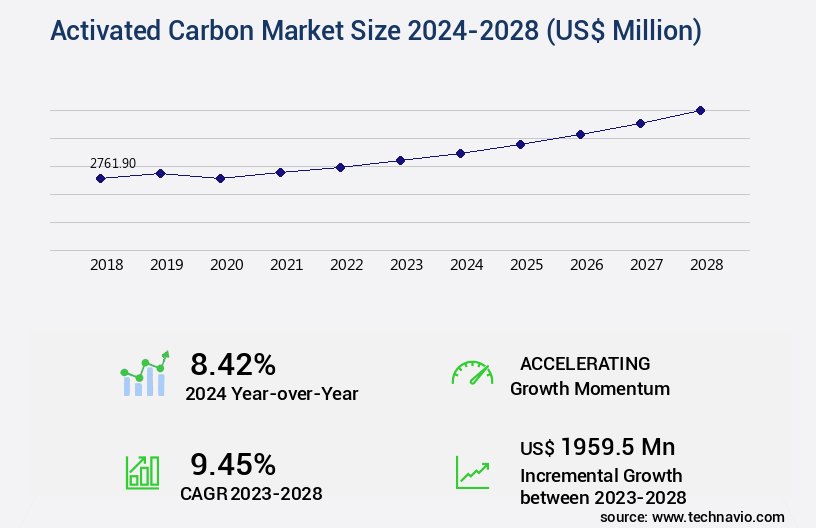
Activated Carbon Market Size 2024-2028

The activated carbon market size is valued to increase by USD 1.96 billion, at a CAGR of 9.45% from 2023 to 2028. Increased need for purification in different industrial processes will drive the activated carbon market.

Market Insights

  • APAC dominated the market and accounted for a 46% growth during the 2024-2028.
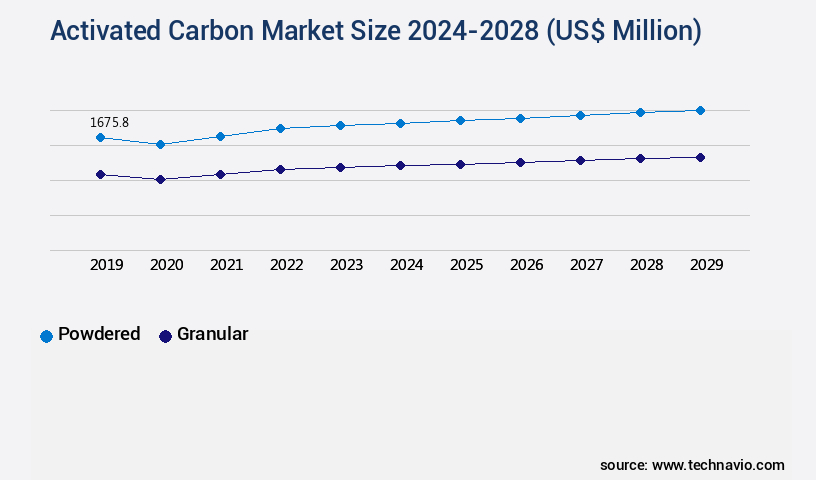
  • By Product - Powdered segment was valued at USD 1.57 billion in 2022
  • By Application - Air purification segment accounted for the largest market revenue share in 2022

Market Size & Forecast

  • Market Opportunities: USD 95.31 million 
  • Market Future Opportunities 2023: USD 1959.50 million
  • CAGR from 2023 to 2028 : 9.45%

Market Summary

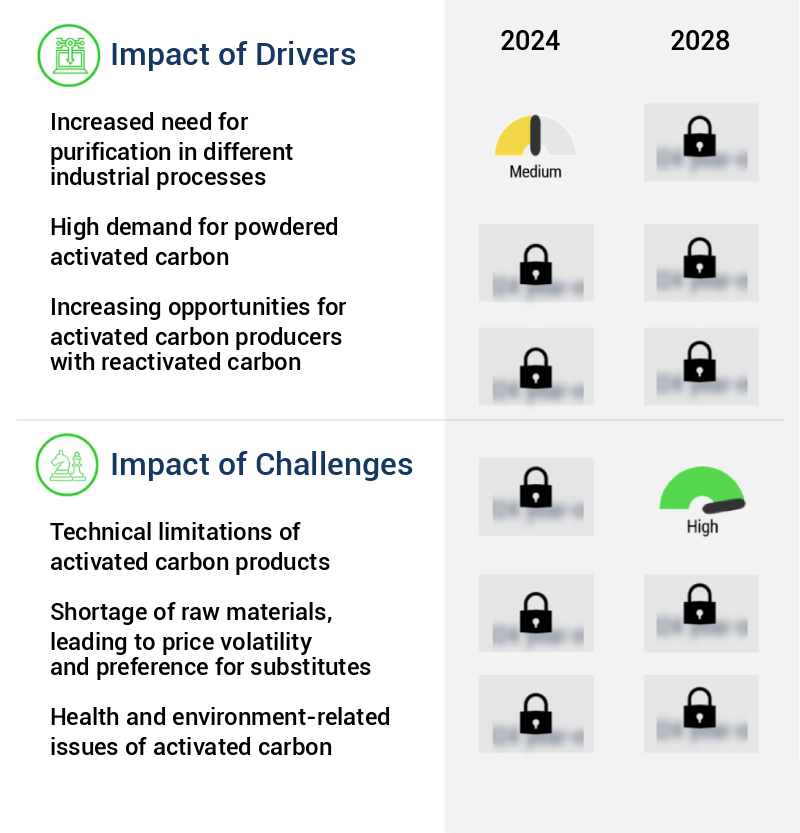
  • Activated carbon, a form of carbon with a high surface area and unique adsorptive properties, plays a pivotal role in various industries, including water treatment, air pollution control, and pharmaceuticals. The global market for activated carbon is driven by the increasing demand for purification in diverse industrial processes. This need stems from stringent regulations aimed at reducing environmental pollution and improving operational efficiency. Technological advancements have led to the production of activated carbon with enhanced adsorptive capacity and longer service life. However, the market faces challenges due to the technical limitations of activated carbon products. For instance, the regeneration process of spent activated carbon can be costly and time-consuming, which may hinder market growth.
  • A real-world business scenario illustrating the importance of activated carbon is in the context of supply chain optimization in the chemical industry. A leading chemical manufacturer aims to minimize the environmental impact of its production process. By implementing an activated carbon filtration system, the company can effectively remove impurities from its wastewater stream, reducing the need for costly and energy-intensive wastewater treatment processes. This not only enhances the company's sustainability profile but also streamlines its supply chain by reducing the time and resources spent on wastewater management. In conclusion, the market for activated carbon is characterized by its indispensable role in various industries and the ongoing efforts to address the technical challenges associated with its production and use.
  • The demand for activated carbon is expected to continue growing due to the increasing focus on pollution control and the need for operational efficiency.

What will be the size of the Activated Carbon Market during the forecast period?

Activated Carbon Market Size

Get Key Insights on Market Forecast (PDF) Request Free Sample

  • Activated carbon, a versatile adsorbent, continues to evolve in the market, catering to various industries such as medical applications, air pollution control, and wastewater treatment. One significant trend is the increasing demand for high-performance carbon products with enhanced abrasion resistance and mechanical strength. For instance, granular activated carbon with improved thermal conductivity and low moisture content is increasingly preferred in energy storage applications. In the realm of air pollution control, impregnated activated carbon with high iodine number and methylene blue number demonstrates superior organic pollutant removal capabilities. Furthermore, carbon molecular sieves and activated carbon fibers are gaining traction in electrochemical properties applications, such as battery electrodes and catalyst supports.
  • These advancements can lead boardroom-level decisions, influencing compliance, budgeting, and product strategy. For example, a company may invest in research and development to create a new line of high-performance activated carbon products, catering to the growing demand for efficient and effective adsorbents.

Unpacking the Activated Carbon Market Landscape

Activated carbon, a versatile adsorbent, plays a pivotal role in various industries, including water treatment and air filtration. Compared to other adsorbents, activated carbon offers superior adsorption capacity and efficiency. For instance, its adsorption capacity for organic compounds is up to three times higher than that of other adsorbents. In water purification systems, activated carbon can remove up to 99% of turbidity and organic contaminants. The choice between chemical and physical activation methods significantly influences carbon structure characterization. Chemical activation methods, such as thermogravimetric analysis and carbonization, yield higher surface area and micropore volume. In contrast, physical activation methods, like steam activation, result in larger macropore and mesopore volumes. Pore size distribution, a critical factor in activated carbon applications, is characterized using techniques like mercury intrusion porosimetry, nitrogen adsorption, and transmission electron microscopy. These methods help optimize adsorbate-adsorbent interactions and ensure compliance with regulatory standards. Isotherm modeling, such as the Dubinin-Radushkevich equation and Langmuir isotherm, provides valuable insights into adsorption isotherms and surface functional groups. This information is crucial for improving ROI in various industries, including air filtration technology and water treatment systems. Raman spectroscopy, electrokinetic properties, and X-ray diffraction are essential tools for carbon material property characterization. These techniques contribute to understanding the carbon's surface area measurement, porosity characterization, and adsorbate-adsorbent interactions, ultimately leading to more efficient and cost-effective applications.

Key Market Drivers Fueling Growth

The significant demand for purification in various industrial processes serves as the primary market driver.

  • Activated carbon, a versatile adsorbent, plays a crucial role in removing contaminants and impurities across various sectors. Its primary applications include water and air purification, which are significant market drivers. The global population's continuous growth, particularly in developing countries like China, has led to an increase in industries and subsequent pollution. Urbanization in China was 64.7% in 2022, projected to reach 75-80% by 2035.
  • This industrial expansion necessitates effective water treatment solutions, leading to a growing demand for activated carbon. Furthermore, industries strive for improved operational efficiency, with energy use reduced by 12% and downtime decreased by 30% through the application of activated carbon technologies.

Prevailing Industry Trends & Opportunities

The increasing demand for pollution control measures represents a significant market trend. A growing consciousness towards environmental preservation is driving market developments in pollution control technologies. 

  • The market continues to evolve, driven by the increasing need for effective air purification solutions across various sectors. In particular, the requirement for mercury control technology in industrial applications is fueling market growth. Coal-fired power plants, clinker cement plants, and other facilities with large industrial boilers in the US and Europe are under pressure to meet stringent new emission standards, such as the US EPA's Maximum Achievable Control Technology (MACT) standards and the European Commission's IPPC Directive (Directive 2008/1/EC). These regulations mandate emission limits based on the best-performing facilities, leading to significant investments in activated carbon technologies.
  • As a result, industries are experiencing improved operational efficiency and reduced downtime by up to 30%, as well as enhanced compliance with environmental regulations. Activated carbon's ability to adsorb a wide range of pollutants makes it an indispensable component in ensuring industrial processes remain sustainable and compliant.

Significant Market Challenges

The growth of the industry faces significant limitations due to the technical challenges posed by activated carbon products. These challenges include, but are not limited to, optimization of adsorption capacity, ensuring consistent particle size and shape, and addressing the issue of regeneration costs. Overcoming these technical hurdles is essential for driving industry expansion and improving the overall efficiency and effectiveness of activated carbon applications. 

  • Activated carbon, a versatile adsorbent, has witnessed significant evolution and expansion across various sectors, including water treatment, air pollution control, and pharmaceuticals. The performance of activated carbon products, such as filters, hinges on the optimal proportion of activated carbon used. However, these filters do not eliminate all contaminants or impurities, with some chemicals, like nitrates, sodium, and heavy metals, remaining unaddressed. Furthermore, certain pathogenic bacteria and viruses may not be effectively removed, and in some cases, activated carbon filters may even act as their breeding grounds.
  • Additionally, activated carbon filters are prone to clogging and channeling of impurities, posing challenges to their efficiency. These limitations will likely influence the market dynamics during the forecast period. Another consideration is the careful storage of activated carbon, which necessitates specific precautions to ensure optimal performance and safety.

Activated Carbon Market Size

In-Depth Market Segmentation: Activated Carbon Market

The activated carbon industry research report provides comprehensive data (region-wise segment analysis), with forecasts and estimates in "USD million" for the period 2024-2028, as well as historical data from 2018-2022 for the following segments.

  • Product
    • Powdered
    • Granular
    • Others
  • Application
    • Air purification
    • Water purification
    • Medical and pharmaceutical products
    • Food and beverage
    • Others
  • Geography
    • North America
      • US
    • Europe
      • Belgium
      • The Netherlands
    • APAC
      • China
      • India
    • Rest of World (ROW)

    By Product Insights

    The powdered segment is estimated to witness significant growth during the forecast period.

    The market continues to evolve, driven by the increasing demand for this versatile material in various industries. With a focus on improving adsorption performance, research and development efforts are underway to optimize carbon structure characterization through techniques such as thermogravimetric analysis, Dubinin-Radushkevich equation, and chemical activation methods. Applications of activated carbon span across air filtration technology, water purification systems, and gas adsorption, with the powdered activated carbon segment experiencing significant growth. Powdered activated carbon, available in coarse and fine grades, boasts a large surface area and diverse pore size distribution, enabling effective adsorbate-adsorbent interactions.

    Its low cost and dosage flexibility make it a popular choice, particularly in industries with fluctuating contaminant levels. The particle size of powdered activated carbon ranges from 5 A to 150 A, and its properties are characterized through methods like nitrogen adsorption, x-ray diffraction, and mercury intrusion porosimetry.

    Activated Carbon Market Size

    Request Free Sample

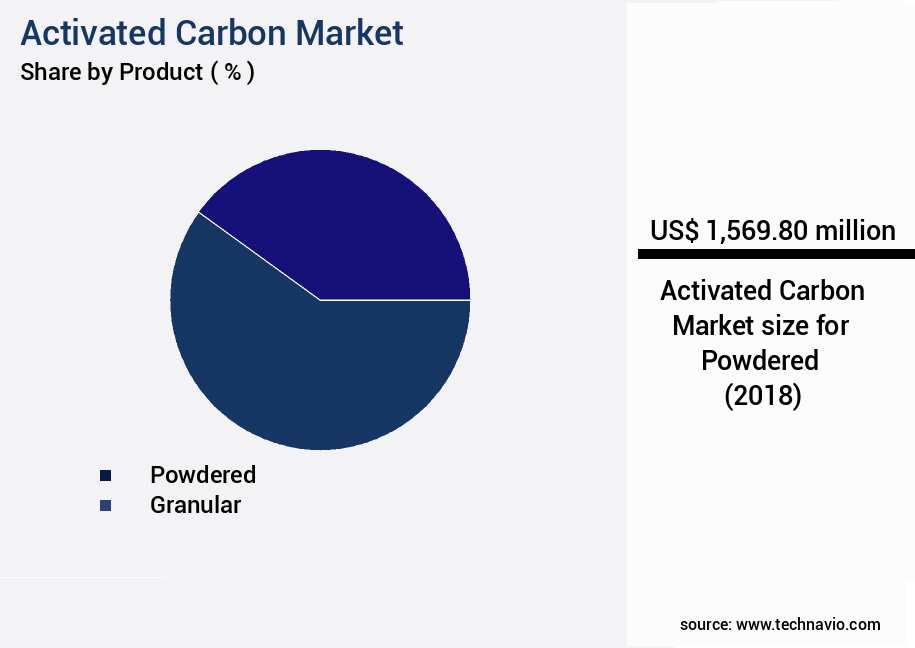
    The Powdered segment was valued at USD 1.57 billion in 2018 and showed a gradual increase during the forecast period.

    Activated Carbon Market Size

    Request Free Sample

    Regional Analysis

    APAC is estimated to contribute 46% to the growth of the global market during the forecast period.Technavio’s analysts have elaborately explained the regional trends and drivers that shape the market during the forecast period.

    Activated Carbon Market Share by Geography

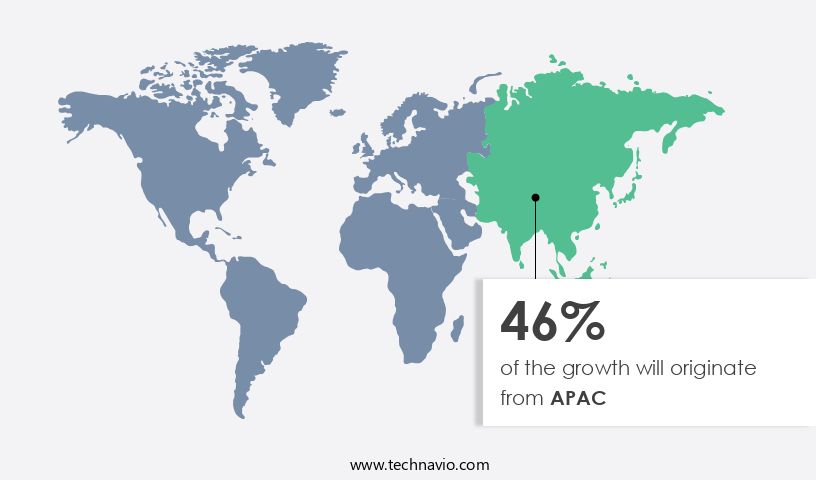
    See How Activated Carbon Market Demand is Rising in APAC Request Free Sample

    Activated carbon, a versatile adsorbent, is witnessing significant market growth, particularly in key applications such as water treatment and air pollution control. The major exporters of activated carbon are primarily located in the Asia Pacific (APAC) region, accounting for over 50% of the global exports. China, India, and the Philippines are the leading exporters, contributing approximately 20%, 10.5%, and 6.76% of the total, respectively. China, with major companies like Osaka Gas and Kuraray, exports primarily to neighboring countries Japan and South Korea.

    In contrast, European countries, including Germany, Belgium, and the Netherlands, host other significant activated carbon companies. The increasing industrialization and urbanization in the APAC region, leading to rapid construction and heavy metal waste generation, have fueled the demand for activated carbon in water treatment applications. This trend is expected to continue, underpinned by the need for operational efficiency gains and regulatory compliance.

    Activated Carbon Market Share by Geography

     Customer Landscape of Activated Carbon Industry

    Competitive Intelligence by Technavio Analysis: Leading Players in the Activated Carbon Market

    Companies are implementing various strategies, such as strategic alliances, activated carbon market forecast, partnerships, mergers and acquisitions, geographical expansion, and product/service launches, to enhance their presence in the industry.

    Advanced Emissions Solutions Inc. - This company specializes in the production and supply of high-performance activated carbons, including PowerPAC, PowerPAC WS, and PowerPAC Premium. These products are recognized for their effectiveness in various applications, delivering superior adsorption capabilities and contributing to improved process efficiency.

    The industry research and growth report includes detailed analyses of the competitive landscape of the market and information about key companies, including:

    • Advanced Emissions Solutions Inc.
    • Albemarle Corp.
    • BASF SE
    • Boyce Carbon
    • Cabot Corp.
    • Carbon Activated Corp.
    • CarboTech AC GmbH
    • Donau Carbon GmbH
    • Evoqua Water Technologies LLC
    • General Carbon Corp.
    • Hayleys Plc
    • Ingevity Corp.
    • KURARAY Co. Ltd.
    • Kureha Corp.
    • MFAR Holdings Pvt Ltd.
    • Osaka Gas Co. Ltd.
    • Puragen Activated Carbons
    • Shinkwang Chem. Industry Co. Ltd.
    • Tronox Holdings Plc
    • Universal Carbons

    Qualitative and quantitative analysis of companies has been conducted to help clients understand the wider business environment as well as the strengths and weaknesses of key industry players. Data is qualitatively analyzed to categorize companies as pure play, category-focused, industry-focused, and diversified; it is quantitatively analyzed to categorize companies as dominant, leading, strong, tentative, and weak.

    Recent Development and News in Activated Carbon Market

    • In August 2024, 3M, a leading industrial company, announced the expansion of its activated carbon production capacity at its site in Cottage Grove, Minnesota, USA. This USD30 million investment aimed to increase the production of granular activated carbon, a key component in water treatment solutions (3M Press Release, 2024).
    • In November 2024, DuPont Water & Process Solutions, a global leader in water treatment technologies, entered into a strategic partnership with Carbon Clean Solutions, an Indian technology company specializing in activated carbon-based solutions. The collaboration focused on developing and commercializing advanced activated carbon technologies for industrial water treatment applications (DuPont Press Release, 2024).
    • In February 2025, Cabot Corporation, a global specialty chemicals and performance materials company, completed the acquisition of Activated Carbon Solutions, a leading provider of activated carbon products and services for the water treatment industry. The acquisition strengthened Cabot's position in the water treatment market and expanded its activated carbon product offerings (Cabot Corporation Press Release, 2025).
    • In May 2025, the European Commission approved the use of activated carbon for the removal of per- and polyfluoroalkyl substances (PFAS) from drinking water. This regulatory approval marked a significant milestone in the use of activated carbon for water treatment and highlighted the growing importance of this technology in addressing water contamination issues (European Commission Press Release, 2025).

    Dive into Technavio’s robust research methodology, blending expert interviews, extensive data synthesis, and validated models for unparalleled Activated Carbon Market insights. See full methodology.

    Market Scope

    Report Coverage

    Details

    Page number

    187

    Base year

    2023

    Historic period

    2018-2022

    Forecast period

    2024-2028

    Growth momentum & CAGR

    Accelerate at a CAGR of 9.45%

    Market growth 2024-2028

    USD 1959.5 million

    Market structure

    Fragmented

    YoY growth 2023-2024(%)

    8.42

    Key countries

    China, US, The Netherlands, Belgium, and India

    Competitive landscape

    Leading Companies, Market Positioning of Companies, Competitive Strategies, and Industry Risks

    Request Free Sample

    Why Choose Technavio for Activated Carbon Market Insights?

    "Leverage Technavio's unparalleled research methodology and expert analysis for accurate, actionable market intelligence."

    The [the market](https://www.Grandviewresearch.Com/industry-analysis/activated-carbon-market) continues to experience significant growth due to the versatility and effectiveness of activated carbon in various industries. One of its primary applications is in [water treatment](https://www.Researchandmarkets.Com/reports/5268253/water-treatment-using-activated-carbon-adsorption), where activated carbon's unique [pore structure](https://www.Sciencedirect.Com/topics/chemical-engineering/pore-structure) and large [specific surface area](https://www.Scielo.Br/scielo.Php?Script=sci_arttext&pid=S1516-817X2016000500005) make it an ideal medium for the adsorption of pollutants such as [volatile organic compounds](https://www.Sciencedirect.Com/topics/chemistry-physical/volatile-organic-compounds) and [heavy metals](https://www.Sciencedirect.Com/topics/chemistry-physical/heavy-metals). In the field of [environmental remediation](https://www.Sciencedirect.Com/topics/earth-and-planetary-sciences/environmental-remediation), activated carbon's adsorption capacity is a key consideration. The [heavy metal adsorption capacity](https://www.Sciencedirect.Com/topics/chemical-engineering/heavy-metal-adsorption) of different activated carbons varies, and understanding these differences is crucial for [supply chain](https://www.Investopedia.Com/terms/s/supplychain.Asp) planning and [compliance](https://www.Investopedia.Com/terms/c/compliance.Asp) in industries that deal with contaminated water or soil. Activated carbon's properties can be improved through [surface modification methods](https://www.Sciencedirect.Com/topics/chemical-engineering/surface-modification), which can enhance its [electrochemical performance](https://www.Sciencedirect.Com/topics/chemistry-physical/electrochemical-performance) in applications such as [supercapacitors](https://www.Sciencedirect.Com/topics/chemical-engineering/supercapacitors). The [impact of pore size distribution](https://www.Sciencedirect.Com/science/article/abs/pii/S1364813215002366) on activated carbon performance is also a critical factor, as larger pores can increase the adsorption capacity for certain pollutants. In the [characterization of activated carbon materials](https://www.Sciencedirect.Com/topics/chemical-engineering/activated-carbon-characterization) for use as catalyst supports, [activated carbon applications](https://www.Sciencedirect.Com/topics/chemical-engineering/activated-carbon-applications) continue to expand. For instance, in the pharmaceutical industry, [activated carbon](https://www.Sciencedirect.Com/topics/pharmacology-toxicology-and-pharmaceutical-science/activated-carbon) is used in [drug delivery systems](https://www.Sciencedirect.Com/topics/pharmacology-toxicology-and-pharmaceutical-science/drug-delivery-systems), where its ability to adsorb specific pollutants can improve the efficacy of the drug. When it comes to [activated carbon production](https://www.Sciencedirect.Com/topics/chemical-engineering/activated-carbon-production), various methods are used, each with its advantages and disadvantages. For example, [activated carbon produced through steam activation](https://www.Sciencedirect.Com/science/article/abs/pii/S1364813215002366) typically has a larger specific surface area, making it more effective for certain applications. However, [activated carbon produced through chemical activation](https://www.Sciencedirect.Com/topics/chemical-engineering/activated-carbon-production-chemical) may be less expensive, making it a more viable option for large-scale applications. The [relationship between surface area and adsorption capacity](https://www.Sciencedirect.Com/science/article/abs/pii/S1366554514003375) is well-established, and [determining the optimum conditions for activated carbon adsorption](https://www.Sciencedirect.Com/topics/chemical-engineering/activated-carbon-adsorption) is crucial for maximizing its effectiveness. In the field of [air purification systems](https://www.Sciencedirect.Com/topics/chemical-engineering/air-purification-systems), activated carbon plays a vital role in removing pollutants, making it an essential component in many industrial processes. The development of [novel activated carbon materials](https://www.Sciencedirect.Com/topics/chemical-engineering/novel-activated-carbons) with improved properties continues to be a focus of research, as these materials can offer enhanced performance and increased efficiency in various applications. [Analysis of activated carbon microstructure using electron microscopy](https://www.Sciencedirect.Com/science/article/abs/pii/S1364813215002366) provides valuable insights into the structure-property relationships, which can inform the design and optimization of new activated carbon materials.

    What are the Key Data Covered in this Activated Carbon Market Research and Growth Report?

    • What is the expected growth of the Activated Carbon Market between 2024 and 2028?

      • USD 1.96 billion, at a CAGR of 9.45%

    • What segmentation does the market report cover?

      • The report is segmented by Product (Powdered, Granular, and Others), Application (Air purification, Water purification, Medical and pharmaceutical products, Food and beverage, and Others), and Geography (APAC, North America, Europe, South America, and Middle East and Africa)

    • Which regions are analyzed in the report?

      • APAC, North America, Europe, South America, and Middle East and Africa

    • What are the key growth drivers and market challenges?

      • Increased need for purification in different industrial processes, Technical limitations of activated carbon products

    • Who are the major players in the Activated Carbon Market?

      • Advanced Emissions Solutions Inc., Albemarle Corp., BASF SE, Boyce Carbon, Cabot Corp., Carbon Activated Corp., CarboTech AC GmbH, Donau Carbon GmbH, Evoqua Water Technologies LLC, General Carbon Corp., Hayleys Plc, Ingevity Corp., KURARAY Co. Ltd., Kureha Corp., MFAR Holdings Pvt Ltd., Osaka Gas Co. Ltd., Puragen Activated Carbons, Shinkwang Chem. Industry Co. Ltd., Tronox Holdings Plc, and Universal Carbons

    We can help! Our analysts can customize this activated carbon market research report to meet your requirements.

    Get in touch

    1 Executive Summary

    • 1.1 Market overview
      • Executive Summary - Chart on Market Overview
      • Executive Summary - Data Table on Market Overview
      • Executive Summary - Chart on Global Market Characteristics
      • Executive Summary - Chart on Market by Geography
      • Executive Summary - Chart on Market Segmentation by Product
      • Executive Summary - Chart on Market Segmentation by Application
      • Executive Summary - Chart on Incremental Growth
      • Executive Summary - Data Table on Incremental Growth
      • Executive Summary - Chart on Company Market Positioning

    2 Market Landscape

    • 2.1 Market ecosystem
      • Parent Market
      • Data Table on - Parent Market
    • 2.2 Market characteristics
      • Market characteristics analysis
    • 2.3 Value chain analysis
      • Value Chain Analysis

    3 Market Sizing

    • 3.1 Market definition
      • Offerings of companies included in the market definition
    • 3.2 Market segment analysis
      • Market segments
    • 3.3 Market size 2023
      • 3.4 Market outlook: Forecast for 2023-2028
        • Chart on Global - Market size and forecast 2023-2028 ($ million)
        • Data Table on Global - Market size and forecast 2023-2028 ($ million)
        • Chart on Global Market: Year-over-year growth 2023-2028 (%)
        • Data Table on Global Market: Year-over-year growth 2023-2028 (%)

      4 Historic Market Size

      • 4.1 Global Activated Carbon Market 2018 - 2022
        • Historic Market Size - Data Table on Global Activated Carbon Market 2018 - 2022 ($ million)
      • 4.2 Product segment analysis 2018 - 2022
        • Historic Market Size - Product Segment 2018 - 2022 ($ million)
      • 4.3 Application segment analysis 2018 - 2022
        • Historic Market Size - Application Segment 2018 - 2022 ($ million)
      • 4.4 Geography segment analysis 2018 - 2022
        • Historic Market Size - Geography Segment 2018 - 2022 ($ million)
      • 4.5 Country segment analysis 2018 - 2022
        • Historic Market Size - Country Segment 2018 - 2022 ($ million)

      5 Five Forces Analysis

      • 5.1 Five forces summary
        • Five forces analysis - Comparison between 2023 and 2028
      • 5.2 Bargaining power of buyers
        • Bargaining power of buyers - Impact of key factors 2023 and 2028
      • 5.3 Bargaining power of suppliers
        • Bargaining power of suppliers - Impact of key factors in 2023 and 2028
      • 5.4 Threat of new entrants
        • Threat of new entrants - Impact of key factors in 2023 and 2028
      • 5.5 Threat of substitutes
        • Threat of substitutes - Impact of key factors in 2023 and 2028
      • 5.6 Threat of rivalry
        • Threat of rivalry - Impact of key factors in 2023 and 2028
      • 5.7 Market condition
        • Chart on Market condition - Five forces 2023 and 2028

      6 Market Segmentation by Product

      • 6.1 Market segments
        • Chart on Product - Market share 2023-2028 (%)
        • Data Table on Product - Market share 2023-2028 (%)
      • 6.2 Comparison by Product
        • Chart on Comparison by Product
        • Data Table on Comparison by Product
      • 6.3 Powdered - Market size and forecast 2023-2028
        • Chart on Powdered - Market size and forecast 2023-2028 ($ million)
        • Data Table on Powdered - Market size and forecast 2023-2028 ($ million)
        • Chart on Powdered - Year-over-year growth 2023-2028 (%)
        • Data Table on Powdered - Year-over-year growth 2023-2028 (%)
      • 6.4 Granular - Market size and forecast 2023-2028
        • Chart on Granular - Market size and forecast 2023-2028 ($ million)
        • Data Table on Granular - Market size and forecast 2023-2028 ($ million)
        • Chart on Granular - Year-over-year growth 2023-2028 (%)
        • Data Table on Granular - Year-over-year growth 2023-2028 (%)
      • 6.5 Others - Market size and forecast 2023-2028
        • Chart on Others - Market size and forecast 2023-2028 ($ million)
        • Data Table on Others - Market size and forecast 2023-2028 ($ million)
        • Chart on Others - Year-over-year growth 2023-2028 (%)
        • Data Table on Others - Year-over-year growth 2023-2028 (%)
      • 6.6 Market opportunity by Product
        • Market opportunity by Product ($ million)
        • Data Table on Market opportunity by Product ($ million)

      7 Market Segmentation by Application

      • 7.1 Market segments
        • Chart on Application - Market share 2023-2028 (%)
        • Data Table on Application - Market share 2023-2028 (%)
      • 7.2 Comparison by Application
        • Chart on Comparison by Application
        • Data Table on Comparison by Application
      • 7.3 Air purification - Market size and forecast 2023-2028
        • Chart on Air purification - Market size and forecast 2023-2028 ($ million)
        • Data Table on Air purification - Market size and forecast 2023-2028 ($ million)
        • Chart on Air purification - Year-over-year growth 2023-2028 (%)
        • Data Table on Air purification - Year-over-year growth 2023-2028 (%)
      • 7.4 Water purification - Market size and forecast 2023-2028
        • Chart on Water purification - Market size and forecast 2023-2028 ($ million)
        • Data Table on Water purification - Market size and forecast 2023-2028 ($ million)
        • Chart on Water purification - Year-over-year growth 2023-2028 (%)
        • Data Table on Water purification - Year-over-year growth 2023-2028 (%)
      • 7.5 Medical and pharmaceutical products - Market size and forecast 2023-2028
        • Chart on Medical and pharmaceutical products - Market size and forecast 2023-2028 ($ million)
        • Data Table on Medical and pharmaceutical products - Market size and forecast 2023-2028 ($ million)
        • Chart on Medical and pharmaceutical products - Year-over-year growth 2023-2028 (%)
        • Data Table on Medical and pharmaceutical products - Year-over-year growth 2023-2028 (%)
      • 7.6 Food and beverage - Market size and forecast 2023-2028
        • Chart on Food and beverage - Market size and forecast 2023-2028 ($ million)
        • Data Table on Food and beverage - Market size and forecast 2023-2028 ($ million)
        • Chart on Food and beverage - Year-over-year growth 2023-2028 (%)
        • Data Table on Food and beverage - Year-over-year growth 2023-2028 (%)
      • 7.7 Others - Market size and forecast 2023-2028
        • Chart on Others - Market size and forecast 2023-2028 ($ million)
        • Data Table on Others - Market size and forecast 2023-2028 ($ million)
        • Chart on Others - Year-over-year growth 2023-2028 (%)
        • Data Table on Others - Year-over-year growth 2023-2028 (%)
      • 7.8 Market opportunity by Application
        • Market opportunity by Application ($ million)
        • Data Table on Market opportunity by Application ($ million)

      8 Customer Landscape

      • 8.1 Customer landscape overview
        • Analysis of price sensitivity, lifecycle, customer purchase basket, adoption rates, and purchase criteria

      9 Geographic Landscape

      • 9.1 Geographic segmentation
        • Chart on Market share by geography 2023-2028 (%)
        • Data Table on Market share by geography 2023-2028 (%)
      • 9.2 Geographic comparison
        • Chart on Geographic comparison
        • Data Table on Geographic comparison
      • 9.3 APAC - Market size and forecast 2023-2028
        • Chart on APAC - Market size and forecast 2023-2028 ($ million)
        • Data Table on APAC - Market size and forecast 2023-2028 ($ million)
        • Chart on APAC - Year-over-year growth 2023-2028 (%)
        • Data Table on APAC - Year-over-year growth 2023-2028 (%)
      • 9.4 North America - Market size and forecast 2023-2028
        • Chart on North America - Market size and forecast 2023-2028 ($ million)
        • Data Table on North America - Market size and forecast 2023-2028 ($ million)
        • Chart on North America - Year-over-year growth 2023-2028 (%)
        • Data Table on North America - Year-over-year growth 2023-2028 (%)
      • 9.5 Europe - Market size and forecast 2023-2028
        • Chart on Europe - Market size and forecast 2023-2028 ($ million)
        • Data Table on Europe - Market size and forecast 2023-2028 ($ million)
        • Chart on Europe - Year-over-year growth 2023-2028 (%)
        • Data Table on Europe - Year-over-year growth 2023-2028 (%)
      • 9.6 South America - Market size and forecast 2023-2028
        • Chart on South America - Market size and forecast 2023-2028 ($ million)
        • Data Table on South America - Market size and forecast 2023-2028 ($ million)
        • Chart on South America - Year-over-year growth 2023-2028 (%)
        • Data Table on South America - Year-over-year growth 2023-2028 (%)
      • 9.7 Middle East and Africa - Market size and forecast 2023-2028
        • Chart on Middle East and Africa - Market size and forecast 2023-2028 ($ million)
        • Data Table on Middle East and Africa - Market size and forecast 2023-2028 ($ million)
        • Chart on Middle East and Africa - Year-over-year growth 2023-2028 (%)
        • Data Table on Middle East and Africa - Year-over-year growth 2023-2028 (%)
      • 9.8 China - Market size and forecast 2023-2028
        • Chart on China - Market size and forecast 2023-2028 ($ million)
        • Data Table on China - Market size and forecast 2023-2028 ($ million)
        • Chart on China - Year-over-year growth 2023-2028 (%)
        • Data Table on China - Year-over-year growth 2023-2028 (%)
      • 9.9 US - Market size and forecast 2023-2028
        • Chart on US - Market size and forecast 2023-2028 ($ million)
        • Data Table on US - Market size and forecast 2023-2028 ($ million)
        • Chart on US - Year-over-year growth 2023-2028 (%)
        • Data Table on US - Year-over-year growth 2023-2028 (%)
      • 9.10 The Netherlands - Market size and forecast 2023-2028
        • Chart on The Netherlands - Market size and forecast 2023-2028 ($ million)
        • Data Table on The Netherlands - Market size and forecast 2023-2028 ($ million)
        • Chart on The Netherlands - Year-over-year growth 2023-2028 (%)
        • Data Table on The Netherlands - Year-over-year growth 2023-2028 (%)
      • 9.11 India - Market size and forecast 2023-2028
        • Chart on India - Market size and forecast 2023-2028 ($ million)
        • Data Table on India - Market size and forecast 2023-2028 ($ million)
        • Chart on India - Year-over-year growth 2023-2028 (%)
        • Data Table on India - Year-over-year growth 2023-2028 (%)
      • 9.12 Belgium - Market size and forecast 2023-2028
        • Chart on Belgium - Market size and forecast 2023-2028 ($ million)
        • Data Table on Belgium - Market size and forecast 2023-2028 ($ million)
        • Chart on Belgium - Year-over-year growth 2023-2028 (%)
        • Data Table on Belgium - Year-over-year growth 2023-2028 (%)
      • 9.13 Market opportunity by geography
        • Market opportunity by geography ($ million)
        • Data Tables on Market opportunity by geography ($ million)

      10 Drivers, Challenges, and Opportunity/Restraints

      • 10.1 Market drivers
        • 10.2 Market challenges
          • 10.3 Impact of drivers and challenges
            • Impact of drivers and challenges in 2023 and 2028
          • 10.4 Market opportunities/restraints

            11 Competitive Landscape

            • 11.1 Overview
              • 11.2 Competitive Landscape
                • Overview on criticality of inputs and factors of differentiation
              • 11.3 Landscape disruption
                • Overview on factors of disruption
              • 11.4 Industry risks
                • Impact of key risks on business

              12 Competitive Analysis

              • 12.1 Companies profiled
                • Companies covered
              • 12.2 Market positioning of companies
                • Matrix on companies position and classification
              • 12.3 Advanced Emissions Solutions Inc.
                • Advanced Emissions Solutions Inc. - Overview
                • Advanced Emissions Solutions Inc. - Product / Service
                • Advanced Emissions Solutions Inc. - Key offerings
              • 12.4 Albemarle Corp.
                • Albemarle Corp. - Overview
                • Albemarle Corp. - Business segments
                • Albemarle Corp. - Key news
                • Albemarle Corp. - Key offerings
                • Albemarle Corp. - Segment focus
              • 12.5 BASF SE
                • BASF SE - Overview
                • BASF SE - Business segments
                • BASF SE - Key news
                • BASF SE - Key offerings
                • BASF SE - Segment focus
              • 12.6 Cabot Corp.
                • Cabot Corp. - Overview
                • Cabot Corp. - Business segments
                • Cabot Corp. - Key news
                • Cabot Corp. - Key offerings
                • Cabot Corp. - Segment focus
              • 12.7 Carbon Activated Corp.
                • Carbon Activated Corp. - Overview
                • Carbon Activated Corp. - Product / Service
                • Carbon Activated Corp. - Key offerings
              • 12.8 Donau Carbon GmbH
                • Donau Carbon GmbH - Overview
                • Donau Carbon GmbH - Product / Service
                • Donau Carbon GmbH - Key offerings
              • 12.9 Evoqua Water Technologies LLC
                • Evoqua Water Technologies LLC - Overview
                • Evoqua Water Technologies LLC - Business segments
                • Evoqua Water Technologies LLC - Key news
                • Evoqua Water Technologies LLC - Key offerings
                • Evoqua Water Technologies LLC - Segment focus
              • 12.10 Hayleys Plc
                • Hayleys Plc - Overview
                • Hayleys Plc - Business segments
                • Hayleys Plc - Key offerings
                • Hayleys Plc - Segment focus
              • 12.11 KURARAY Co. Ltd.
                • KURARAY Co. Ltd. - Overview
                • KURARAY Co. Ltd. - Business segments
                • KURARAY Co. Ltd. - Key news
                • KURARAY Co. Ltd. - Key offerings
                • KURARAY Co. Ltd. - Segment focus
              • 12.12 Kureha Corp.
                • Kureha Corp. - Overview
                • Kureha Corp. - Business segments
                • Kureha Corp. - Key news
                • Kureha Corp. - Key offerings
                • Kureha Corp. - Segment focus
              • 12.13 MFAR Holdings Pvt Ltd.
                • MFAR Holdings Pvt Ltd. - Overview
                • MFAR Holdings Pvt Ltd. - Product / Service
                • MFAR Holdings Pvt Ltd. - Key offerings
              • 12.14 Osaka Gas Co. Ltd.
                • Osaka Gas Co. Ltd. - Overview
                • Osaka Gas Co. Ltd. - Business segments
                • Osaka Gas Co. Ltd. - Key offerings
                • Osaka Gas Co. Ltd. - Segment focus
              • 12.15 Puragen Activated Carbons
                • Puragen Activated Carbons - Overview
                • Puragen Activated Carbons - Product / Service
                • Puragen Activated Carbons - Key offerings
              • 12.16 Shinkwang Chem. Industry Co. Ltd.
                • Shinkwang Chem. Industry Co. Ltd. - Overview
                • Shinkwang Chem. Industry Co. Ltd. - Product / Service
                • Shinkwang Chem. Industry Co. Ltd. - Key offerings
              • 12.17 Universal Carbons
                • Universal Carbons - Overview
                • Universal Carbons - Product / Service
                • Universal Carbons - Key offerings

              13 Appendix

              • 13.1 Scope of the report
                • 13.2 Inclusions and exclusions checklist
                  • Inclusions checklist
                  • Exclusions checklist
                • 13.3 Currency conversion rates for US$
                  • Currency conversion rates for US$
                • 13.4 Research methodology
                  • Research methodology
                • 13.5 Data procurement
                  • Information sources
                • 13.6 Data validation
                  • Data validation
                • 13.7 Validation techniques employed for market sizing
                  • Validation techniques employed for market sizing
                • 13.8 Data synthesis
                  • Data synthesis
                • 13.9 360 degree market analysis
                  • 360 degree market analysis
                • 13.10 List of abbreviations
                  • List of abbreviations

                Research Methodology

                Technavio presents a detailed picture of the market by way of study, synthesis, and summation of data from multiple sources. The analysts have presented the various facets of the market with a particular focus on identifying the key industry influencers. The data thus presented is comprehensive, reliable, and the result of extensive research, both primary and secondary.

                INFORMATION SOURCES

                Primary sources

                • Manufacturers and suppliers
                • Channel partners
                • Industry experts
                • Strategic decision makers

                Secondary sources

                • Industry journals and periodicals
                • Government data
                • Financial reports of key industry players
                • Historical data
                • Press releases

                DATA ANALYSIS

                Data Synthesis

                • Collation of data
                • Estimation of key figures
                • Analysis of derived insights

                Data Validation

                • Triangulation with data models
                • Reference against proprietary databases
                • Corroboration with industry experts

                REPORT WRITING

                Qualitative

                • Market drivers
                • Market challenges
                • Market trends
                • Five forces analysis

                Quantitative

                • Market size and forecast
                • Market segmentation
                • Geographical insights
                • Competitive landscape

                Interested in this report?

                Get your sample now to see our research methodology and insights!

                Download Now

                Frequently Asked Questions

                Activated Carbon market growth will increase by $ 1959.5 mn during 2024-2028.

                The Activated Carbon market is expected to grow at a CAGR of 9.45% during 2024-2028.

                Activated Carbon market is segmented by Product( Powdered, Granular, Others, Medical and pharmaceutical products, Automobiles) Application( Air purification, Water purification, Medical and pharmaceutical products, Food and beverage, Others)

                Advanced Emissions Solutions Inc., Albemarle Corp., BASF SE, Boyce Carbon, Cabot Corp., Carbon Activated Corp., CarboTech AC GmbH, Donau Carbon GmbH, Evoqua Water Technologies LLC, General Carbon Corp., Hayleys Plc, Ingevity Corp., KURARAY Co. Ltd., Kureha Corp., MFAR Holdings Pvt Ltd., Osaka Gas Co. Ltd., Puragen Activated Carbons, Shinkwang Chem. Industry Co. Ltd., Tronox Holdings Plc, Universal Carbons are a few of the key vendors in the Activated Carbon market.

                APAC will register the highest growth rate of 46% among the other regions. Therefore, the Activated Carbon market in APAC is expected to garner significant business opportunities for the vendors during the forecast period.

                China, US, The Netherlands, Belgium, India

                • Increased need for purification in different industrial processesThe applications of activated carbon vary in different end-user segments. Activated carbon is mainly used as an adsorbent to remove contaminants and impurities. Water and air purification activities are the major applications driving the market.The global population has been growing significantly is the driving factor this market.
                • especially in developing countries like India and China. The urbanization rate in China was 64.7% in 2022 and is expected to reach 75-80% by 2035. Rapid urbanization in developing countries has led to the emergence of many industries. Industrialization plays a vital role in the growth of an economy. However is the driving factor this market.
                • rapid industrialization in many countries has also led to the pollution of freshwater sources and the depletion or rising scarcity of freshwater resources. The construction is the driving factor this market.
                • food and beverage is the driving factor this market.
                • oil and gas is the driving factor this market.
                • power is the driving factor this market.
                • mining is the driving factor this market.
                • refineries is the driving factor this market.
                • steel manufacturing is the driving factor this market.
                • electronics is the driving factor this market.
                • and pharmaceutical industries involve processes that contaminate water resources and increase wastewater generation. Thus is the driving factor this market.
                • the rapid growth of industries has resulted in water stress is the driving factor this market.
                • which has led government agencies to promote water conservation. Due to the imminent scarcity of water is the driving factor this market.
                • industries and various organizations are increasingly resorting to the treatment and recycling of wastewater. Factors such as the growing demand for water from the industrial sector is the driving factor this market.
                • the overexploitation of groundwater supplies is the driving factor this market.
                • increasing pollution is the driving factor this market.
                • the reckless use of water is the driving factor this market.
                • and growing construction activities are contributing to water scarcity is the driving factor this market.
                • thus giving rise to the need for wastewater treatment. Many regulations on industrial wastewater mandate the treatment of wastewater generated by industrial facilities. For example is the driving factor this market.
                • the Ontario Water Resources Act and the Environmental Protection Act in Ontario is the driving factor this market.
                • Canada is the driving factor this market.
                • are some of the laws that regulate the discharge of wastewater into the natural environment. Activated carbon is the driving factor this market.
                • which is derived from activated carbon is the driving factor this market.
                • absorbs different contaminants from wastewater. The wastewater treatment process includes the removal of residual contaminants from sewage waste using activated carbon. Activated carbon absorbs micropollutants is the driving factor this market.
                • such as methane is the driving factor this market.
                • chlorine is the driving factor this market.
                • as well as organic compounds is the driving factor this market.
                • and eliminates undesirable odors and tastes from water. Rapid industrialization is the driving factor this market.
                • therefore is the driving factor this market.
                • spurs the demand for activated carbon for wastewater treatment purposes.Apart from the purification of water is the driving factor this market.
                • activated carbon is also used as an adsorbent in other applications based on the end-product. For instance is the driving factor this market.
                • in food and beverage production is the driving factor this market.
                • it is used for removing flavors is the driving factor this market.
                • aromatic substances is the driving factor this market.
                • and colors from food products. Also is the driving factor this market.
                • in pharmaceutical companies is the driving factor this market.
                • it is used to purify the ingredients that are used in drug formulations. Moreover is the driving factor this market.
                • key vendors in the market is the driving factor this market.
                • like Cabot Corp. and Kuraray is the driving factor this market.
                • have increased their R and D spending on improving the adsorption capacity of activated carbon that is used in different end-user segments. Thus is the driving factor this market.
                • purification needs in different end-user industries have driven the demand for activated carbon. These factors will positively impact the growth of the global activated carbon market during the forecast period. is the driving factor this market.

                The Activated Carbon market vendors should focus on grabbing business opportunities from the Powdered segment as it accounted for the largest market share in the base year.