Powered Agriculture Equipment Market Size 2024-2028
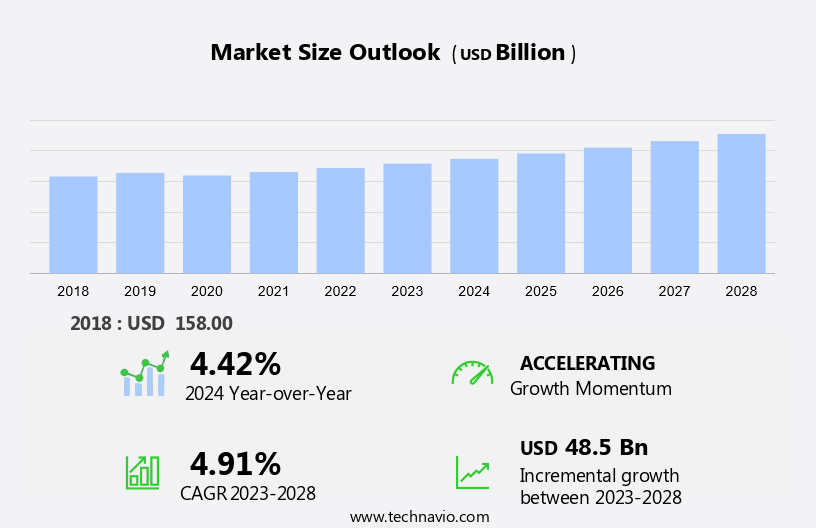
The powered agriculture equipment market size is forecast to increase by USD 48.5 billion at a CAGR of 4.91% between 2023 and 2028.
- The market is experiencing significant growth due to various factors. One key driver is the availability of loan programs from the government and financial institutions. These loans, which offer maximum loan amounts for the purchase of new tractors, combine harvesters, and other equipment, have encouraged farmers to invest in more efficient and productive machinery. Additionally, conservation loans, designed to support sustainable agricultural practices, have gained popularity among small farmers. Another trend is the rising deployment of smart agricultural practices and technologies for precision farming, which enables farmers to optimize resource usage and improve crop yields. In response to these trends, production facilities are expanding to meet the increasing demand for agricultural equipment. Furthermore, the need for working capital during agricultural downturns has led to the growing availability of rental agricultural equipment. These developments are enhancing the productivity and efficiency of farmers, making agriculture a vibrant sector In the US economy.
What will be the Size of the Powered Agriculture Equipment Market During the Forecast Period?
- The agriculture sector In the United States continues to evolve, with a growing emphasis on maximizing efficiency, productivity, and sustainability. Agriculture equipment plays a crucial role in this transformation, providing farmers with the tools necessary to optimize their operations and drive business growth. Family-sized farmers and commercial enterprises alike rely on a diverse range of agriculture equipment to manage their land, livestock, and farming techniques. From tractors and harvesters to advanced technologies that support precision farming, these investments are essential for maintaining operational efficiency and ensuring a successful production cycle.
- Access to commercial credit from banks and lenders is vital for farmers looking to acquire new equipment or upgrade their existing fleet. Guarantees offered by these financial institutions can help farmers secure the necessary financing, enabling them to invest In the latest agriculture equipment and improve their overall business performance. Despite the benefits, the penetration of agriculture equipment In the U.S. Market remains relatively low. However, the increasing wages for labor and the need to minimize environmental impact are driving the demand for more efficient and sustainable farming solutions. Light-duty electric tractors and other advanced technologies are gaining popularity In the agriculture rental market.
How is this Powered Agriculture Equipment Industry segmented and which is the largest segment?
The research report provides comprehensive data (region-wise segment analysis), with forecasts and estimates in "USD billion" for the period 2024-2028, as well as historical data from 2018-2022 for the following segments.
- Product
- Tractors
- Harvesting machinery
- Planting and fertilizing machinery
- Haying machinery
- Others
- Geography
- APAC
- China
- India
- Japan
- North America
- US
- Europe
- Germany
- Middle East and Africa
- South America
- APAC
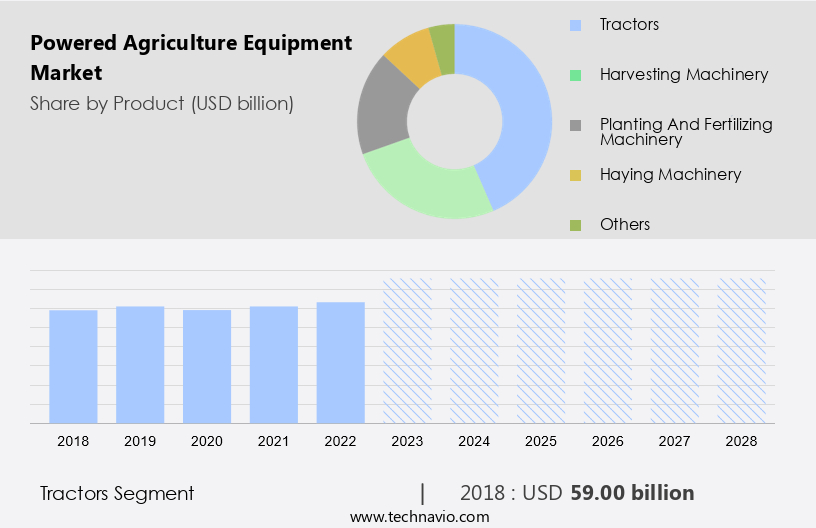
By Product Insights
- The tractors segment is estimated to witness significant growth during the forecast period.
In the agricultural sector, the implementation of advanced technology in farming practices, specifically the use of powerful tractors for precision farming, is gaining significant traction. These tractors, which include models with horsepower ranging from less than 35 to over 50, cater to various farm sizes. Small farms typically utilize tractors with a capacity of under 35 horsepower, while larger operations require medium and large tractors with capacities exceeding 50 horsepower. The agricultural industry is transforming, with a decreasing workforce and a growing emphasis on mechanization driving the demand for these tractors. Farmers seeking to upgrade their equipment can explore loan programs to finance their purchases.
Furthermore, conservation loans, for instance, offer maximum loan amounts to finance the acquisition of production facilities and working capital, which can include the purchase of new tractors and harvesters. During economic downturns, these financing options can be particularly beneficial for farmers looking to maintain efficiency and productivity on their farms. Overall, the adoption of powerful agriculture equipment, such as tractors, is essential for farmers to remain competitive and adapt to the evolving agricultural landscape.
Get a glance at the Powered Agriculture Equipment Industry report of share of various segments Request Free Sample
The tractors segment was valued at USD 59.00 billion in 2018 and showed a gradual increase during the forecast period.
Regional Analysis
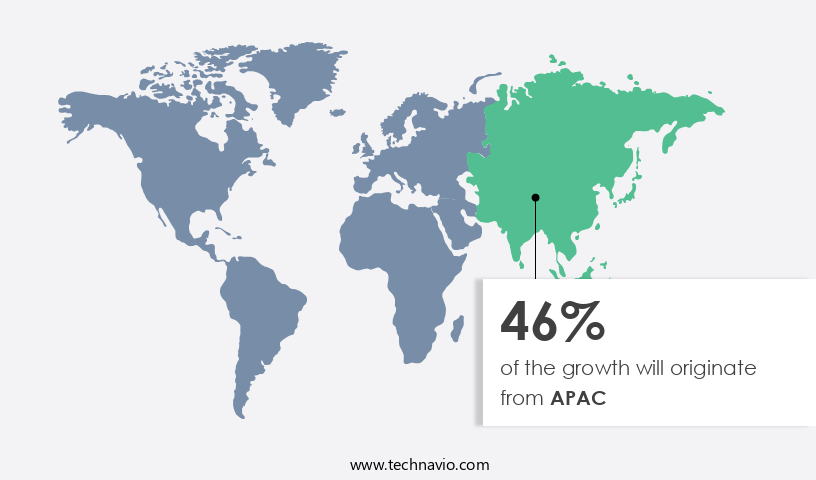
- APAC is estimated to contribute 46% to the growth of the global market during the forecast period.
Technavio's analysts have elaborately explained the regional trends and drivers that shape the market during the forecast period.
For more insights on the market share of various regions, Request Free Sample
The market In the Asia Pacific region is experiencing significant growth due to several key factors. One major driver is the implementation of government initiatives aimed at promoting sustainable farming practices. Additionally, the availability of financing options for agriculture and the increasing trend towards contract farming are contributing to market expansion. Another significant factor is global population growth, which is increasing the demand for food and necessitating the use of advanced technologies in agriculture. Advanced technologies, such as mobile applications, are becoming increasingly prevalent In the agriculture industry. These technologies enable farmers to monitor and manage their equipment and crops more efficiently.
Furthermore, the integration of electrical drives, computer sensing, and digitalization in agriculture equipment is leading to increased versatility and adaptability. Off-road vehicles, such as light-duty electric tractors, are gaining popularity due to their environmental impact and cost competitiveness. The Euro Stage IV regulations are driving the adoption of cleaner and more efficient diesel tractors. The use of these tractors, along with the seamless attachment capabilities of various machinery, is enhancing the productivity and efficiency of farming operations. China is expected to dominate the market share In the Asia Pacific region due to the vast opportunities available for agricultural equipment manufacturers.
Market Dynamics
Our researchers analyzed the data with 2023 as the base year, along with the key drivers, trends, and challenges. A holistic analysis of drivers will help companies refine their marketing strategies to gain a competitive advantage.
What are the key market drivers leading to the rise In the adoption of Powered Agriculture Equipment Industry?
Government initiatives to support sustainable agricultural practices is the key driver of the market.
- The agricultural sector is witnessing a shift towards more sustainable practices, with various organizations in different parts of the world promoting productivity growth. The International Fund for Agricultural Development (IFAD) and the Indian government's collaboration has led to substantial progress in enhancing the income of small farmers by providing them access to new market opportunities. Initiatives like eNAM and Pradhan Mantri Krishi Sinchayee PMKSY aim to enhance the availability of farming equipment to small-scale farmers in India. These initiatives are driving the demand for powered agriculture equipment, such as battery-operated vehicles, In the country. Farmers in emerging nations are increasingly turning to powered agriculture equipment to reduce their reliance on manual labor and draught animals.
- However, the high vehicle costs and power rates remain significant barriers for smallholder farmers. In farm equipment, tractor sales have shown a steady increase, with larger farms accounting for a significant portion of the sales. Nevertheless, the smaller farm size in emerging nations necessitates the adoption of more cost-effective and efficient solutions, making battery-powered agriculture equipment an attractive option.
What are the market trends shaping the Powered Agriculture Equipment Industry?
The rising deployment of equipment and technologies for precision farming is the upcoming market trend.
- Precision farming is a modern agricultural approach that utilizes global positioning systems to manage crops and livestock more efficiently. This system enables farmers to monitor and control field equipment, such as irrigation systems, agrochemical sprayers, and weed control systems, in real-time. The benefits of precision farming extend beyond equipment guidance, yield inspection, and variable rate input applications. By optimizing the use of resources like water, fertilizers, and pesticides, precision farming can lead to increased crop yields and profitability. The potential for higher profits in precision farming is expected to fuel its adoption among farmers during the forecast period. Family size farmers and commercial operations alike stand to benefit from the cost savings and increased productivity that precision farming offers.
- Equipment, feed, seed, and supplies are essential components of farming operations, and precision farming can help farmers minimize their usage and maximize their returns. Access to commercial credit from banks and lenders is crucial for farmers to invest in precision farming equipment. The ability to secure financing for these investments can make a significant difference In the success of a farming operation. As precision farming becomes more widespread, farmers need to stay informed about the latest trends and technologies to remain competitive. By adopting precision farming practices, farmers can ensure they are using their land and livestock resources effectively and sustainably.
What challenges does the Powered Agriculture Equipment Industry face during its growth?
The growing availability of rental agricultural equipment is a key challenge affecting the industry growth.
- The agricultural mechanization sector is witnessing a notable shift towards equipment rental services due to the financial constraints faced by many farmers, particularly in developing countries. This trend is driving momentum In the agricultural equipment market as farmers gain access to modern machinery on flexible terms, thereby enhancing their crop yields and income.
- However, this shift may negatively impact equipment companies as rental demand can replace new sales. Additionally, the long product replacement cycle, which typically lasts around ten years, adds complexity to the market dynamics. Financial incentives, such as subsidies and tax benefits, are being introduced by governments to encourage farmers to invest in precision agriculture and cleaner transportation, including electric farm tractors. These trends are expected to shape the future of the agricultural equipment industry In the United States and beyond.
Exclusive Customer Landscape
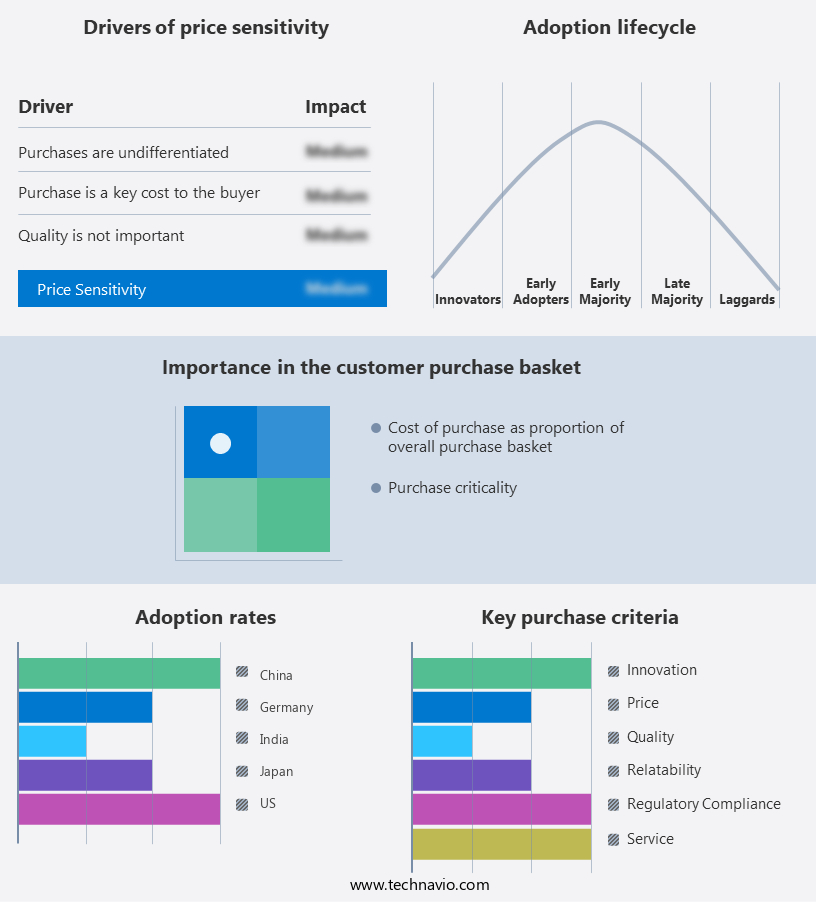
The market forecasting report includes the adoption lifecycle of the market, covering from the innovator's stage to the laggard's stage. It focuses on adoption rates in different regions based on penetration. Furthermore, the market report also includes key purchase criteria and drivers of price sensitivity to help companies evaluate and develop their market growth analysis strategies.
Customer Landscape
Key Companies & Market Insights
Companies are implementing various strategies, such as strategic alliances, powered agriculture equipment market forecast, partnerships, mergers and acquisitions, geographical expansion, and product/service launches, to enhance their presence In the industry.
The industry research and growth report includes detailed analyses of the competitive landscape of the market and information about key companies, including:
- AGCO Corp.
- Alamo Group Inc.
- Autonomous Tractor Corp.
- CLAAS KGaA mBH
- CNH Industrial NV
- Deere and Co.
- EcoRobotix SA
- Escorts Ltd.
- farming revolution GmbH
- Harvest Automation
- Harvest CROO Robotics LLC
- ISEKI and Co. Ltd.
- Kinze Manufacturing Inc.
- Kubota Corp.
- Lovol Heavy Industry Co. Ltd.
- Mahindra and Mahindra Ltd.
- Tractors and Farm Equipment Ltd.
- Trimble Inc.
- Yamaha Motor Co. Ltd.
- Yanmar Holdings Co. Ltd.
- Zetor Tractors as
Qualitative and quantitative analysis of companies has been conducted to help clients understand the wider business environment as well as the strengths and weaknesses of key industry players. Data is qualitatively analyzed to categorize companies as pure play, category-focused, industry-focused, and diversified; it is quantitatively analyzed to categorize companies as dominant, leading, strong, tentative, and weak.
Research Analyst Overview
The agriculture sector is witnessing a significant shift towards farm mechanization, with farmers of all sizes turning to agriculture equipment to boost efficiency and productivity. Guarantees from banks and lenders are becoming increasingly important for farmers looking to invest in new tractors, harvesters, and other essential farming equipment. The farm equipment market is experiencing growth due to the need for modernization and business expansion. Commercial credit from banks plays a crucial role In the purchase of agriculture equipment, including tractors, combines, and other machinery. The maximum loan amount for these loans varies depending on the size of the farm, livestock, and production facilities.
Moreover, conservation loans are also available to help farmers invest in equipment that promotes sustainable agriculture and reduces the environmental impact. The rental market for agriculture equipment is gaining momentum, particularly among small farmers who cannot afford to purchase new equipment outright. Rising wages and the availability of advanced technologies, such as mobile applications and precision farming techniques, are driving the demand for more efficient and adaptable equipment. The farm tractor market is witnessing a shift towards hybrid and electric tractors, offering cleaner transportation and lower fuel costs. The total tractor sales are expected to continue growing, despite the occasional downturn In the agricultural sector.
Furthermore, the farm equipment market in emerging nations is experiencing significant growth due to the increasing awareness of the benefits of mechanization and the availability of financial incentives. Irrigation, TAFE, and other farm supplies are also essential components of the agriculture equipment market. The versatility and adaptability of modern agriculture equipment are crucial for farmers to remain competitive In the market and meet the demands of the supply chain for essential services. The cost competitiveness of agriculture equipment, including battery-powered and Euro Stage IV diesel tractors, is a significant factor In the market's growth.
|
Market Scope |
|
|
Report Coverage |
Details |
|
Page number |
144 |
|
Base year |
2023 |
|
Historic period |
2018-2022 |
|
Forecast period |
2024-2028 |
|
Growth momentum & CAGR |
Accelerate at a CAGR of 4.91% |
|
Market growth 2024-2028 |
USD 48.5 billion |
|
Market structure |
Fragmented |
|
YoY growth 2023-2024(%) |
4.42 |
|
Key countries |
China, US, Japan, Germany, and India |
|
Competitive landscape |
Leading Companies, Market Positioning of Companies, Competitive Strategies, and Industry Risks |
What are the Key Data Covered in this Powered Agriculture Equipment Market Research and Growth Report?
- CAGR of the Powered Agriculture Equipment industry during the forecast period
- Detailed information on factors that will drive the growth and forecasting between 2024 and 2028
- Precise estimation of the size of the market and its contribution of the industry in focus to the parent market
- Accurate predictions about upcoming growth and trends and changes in consumer behaviour
- Growth of the market across APAC, North America, Europe, Middle East and Africa, and South America
- Thorough analysis of the market's competitive landscape and detailed information about companies
- Comprehensive analysis of factors that will challenge the powered agriculture equipment market growth of industry companies
We can help! Our analysts can customize this powered agriculture equipment market research report to meet your requirements.
 RIA -
RIA - 
