Farm Equipment Market Size 2024-2028
The farm equipment market size is valued to increase by USD 41.12 billion, at a CAGR of 5.47% from 2023 to 2028. Increasing adoption of precision farming technologies will drive the farm equipment market.
Major Market Trends & Insights
- APAC dominated the market and accounted for a 46% growth during the forecast period.
- By Type - Manual segment was valued at USD 53.34 billion in 2022
- By Product - Implement segment accounted for the largest market revenue share in 2022
Market Size & Forecast
- Market Opportunities: USD 50.44 billion
- Market Future Opportunities: USD 41.12 billion
- CAGR from 2023 to 2028 : 5.47%
Market Summary
- The market is experiencing significant growth due to the increasing adoption of advanced technologies such as precision farming. This trend is driven by the need for higher operational efficiency, improved crop yields, and reduced environmental impact. One area of particular growth is the adoption of small tractors by small and private farm owners, including those in the agriculture sectors of vineyards and orchards. While the initial investment in acquiring farm equipment can be substantial, the long-term benefits include increased productivity, reduced labor costs, and improved compliance with regulations. For instance, a farm in the Midwest United States implemented a supply chain optimization strategy by investing in automated farm equipment.
- This investment led to a 15% reduction in equipment downtime, translating to an annual cost savings of over USD50,000. The implementation of this technology also improved compliance with regulations related to food safety and labor laws, ensuring the farm's continued eligibility for lucrative contracts with major food retailers. As the agricultural industry continues to evolve, the adoption of advanced farm equipment will remain a key driver of growth and competitiveness.
What will be the Size of the Farm Equipment Market during the forecast period?

Get Key Insights on Market Forecast (PDF) Request Free Sample
How is the Farm Equipment Market Segmented ?
The farm equipment industry research report provides comprehensive data (region-wise segment analysis), with forecasts and estimates in "USD billion" for the period 2024-2028, as well as historical data from 2018-2022 for the following segments.
- Type
- Manual
- Semi automatic
- Automatic
- Product
- Implement
- Combines
- Sprayer
- Baler
- Geography
- North America
- US
- Europe
- France
- APAC
- Australia
- China
- South America
- Brazil
- Rest of World (ROW)
- North America
By Type Insights
The manual segment is estimated to witness significant growth during the forecast period.
The market encompasses a broad spectrum of technologies and tools, with agricultural mechanization at its core. Precision agriculture, fueled by smart farming sensors, agricultural drones, and weather forecasting models, is revolutionizing modern farming practices. GPS-guided machinery, harvesting equipment, autonomous tractors, and precision spraying technology are transforming farm operations, enhancing efficiency and reducing machinery downtime. Sustainable farming practices, such as irrigation systems and soil moisture sensors, promote optimal crop health and yield. Farm automation systems, crop management software, yield monitoring systems, and field mapping software facilitate data acquisition and sensor data integration. Agricultural robotics and livestock management systems streamline farm processes, while equipment utilization metrics and machinery maintenance scheduling optimize resource allocation.
Water resource management and fuel efficiency analysis contribute to sustainable farming strategies. Remote sensing technology and data analytics platforms enable variable rate technology and soil nutrient analysis, further boosting farm productivity. Despite the advancements in farm equipment technology, the manual segment remains critical, particularly in regions with low mechanized equipment penetration. Manual tools, such as hand plows, scythes, sickles, and manual seeders, are essential for small-scale farmers due to their affordability, ease of use, and adaptability.

The Manual segment was valued at USD 53.34 billion in 2018 and showed a gradual increase during the forecast period.

Regional Analysis
APAC is estimated to contribute 46% to the growth of the global market during the forecast period.Technavio's analysts have elaborately explained the regional trends and drivers that shape the market during the forecast period.

See How Farm Equipment Market Demand is Rising in APAC Request Free Sample
In the Asia-Pacific region, the markets experience significant growth due to increasing government initiatives supporting sustainable agricultural practices. India is among the major markets, with the Department of Agriculture and Farmers Welfare (DA and FW) spearheading programs to advance mechanization. Farm Machinery Training and Testing Institutes, accredited State Agricultural Universities, and the Indian Council of Agricultural Research conduct performance testing to ensure farm machinery and implements meet quality standards. This focus on quality and efficiency is crucial as India and other APAC countries implement strategies to improve soil health, water management, and irrigation, as well as adopt improved seed varieties and hygiene practices.
According to industry reports, the market in India is projected to reach USD11.5 billion by 2025, growing at a steady pace due to these factors. In comparison, China's the market was valued at USD22.5 billion in 2020, demonstrating the substantial potential in the region.
Market Dynamics
Our researchers analyzed the data with 2023 as the base year, along with the key drivers, trends, and challenges. A holistic analysis of drivers will help companies refine their marketing strategies to gain a competitive advantage.
The market is experiencing significant transformation as technology continues to play an increasingly crucial role in agriculture. Automation is one key area of focus, with the implementation of automated machinery and drones reducing the need for manual labor and increasing efficiency. Optimizing machinery maintenance schedules through predictive analytics is another area of importance, ensuring equipment remains in top condition and minimizing downtime. Fuel efficiency is a major concern for farmers, and improving it is a priority. Precision fertilizer application techniques, optimizing irrigation strategies for water conservation, and implementing smart farming technologies are all strategies being adopted to reduce waste and enhance crop yields. Enhancing soil health is also a priority, with precision agriculture techniques and sustainable agriculture practices being leveraged to improve soil quality and reduce greenhouse gas emissions. Monitoring livestock health with wearable sensors and analyzing sensor data for improved farm management are also becoming common practices. Predictive maintenance for farm equipment is essential for preventing costly breakdowns, while assessing the effectiveness of precision spraying and implementing sustainable agriculture practices are key to reducing crop losses and minimizing the environmental impact of farming operations. Technological solutions are also being adopted to improve farm safety, with drone technology being used for crop monitoring and real-time data analysis. Enhancing crop stress tolerance through technology and optimizing fertilizer use to increase yield are other areas of focus for farmers looking to maximize productivity and profitability. Overall, the market is undergoing a digital transformation, with technology playing a pivotal role in optimizing operations, reducing waste, and improving sustainability.
The integration of advanced technologies in agriculture is reshaping modern farm operations. Key areas include the impact of automation on farm labor, where mechanization and robotics are reducing manual dependence while creating new skill requirements. Efficiency goals are driving innovations such as improving fuel efficiency in farm operations and implementing precision fertilizer application techniques to minimize costs and environmental impact.
Crop protection and yield optimization are supported through reducing crop losses via efficient harvesting and enhancing soil health using precision agriculture practices. The adoption of digital and IoT-based tools is expanding, with smart farming technologies aimed at reducing waste and drone technology leveraged for crop monitoring.
Safety and sustainability remain central, with initiatives targeting improving farm safety through technological solutions, managing the environmental impact of farming operations, and adopting regenerative agriculture practices. These measures align closely with broader climate goals such as reducing greenhouse gas emissions from agriculture.
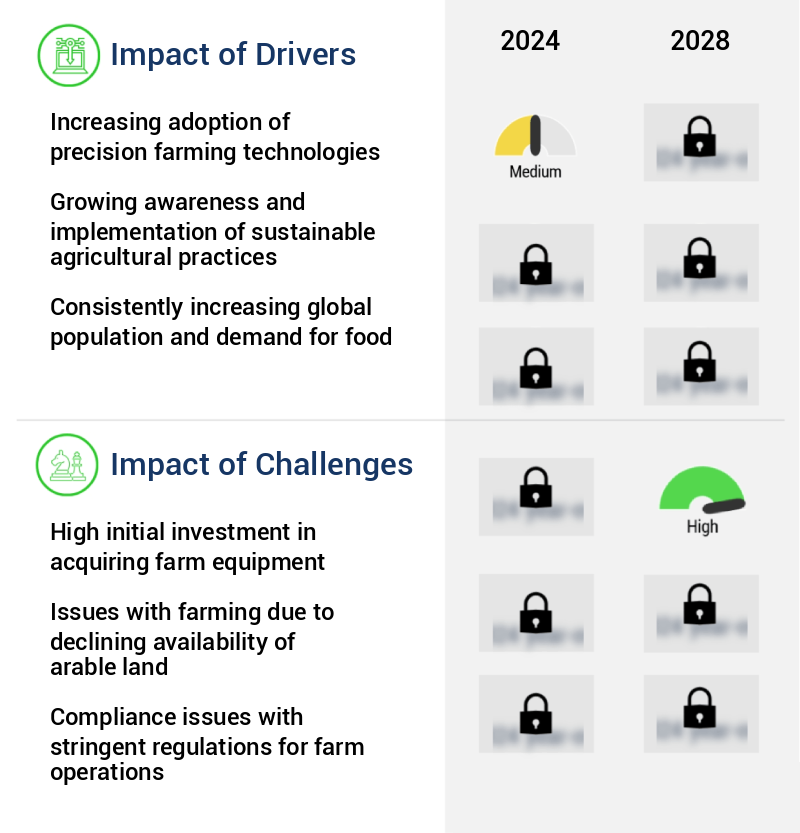
What are the key market drivers leading to the rise in the adoption of Farm Equipment Industry?
- The significant expansion of precision farming technology adoption serves as the primary market catalyst.
- Precision farming technologies have significantly influenced The market, revolutionizing agricultural practices and enhancing operational efficiency. This sector encompasses advanced technologies such as GPS guidance systems, remote sensing, drones, and data analytics. By enabling data-driven decision-making and precise management of farmlands, these innovations contribute to substantial savings in time, fuel, and resources. For instance, GPS-guided tractors and machinery, which employ satellite signals for accurate navigation, minimize field overlap during activities like planting, spraying, and harvesting.
- Consequently, farmers experience reduced downtime, increased productivity, and improved overall farm management. These advancements underscore the transformative power of technology in agriculture, setting the stage for a more sustainable and efficient future.
What are the market trends shaping the Farm Equipment Industry?
- Small and private farm owners, as well as vineyard and orchard operators, are increasingly adopting small tractors. This trend represents the market's future direction.
- In the agricultural sector, the demand for farm equipment, particularly small tractors, is surging due to the increasing number of small farmers and private farms worldwide. These tractors, with power less than 30 hp, offer significant advantages in maneuverability and ease of maintenance for small landholdings and specialized farming operations like vineyards and orchards. Small tractors' accessibility to engine components and practical maintenance points make them an efficient and cost-effective solution. Their compact size ensures optimal performance, enabling users to maintain traction, turn tightly, and run hydraulics smoothly.
- By integrating these tractors into their operations, farmers can enhance their productivity and efficiency, reducing downtime and improving forecast accuracy.
What challenges does the Farm Equipment Industry face during its growth?
- The high initial investment required to acquire farm equipment poses a significant challenge and significantly impacts the growth of the agricultural industry.
- The market is characterized by its evolving nature, catering to diverse farming applications and addressing underlying dynamics. Small-scale farmers and emerging countries face significant challenges in accessing and affording contemporary farm equipment. The high cost of purchasing advanced machinery, such as GPS guided tractors and precision farming equipment, poses a substantial barrier for these farmers. For instance, investing in specialized equipment like combine harvesters, irrigation systems, or precision seeding machinery requires substantial financial resources, which may be out of reach for farmers with limited means.
- Despite these challenges, the adoption of farm equipment continues to grow, driven by the need for increased productivity, enhanced regulatory compliance, and optimized costs. According to recent research, the global market for farm equipment is projected to expand at a steady pace, reflecting the ongoing demand for advanced technologies and solutions.
Exclusive Technavio Analysis on Customer Landscape
The farm equipment market forecasting report includes the adoption lifecycle of the market, covering from the innovator's stage to the laggard's stage. It focuses on adoption rates in different regions based on penetration. Furthermore, the farm equipment market report also includes key purchase criteria and drivers of price sensitivity to help companies evaluate and develop their market growth analysis strategies.

Customer Landscape of Farm Equipment Industry
Competitive Landscape
Companies are implementing various strategies, such as strategic alliances, farm equipment market forecast, partnerships, mergers and acquisitions, geographical expansion, and product/service launches, to enhance their presence in the industry.
AGCO Corp. - The German manufacturer specializes in providing advanced farm equipment, including the Fendt 1100 Vario MT tractor, Fendt 1000 Vario tractor, Fendt Cutter Front Mounting, and Fendt Slicer disc mower. These innovative solutions cater to diverse agricultural needs, showcasing the company's commitment to technological progress in the agricultural sector.
The industry research and growth report includes detailed analyses of the competitive landscape of the market and information about key companies, including:
- AGCO Corp.
- Argo Tractors SpA
- Brohawk exports
- Bucher Industries AG
- CLAAS KGaA mBH
- CNH Industrial NV
- Deere and Co.
- Duravant LLC
- ISEKI and Co. Ltd.
- J C Bamford Excavators Ltd.
- Kubota Corp.
- LEMKEN GmbH and Co. KG
- Mahindra and Mahindra Ltd.
- Maschio Gaspardo Spa
- SDF SpA
- Sitrex spa
- Sonalika International Tractors Ltd.
- Vaderstad AB
- Yanmar Holdings Co. Ltd.
- VST Tillers Tractors Ltd.
Qualitative and quantitative analysis of companies has been conducted to help clients understand the wider business environment as well as the strengths and weaknesses of key industry players. Data is qualitatively analyzed to categorize companies as pure play, category-focused, industry-focused, and diversified; it is quantitatively analyzed to categorize companies as dominant, leading, strong, tentative, and weak.
Recent Development and News in Farm Equipment Market
- In August 2024, John Deere, a leading agricultural equipment manufacturer, announced the launch of its new precision farming solution, "SmartFarm 3.0," at the World Agricultural Expo. This advanced technology integrates real-time weather data, satellite imagery, and machine learning algorithms to optimize crop yields and reduce water usage (John Deere press release).
- In November 2024, AGCO Corporation, another major farm equipment player, formed a strategic partnership with Microsoft to develop cloud-based precision farming solutions. This collaboration aimed to provide farmers with real-time data analysis and predictive maintenance services, enhancing operational efficiency (AGCO press release).
- In February 2025, CNH Industrial, a global leader in farm equipment, completed the acquisition of PrecisionHawk, a leading drone technology company. This acquisition enabled CNH Industrial to expand its precision farming offerings and provide farmers with advanced aerial imaging and data analytics services (CNH Industrial press release).
- In May 2025, the European Union approved the Farm to Fork Strategy, which includes a €22 billion investment in the European agricultural sector. This initiative focuses on sustainable farming practices, reducing the use of pesticides and fertilizers, and increasing the share of organic farming in the EU (European Commission press release).
Dive into Technavio's robust research methodology, blending expert interviews, extensive data synthesis, and validated models for unparalleled Farm Equipment Market insights. See full methodology.
|
Market Scope |
|
|
Report Coverage |
Details |
|
Page number |
174 |
|
Base year |
2023 |
|
Historic period |
2018-2022 |
|
Forecast period |
2024-2028 |
|
Growth momentum & CAGR |
Accelerate at a CAGR of 5.47% |
|
Market growth 2024-2028 |
USD 41.12 billion |
|
Market structure |
Fragmented |
|
YoY growth 2023-2024(%) |
5.06 |
|
Key countries |
US, China, Australia, France, and Brazil |
|
Competitive landscape |
Leading Companies, Market Positioning of Companies, Competitive Strategies, and Industry Risks |
Research Analyst Overview
- The market continues to evolve, driven by advancements in technology and the increasing adoption of smart farming practices. Smart farming sensors and agricultural drones are revolutionizing agriculture by providing real-time data on crop health, soil moisture levels, and weather patterns. This information enables farmers to make informed decisions, optimize resource usage, and improve yields. For instance, a leading farmer in the Midwest increased his corn yield by 10% by using precision agriculture technology, including GPS-guided machinery, yield monitoring systems, and field mapping software. This technology allowed him to apply fertilizers and irrigation more efficiently, reducing waste and enhancing crop health.
- The agricultural mechanization sector is also witnessing significant growth, with autonomous tractors and agricultural robotics gaining popularity. Farm automation systems, equipment utilization metrics, and machinery downtime reduction are key areas of focus for manufacturers, aiming to increase efficiency and productivity. Industry growth in the market is expected to remain robust, with estimates suggesting a steady expansion of over 5% annually. The integration of sensor data, irrigation systems, livestock management systems, and farm management software is transforming farming practices, making them more sustainable and data-driven. Moreover, the adoption of precision spraying technology, tractor implements, and crop health monitoring systems is enabling farmers to reduce their reliance on manual labor and chemicals, contributing to environmental sustainability.
- Water resource management and equipment maintenance scheduling are other areas where technology is playing a crucial role in optimizing farming operations. In conclusion, the market is undergoing continuous transformation, with technology playing a pivotal role in enhancing productivity, sustainability, and profitability for farmers. From soil health indicators to fuel efficiency analysis and farm optimization strategies, the integration of data analytics platforms, variable rate technology, and remote sensing technology is shaping the future of agriculture.
What are the Key Data Covered in this Farm Equipment Market Research and Growth Report?
-
What is the expected growth of the Farm Equipment Market between 2024 and 2028?
-
USD 41.12 billion, at a CAGR of 5.47%
-
-
What segmentation does the market report cover?
-
The report is segmented by Type (Manual, Semi automatic, and Automatic), Product (Implement, Combines, Sprayer, and Baler), and Geography (APAC, North America, Europe, South America, and Middle East and Africa)
-
-
Which regions are analyzed in the report?
-
APAC, North America, Europe, South America, and Middle East and Africa
-
-
What are the key growth drivers and market challenges?
-
Increasing adoption of precision farming technologies, High initial investment in acquiring farm equipment
-
-
Who are the major players in the Farm Equipment Market?
-
AGCO Corp., Argo Tractors SpA, Brohawk exports, Bucher Industries AG, CLAAS KGaA mBH, CNH Industrial NV, Deere and Co., Duravant LLC, ISEKI and Co. Ltd., J C Bamford Excavators Ltd., Kubota Corp., LEMKEN GmbH and Co. KG, Mahindra and Mahindra Ltd., Maschio Gaspardo Spa, SDF SpA, Sitrex spa, Sonalika International Tractors Ltd., Vaderstad AB, Yanmar Holdings Co. Ltd., and VST Tillers Tractors Ltd.
-
Market Research Insights
- The market is a continually evolving landscape, characterized by advancements in technology and innovation. Two significant trends shaping this industry include precision fertilizer application and sensor network integration. For instance, the adoption of precision fertilizer application technology has led to a reduction of up to 20% in fertilizer usage, resulting in cost savings and environmental benefits. Moreover, the integration of sensor networks in farming operations has enabled real-time monitoring of crop health, animal welfare, and water usage, contributing to increased efficiency and productivity.
- Industry experts anticipate that the market will expand by approximately 5% annually over the next five years, driven by the increasing demand for technology-driven solutions in agriculture.
We can help! Our analysts can customize this farm equipment market research report to meet your requirements.
 RIA -
RIA - 
