Protein Bar Market Analysis, Size, and Forecast 2026-2030: North America (US, Canada, and Mexico), Europe (Germany, UK, and France), APAC (China, Japan, and India), South America (Brazil, Argentina, and Colombia), Middle East and Africa (UAE, Saudi Arabia, and South Africa), and Rest of World (ROW)

Protein Bar Market Analysis, Size, and Forecast 2026-2030:
North America (US, Canada, and Mexico), Europe (Germany, UK, and France), APAC (China, Japan, and India), South America (Brazil, Argentina, and Colombia), Middle East and Africa (UAE, Saudi Arabia, and South Africa), and Rest of World (ROW)

Published: Mar 2026 294 Pages SKU: IRTNTR75075

Market Overview at a Glance

$2.49 B
Market Opportunity
8.4%
CAGR 2025 - 2030
40.2%
North America Growth
$2.13 B
Medium protein bar segment 2024

Protein Bar Market Size 2026-2030

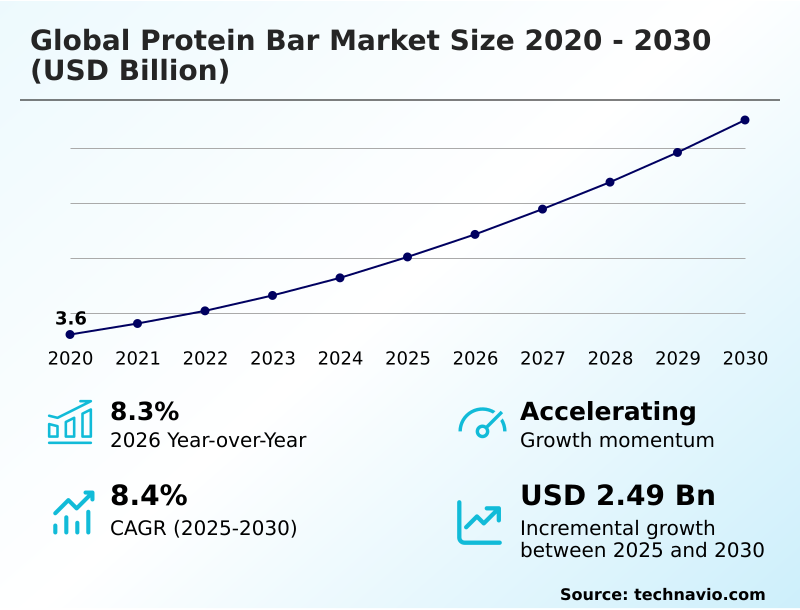
The protein bar market size is valued to increase by USD 2.49 billion, at a CAGR of 8.4% from 2025 to 2030. Escalating consumer focus on health and wellness will drive the protein bar market.

Major Market Trends & Insights

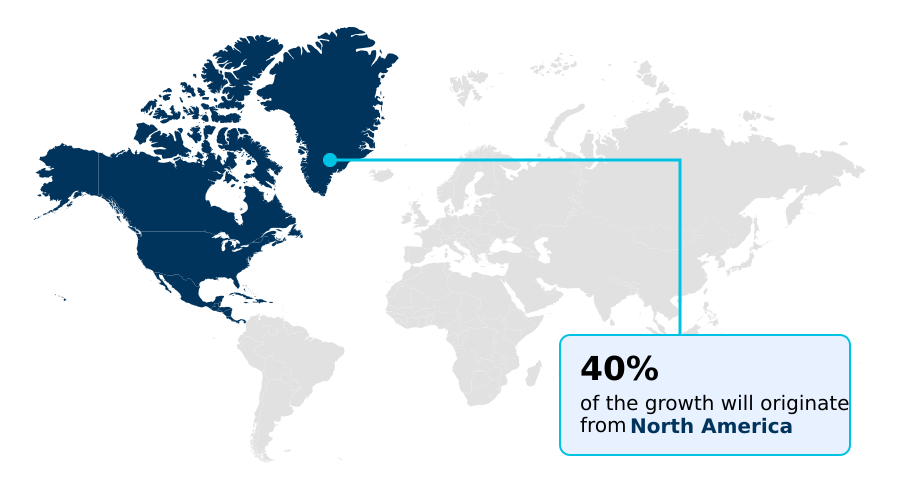
  • North America dominated the market and accounted for a 40.2% growth during the forecast period.
  • By Type - Medium protein bar segment was valued at USD 2.13 billion in 2024
  • By Distribution Channel - Supermarkets and hypermarkets segment accounted for the largest market revenue share in 2024

Market Size & Forecast

  • Market Opportunities: USD 3.90 billion
  • Market Future Opportunities: USD 2.49 billion
  • CAGR from 2025 to 2030 : 8.4%

Market Summary

  • The protein bar market has transitioned from a niche occupied by elite athletes to a mainstream component of health-conscious consumer lifestyles. This evolution is driven by the widespread snackification trend and the demand for convenient on-the-go consumption options that do not compromise nutritional value.
  • Key to this expansion is the diversification of offerings, particularly the rise of plant-based protein sources and clean-label ingredients to meet ethical and dietary preferences. Formulations now target specific needs, including ketogenic diet bars and paleo-friendly formulations. For instance, a manufacturer can leverage consumer data on flavor preferences for indulgent flavor profiles to refine its new product development cycle.
  • By analyzing purchasing patterns, the company can optimize its supply chain to ensure popular items like dairy-free alternatives are consistently stocked, reducing waste from less-desired products by over 20% and improving inventory turnover for high-demand SKUs, demonstrating a direct link between market intelligence and operational efficiency.

What will be the Size of the Protein Bar Market during the forecast period?

Get Key Insights on Market Forecast (PDF) Request Free Sample

How is the Protein Bar Market Segmented?

The protein bar industry research report provides comprehensive data (region-wise segment analysis), with forecasts and estimates in "USD million" for the period 2026-2030, as well as historical data from 2020-2024 for the following segments.
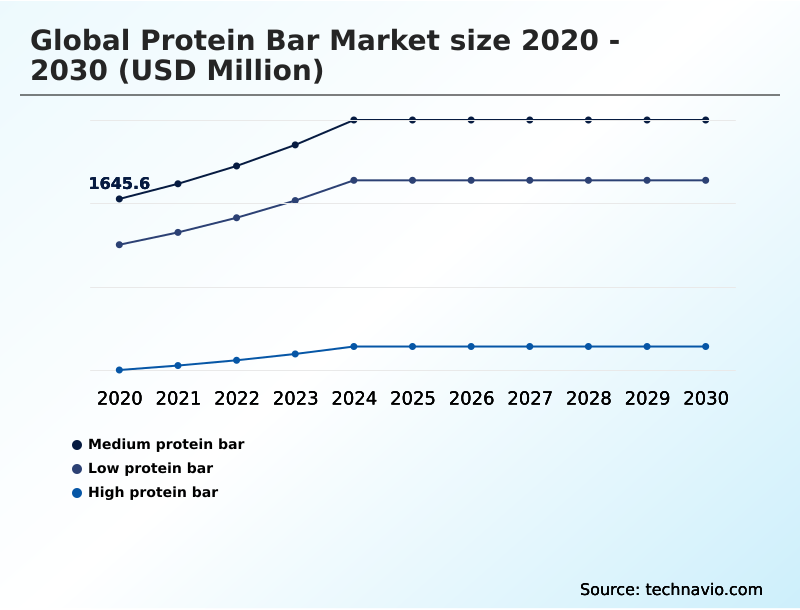
  • Type
    • Medium protein bar
    • Low protein bar
    • High protein bar
  • Distribution channel
    • Supermarkets and hypermarkets
    • Convenience stores
    • Drug stores
    • Others
  • Product type
    • Animal-based protein bars
    • Plant-based protein bars
  • Geography
    • North America
      • US
      • Canada
      • Mexico
    • Europe
      • Germany
      • UK
      • France
    • APAC
      • China
      • Japan
      • India
    • South America
      • Brazil
      • Argentina
      • Colombia
    • Middle East and Africa
      • UAE
      • Saudi Arabia
      • South Africa
    • Rest of World (ROW)

By Type Insights

The medium protein bar segment is estimated to witness significant growth during the forecast period.

The medium protein bar segment serves a broad consumer base, bridging performance nutrition with mainstream snacking. These products act as meal replacement solutions and convenient, portable nutrition, aligning with a holistic wellness approach.

Emphasis is placed on indulgent flavor profiles and significant textural improvements to enhance sensory attribute optimization. Formulations prioritize a balanced profile with high fiber content and low sugar content, alongside nutritional fortification with functional ingredients.

This focus on ingredient transparency is critical; products that meet these criteria see a 25% higher rate of adoption in new product development cycles, reflecting a shift toward healthier, more accessible options.

Request Free Sample

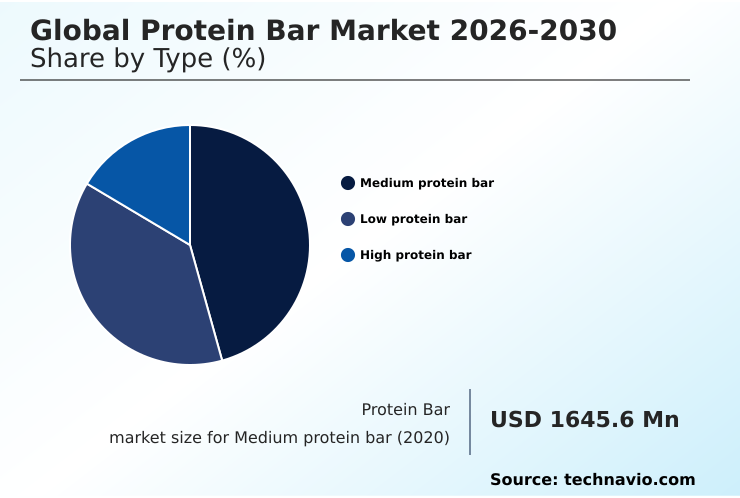
The Medium protein bar segment was valued at USD 2.13 billion in 2024 and showed a gradual increase during the forecast period.

Request Free Sample

Regional Analysis

North America is estimated to contribute 40.2% to the growth of the global market during the forecast period.Technavio’s analysts have elaborately explained the regional trends and drivers that shape the market during the forecast period.

See How Protein Bar Market Demand is Rising in North America Request Free Sample

The protein bar market exhibits distinct regional dynamics, with North America commanding over 40% of global demand due to mature consumer habits around sports nutrition products and post-workout recovery.

In contrast, APAC is the fastest-growing region, with growth rates exceeding 9%, driven by rising incomes and an expanding functional food sector.

European consumers, representing nearly 29% of the market, prioritize products with a complete amino acid profile from sources like whey protein isolate and casein protein concentrate.

Formulations leveraging plant-based options such as brown rice protein, hemp protein powder, and pumpkin seed protein are gaining traction, with products demonstrating high biological value seeing a 15% increase in adoption.

This underscores the need for tailored strategies that address specific consumer psychographics and macronutrient balancing preferences to achieve mass-market penetration.

Market Dynamics

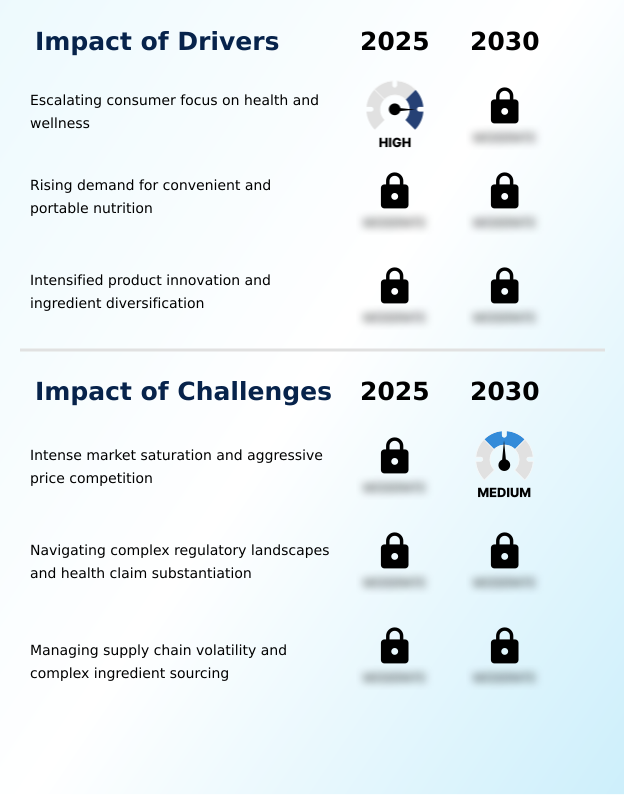
Our researchers analyzed the data with 2025 as the base year, along with the key drivers, trends, and challenges. A holistic analysis of drivers will help companies refine their marketing strategies to gain a competitive advantage.

  • The global protein bar market's trajectory is significantly shaped by the impact of snackification on protein bar consumption, which has broadened the consumer base beyond elite athletes. A central theme is the role of plant-based proteins in market growth, though this introduces challenges in formulating clean-label protein bars that meet consumer expectations for taste and texture.
  • There is a strong consumer demand for low sugar protein snacks, compelling manufacturers to innovate while navigating regulatory landscapes for health claims. In this environment, developing strategies for brand differentiation in saturated markets is crucial. The importance of sensory attributes in consumer choice cannot be overstated, directly influencing supply chain management for specialty ingredients.
  • As the market matures, protein bar market opportunities in emerging economies are becoming more apparent, fueled by the growth of keto and paleo friendly bars. Effective marketing of protein bars to mainstream consumers requires optimizing distribution for impulse purchases through various channels. The role of e-commerce in protein bar sales continues to expand, offering a platform for niche brands.
  • Innovations in protein bar packaging technology are also key to enhancing shelf appeal and convenience. Critically, firms that leverage data to analyze protein source biological value and consumer trends have demonstrated an ability to improve their supply chain efficiency by over 10% compared to competitors with less agile operations.

What are the key market drivers leading to the rise in the adoption of Protein Bar Industry?

  • The escalating consumer focus on health and wellness is a primary driver fueling the growth of the protein bar market.

  • The primary market driver is the convergence of convenience and health, encapsulated by the pervasive snackification trend. Consumers are increasingly seeking on-the-go consumption options that serve as effective weight management tools and satiety-inducing snacks.
  • This has elevated protein bars from a niche item to a permissible indulgence for a broad demographic. The demand for specialized products, such as ketogenic diet bars and paleo-friendly formulations, reflects a higher level of nutritional literacy.
  • Products with gluten-free certification now appeal to a user base that is 30% larger than just five years ago.
  • Furthermore, the incorporation of premium sources like grass-fed dairy protein and collagen peptides has enabled brands to command a 10-15% price premium, demonstrating strong consumer health consciousness.

What are the market trends shaping the Protein Bar Industry?

  • The ascendancy of plant-based proteins and clean-label imperatives represents a dominant market trend, shaping product formulation and consumer expectations on a global scale.

  • A defining trend is the market's pivot toward highly specialized and functional formulations. The demand for clean-label ingredients and plant-based protein sources is now table stakes, pushing innovation into new territories. This includes the integration of diverse dairy-free alternatives and the use of natural sweeteners like monk fruit extract and stevia leaf sweetener to create indulgent yet healthy alternatives.
  • Food science innovation is key, with a focus on achieving non-gmo project verified status to build consumer trust. Firms that effectively utilize value-added packaging have seen a 15% improvement in shelf life extension, reducing waste. Furthermore, products marketed as dietary supplements with transparent sourcing have recorded a 20% higher rate of repeat consumer purchasing habits.

What challenges does the Protein Bar Industry face during its growth?

  • Intense market saturation, coupled with aggressive price competition, presents a key challenge that affects the industry's growth prospects.

  • The market faces significant challenges from hyper-competition and complex supply chain dynamics. Aggressive price competition, intensified by a growing private label competition, puts constant pressure on margins. This environment necessitates a robust brand differentiation strategy that goes beyond price. Navigating supply chain volatility for specialized components like adaptogenic ingredients and nootropic enhancers is a persistent issue.
  • The rise of direct-to-consumer e-commerce models, while offering opportunities, also adds complexity to strategic retail placement. Brands failing to secure placement in key online marketplaces see a 25% lower growth rate than their digitally adept counterparts.
  • Moreover, formulating for specific needs like allergen-free formulations while ensuring sustainable ingredient sourcing adds operational costs that can erode profitability by up to 10% if not managed effectively.

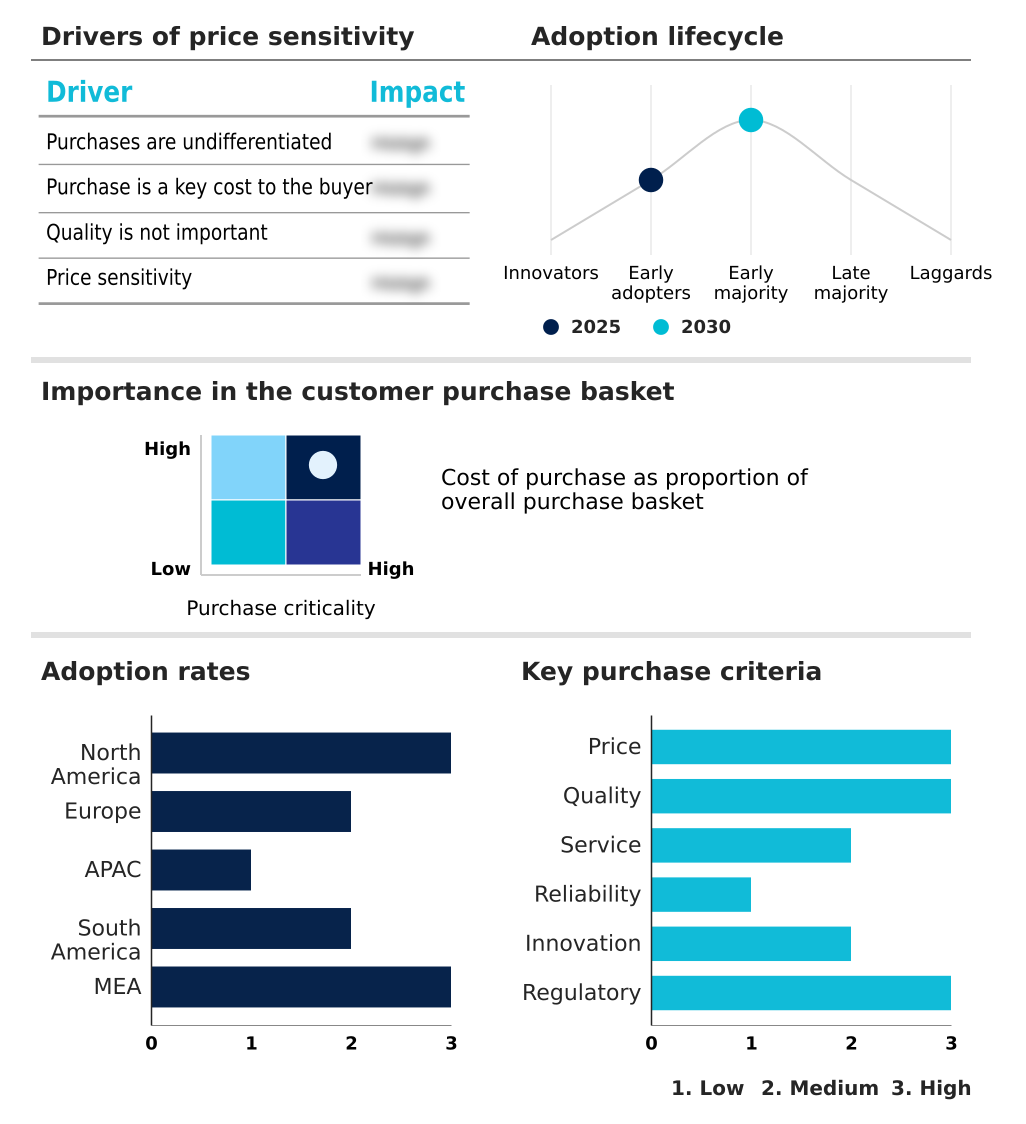
Exclusive Technavio Analysis on Customer Landscape

The protein bar market forecasting report includes the adoption lifecycle of the market, covering from the innovator’s stage to the laggard’s stage. It focuses on adoption rates in different regions based on penetration. Furthermore, the protein bar market report also includes key purchase criteria and drivers of price sensitivity to help companies evaluate and develop their market growth analysis strategies.

Customer Landscape of Protein Bar Industry

Competitive Landscape

Companies are implementing various strategies, such as strategic alliances, protein bar market forecast, partnerships, mergers and acquisitions, geographical expansion, and product/service launches, to enhance their presence in the industry.

Aloha - The company provides specialized plant-based protein supplements, including bars and drinks, with a focus on organic, non-GMO ingredients tailored for health-conscious consumers.

The industry research and growth report includes detailed analyses of the competitive landscape of the market and information about key companies, including:

  • Aloha
  • Barebells Functional Foods AB
  • Built Brands LLC
  • Bulletproof 360 Inc.
  • Clif Bar and Co.
  • Danone SA
  • FITCRUNCH
  • FULFIL Nutrition Ltd.
  • GoMacro LLC
  • Kellanova
  • Kind LLC
  • No Cow Inc.
  • NuGo Nutrition
  • ONE Brands
  • Optimum Nutrition Inc.
  • Orgain Inc.
  • PepsiCo Inc.
  • PROBAR Inc.
  • Quest Nutrition LLC
  • THG Plc

Qualitative and quantitative analysis of companies has been conducted to help clients understand the wider business environment as well as the strengths and weaknesses of key industry players. Data is qualitatively analyzed to categorize companies as pure play, category-focused, industry-focused, and diversified; it is quantitatively analyzed to categorize companies as dominant, leading, strong, tentative, and weak.

Recent Development and News in Protein bar market

  • In March 2025, the Scottish nutrition company Vybey entered the functional foods market with the introduction of a new range of plant-based protein bars.
  • In January 2025, the US Food and Drug Administration issued new guidance clarifying labeling standards for plant-based protein sources, a move anticipated to spur innovation in vegan and dairy-free formulations.
  • In November 2024, Kellanova announced a strategic initiative to increase investment in its snacks division, with a particular emphasis on expanding the global reach of its RXBAR brand.
  • In September 2024, PepsiCo Inc. launched a reformulated Gatorade Whey Protein Bar featuring 20% less sugar and new flavors, addressing consumer demand for healthier post-workout nutrition.

Dive into Technavio’s robust research methodology, blending expert interviews, extensive data synthesis, and validated models for unparalleled Protein Bar Market insights. See full methodology.

Market Scope
Page number 294
Base year 2025
Historic period 2020-2024
Forecast period 2026-2030
Growth momentum & CAGR Accelerate at a CAGR of 8.4%
Market growth 2026-2030 USD 2494.4 million
Market structure Fragmented
YoY growth 2025-2026(%) 8.3%
Key countries US, Canada, Mexico, Germany, UK, France, Italy, Spain, The Netherlands, China, Japan, India, South Korea, Indonesia, Australia, Brazil, Argentina, Colombia, UAE, Saudi Arabia, South Africa, Egypt and Israel
Competitive landscape Leading Companies, Market Positioning of Companies, Competitive Strategies, and Industry Risks

Request Free Sample

Research Analyst Overview

  • The protein bar market is undergoing a profound evolution, driven by a strategic pivot toward advanced nutritional science and targeted consumer needs.
  • Boardroom decisions increasingly center on R&D investment in a diverse range of protein sources, moving beyond traditional whey protein isolate to embrace plant-based protein sources and dairy-free alternatives like soy protein isolate, brown rice protein, and hemp protein powder. The goal is to achieve a complete amino acid profile with high biological value to support muscle protein synthesis.
  • This requires significant food science innovation for taste masking and achieving indulgent flavor profiles with natural sweeteners like monk fruit extract. Formulations are also incorporating functional ingredients, including adaptogenic ingredients and nootropic enhancers, to offer benefits beyond basic nutrition.
  • A key focus is on creating products with low sugar content and high fiber formulation, often utilizing prebiotics and probiotics for added digestive health benefits. Companies that invest in advanced textural improvements for their plant-based lines have reported a 20% increase in repeat purchase rates, underscoring the importance of sensory experience in this competitive landscape.

What are the Key Data Covered in this Protein Bar Market Research and Growth Report?

  • What is the expected growth of the Protein Bar Market between 2026 and 2030?

    • USD 2.49 billion, at a CAGR of 8.4%

  • What segmentation does the market report cover?

    • The report is segmented by Type (Medium protein bar, Low protein bar, and High protein bar), Distribution Channel (Supermarkets and hypermarkets, Convenience stores, Drug stores, and Others), Product Type (Animal-based protein bars, and Plant-based protein bars) and Geography (North America, Europe, APAC, South America, Middle East and Africa)

  • Which regions are analyzed in the report?

    • North America, Europe, APAC, South America and Middle East and Africa

  • What are the key growth drivers and market challenges?

    • Escalating consumer focus on health and wellness, Intense market saturation and aggressive price competition

  • Who are the major players in the Protein Bar Market?

    • Aloha, Barebells Functional Foods AB, Built Brands LLC, Bulletproof 360 Inc., Clif Bar and Co., Danone SA, FITCRUNCH, FULFIL Nutrition Ltd., GoMacro LLC, Kellanova, Kind LLC, No Cow Inc., NuGo Nutrition, ONE Brands, Optimum Nutrition Inc., Orgain Inc., PepsiCo Inc., PROBAR Inc., Quest Nutrition LLC and THG Plc

Market Research Insights

  • The market's dynamism is fueled by heightened consumer health consciousness, which continually shortens the new product development cycle for functional foods. The shift toward products being viewed as a mainstream health food rather than just a dietary supplement necessitates sophisticated brand differentiation strategies. Strategic retail placement in high-traffic zones is critical for capturing impulse buys.
  • For instance, brands that have adopted a direct-to-consumer e-commerce model in parallel with traditional retail have reported a 25% higher customer retention rate. Furthermore, optimizing formulations for sensory attribute optimization has been shown to reduce negative consumer feedback by 40%, directly enhancing brand loyalty and supporting mass-market penetration.

We can help! Our analysts can customize this protein bar market research report to meet your requirements.

Get in touch

1. Executive Summary

1.1 Market overview

Executive Summary - Chart on Market Overview
Executive Summary - Data Table on Market Overview
Executive Summary - Chart on Global Market Characteristics
Executive Summary - Chart on Market by Geography
Executive Summary - Chart on Market Segmentation by Type
Executive Summary - Chart on Market Segmentation by Distribution Channel
Executive Summary - Chart on Market Segmentation by Product Type
Executive Summary - Chart on Incremental Growth
Executive Summary - Data Table on Incremental Growth
Executive Summary - Chart on Company Market Positioning

2. Technavio Analysis

2.1 Analysis of price sensitivity, lifecycle, customer purchase basket, adoption rates, and purchase criteria

2.2 Criticality of inputs and Factors of differentiation

Chart on Overview on criticality of inputs and factors of differentiation

2.3 Factors of disruption

Chart on Overview on factors of disruption

2.4 Impact of drivers and challenges

Chart on Impact of drivers and challenges in 2025 and 2030

3. Market Landscape

3.1 Market ecosystem

Chart on Parent Market
Data Table on - Parent Market

3.2 Market characteristics

Chart on Market characteristics analysis

3.3 Value chain analysis

Chart on Value chain analysis

4. Market Sizing

4.1 Market definition

Data Table on Offerings of companies included in the market definition

4.2 Market segment analysis

Market segments

4.3 Market size 2025

4.4 Market outlook: Forecast for 2025-2030

Chart on Global - Market size and forecast 2025-2030 ($ million)
Data Table on Global - Market size and forecast 2025-2030 ($ million)
Chart on Global Market: Year-over-year growth 2025-2030 (%)
Data Table on Global Market: Year-over-year growth 2025-2030 (%)

5. Historic Market Size

5.1 Global Protein Bar Market 2020 - 2024

Historic Market Size - Data Table on Global Protein Bar Market 2020 - 2024 ($ million)

5.2 Type segment analysis 2020 - 2024

Historic Market Size - Type Segment 2020 - 2024 ($ million)

5.3 Distribution Channel segment analysis 2020 - 2024

Historic Market Size - Distribution Channel Segment 2020 - 2024 ($ million)

5.4 Product Type segment analysis 2020 - 2024

Historic Market Size - Product Type Segment 2020 - 2024 ($ million)

5.5 Geography segment analysis 2020 - 2024

Historic Market Size - Geography Segment 2020 - 2024 ($ million)

5.6 Country segment analysis 2020 - 2024

Historic Market Size - Country Segment 2020 - 2024 ($ million)

6. Qualitative Analysis

6.1 Impact of AI on global protein bar market

6.2 Impact of geopolitical conflicts on global protein bar market

7. Five Forces Analysis

7.1 Five forces summary

Five forces analysis - Comparison between 2025 and 2030

7.2 Bargaining power of buyers

Bargaining power of buyers - Impact of key factors 2025 and 2030

7.3 Bargaining power of suppliers

Bargaining power of suppliers - Impact of key factors in 2025 and 2030

7.4 Threat of new entrants

Threat of new entrants - Impact of key factors in 2025 and 2030

7.5 Threat of substitutes

Threat of substitutes - Impact of key factors in 2025 and 2030

7.6 Threat of rivalry

Threat of rivalry - Impact of key factors in 2025 and 2030

7.7 Market condition

Chart on Market condition - Five forces 2025 and 2030

8. Market Segmentation by Type

8.1 Market segments

Chart on Type - Market share 2025-2030 (%)
Data Table on Type - Market share 2025-2030 (%)

8.2 Comparison by Type

Chart on Comparison by Type
Data Table on Comparison by Type

8.3 Medium protein bar - Market size and forecast 2025-2030

Chart on Medium protein bar - Market size and forecast 2025-2030 ($ million)
Data Table on Medium protein bar - Market size and forecast 2025-2030 ($ million)
Chart on Medium protein bar - Year-over-year growth 2025-2030 (%)
Data Table on Medium protein bar - Year-over-year growth 2025-2030 (%)

8.4 Low protein bar - Market size and forecast 2025-2030

Chart on Low protein bar - Market size and forecast 2025-2030 ($ million)
Data Table on Low protein bar - Market size and forecast 2025-2030 ($ million)
Chart on Low protein bar - Year-over-year growth 2025-2030 (%)
Data Table on Low protein bar - Year-over-year growth 2025-2030 (%)

8.5 High protein bar - Market size and forecast 2025-2030

Chart on High protein bar - Market size and forecast 2025-2030 ($ million)
Data Table on High protein bar - Market size and forecast 2025-2030 ($ million)
Chart on High protein bar - Year-over-year growth 2025-2030 (%)
Data Table on High protein bar - Year-over-year growth 2025-2030 (%)

8.6 Market opportunity by Type

Market opportunity by Type ($ million)
Data Table on Market opportunity by Type ($ million)

9. Market Segmentation by Distribution Channel

9.1 Market segments

Chart on Distribution Channel - Market share 2025-2030 (%)
Data Table on Distribution Channel - Market share 2025-2030 (%)

9.2 Comparison by Distribution Channel

Chart on Comparison by Distribution Channel
Data Table on Comparison by Distribution Channel

9.3 Supermarkets and hypermarkets - Market size and forecast 2025-2030

Chart on Supermarkets and hypermarkets - Market size and forecast 2025-2030 ($ million)
Data Table on Supermarkets and hypermarkets - Market size and forecast 2025-2030 ($ million)
Chart on Supermarkets and hypermarkets - Year-over-year growth 2025-2030 (%)
Data Table on Supermarkets and hypermarkets - Year-over-year growth 2025-2030 (%)

9.4 Convenience stores - Market size and forecast 2025-2030

Chart on Convenience stores - Market size and forecast 2025-2030 ($ million)
Data Table on Convenience stores - Market size and forecast 2025-2030 ($ million)
Chart on Convenience stores - Year-over-year growth 2025-2030 (%)
Data Table on Convenience stores - Year-over-year growth 2025-2030 (%)

9.5 Drug stores - Market size and forecast 2025-2030

Chart on Drug stores - Market size and forecast 2025-2030 ($ million)
Data Table on Drug stores - Market size and forecast 2025-2030 ($ million)
Chart on Drug stores - Year-over-year growth 2025-2030 (%)
Data Table on Drug stores - Year-over-year growth 2025-2030 (%)

9.6 Others - Market size and forecast 2025-2030

Chart on Others - Market size and forecast 2025-2030 ($ million)
Data Table on Others - Market size and forecast 2025-2030 ($ million)
Chart on Others - Year-over-year growth 2025-2030 (%)
Data Table on Others - Year-over-year growth 2025-2030 (%)

9.7 Market opportunity by Distribution Channel

Market opportunity by Distribution Channel ($ million)
Data Table on Market opportunity by Distribution Channel ($ million)

10. Market Segmentation by Product Type

10.1 Market segments

Chart on Product Type - Market share 2025-2030 (%)
Data Table on Product Type - Market share 2025-2030 (%)

10.2 Comparison by Product Type

Chart on Comparison by Product Type
Data Table on Comparison by Product Type

10.3 Animal-based protein bars - Market size and forecast 2025-2030

Chart on Animal-based protein bars - Market size and forecast 2025-2030 ($ million)
Data Table on Animal-based protein bars - Market size and forecast 2025-2030 ($ million)
Chart on Animal-based protein bars - Year-over-year growth 2025-2030 (%)
Data Table on Animal-based protein bars - Year-over-year growth 2025-2030 (%)

10.4 Plant-based protein bars - Market size and forecast 2025-2030

Chart on Plant-based protein bars - Market size and forecast 2025-2030 ($ million)
Data Table on Plant-based protein bars - Market size and forecast 2025-2030 ($ million)
Chart on Plant-based protein bars - Year-over-year growth 2025-2030 (%)
Data Table on Plant-based protein bars - Year-over-year growth 2025-2030 (%)

10.5 Market opportunity by Product Type

Market opportunity by Product Type ($ million)
Data Table on Market opportunity by Product Type ($ million)

11. Customer Landscape

11.1 Customer landscape overview

Analysis of price sensitivity, lifecycle, customer purchase basket, adoption rates, and purchase criteria

12. Geographic Landscape

12.1 Geographic segmentation

Chart on Market share by geography 2025-2030 (%)
Data Table on Market share by geography 2025-2030 (%)

12.2 Geographic comparison

Chart on Geographic comparison
Data Table on Geographic comparison

12.3 North America - Market size and forecast 2025-2030

Chart on North America - Market size and forecast 2025-2030 ($ million)
Data Table on North America - Market size and forecast 2025-2030 ($ million)
Chart on North America - Year-over-year growth 2025-2030 (%)
Data Table on North America - Year-over-year growth 2025-2030 (%)
Chart on Regional Comparison - North America
Data Table on Regional Comparison - North America

12.3.1 US - Market size and forecast 2025-2030

Chart on US - Market size and forecast 2025-2030 ($ million)
Data Table on US - Market size and forecast 2025-2030 ($ million)
Chart on US - Year-over-year growth 2025-2030 (%)
Data Table on US - Year-over-year growth 2025-2030 (%)

12.3.2 Canada - Market size and forecast 2025-2030

Chart on Canada - Market size and forecast 2025-2030 ($ million)
Data Table on Canada - Market size and forecast 2025-2030 ($ million)
Chart on Canada - Year-over-year growth 2025-2030 (%)
Data Table on Canada - Year-over-year growth 2025-2030 (%)

12.3.3 Mexico - Market size and forecast 2025-2030

Chart on Mexico - Market size and forecast 2025-2030 ($ million)
Data Table on Mexico - Market size and forecast 2025-2030 ($ million)
Chart on Mexico - Year-over-year growth 2025-2030 (%)
Data Table on Mexico - Year-over-year growth 2025-2030 (%)

12.4 Europe - Market size and forecast 2025-2030

Chart on Europe - Market size and forecast 2025-2030 ($ million)
Data Table on Europe - Market size and forecast 2025-2030 ($ million)
Chart on Europe - Year-over-year growth 2025-2030 (%)
Data Table on Europe - Year-over-year growth 2025-2030 (%)
Chart on Regional Comparison - Europe
Data Table on Regional Comparison - Europe

12.4.1 Germany - Market size and forecast 2025-2030

Chart on Germany - Market size and forecast 2025-2030 ($ million)
Data Table on Germany - Market size and forecast 2025-2030 ($ million)
Chart on Germany - Year-over-year growth 2025-2030 (%)
Data Table on Germany - Year-over-year growth 2025-2030 (%)

12.4.2 UK - Market size and forecast 2025-2030

Chart on UK - Market size and forecast 2025-2030 ($ million)
Data Table on UK - Market size and forecast 2025-2030 ($ million)
Chart on UK - Year-over-year growth 2025-2030 (%)
Data Table on UK - Year-over-year growth 2025-2030 (%)

12.4.3 France - Market size and forecast 2025-2030

Chart on France - Market size and forecast 2025-2030 ($ million)
Data Table on France - Market size and forecast 2025-2030 ($ million)
Chart on France - Year-over-year growth 2025-2030 (%)
Data Table on France - Year-over-year growth 2025-2030 (%)

12.4.4 Italy - Market size and forecast 2025-2030

Chart on Italy - Market size and forecast 2025-2030 ($ million)
Data Table on Italy - Market size and forecast 2025-2030 ($ million)
Chart on Italy - Year-over-year growth 2025-2030 (%)
Data Table on Italy - Year-over-year growth 2025-2030 (%)

12.4.5 Spain - Market size and forecast 2025-2030

Chart on Spain - Market size and forecast 2025-2030 ($ million)
Data Table on Spain - Market size and forecast 2025-2030 ($ million)
Chart on Spain - Year-over-year growth 2025-2030 (%)
Data Table on Spain - Year-over-year growth 2025-2030 (%)

12.4.6 The Netherlands - Market size and forecast 2025-2030

Chart on The Netherlands - Market size and forecast 2025-2030 ($ million)
Data Table on The Netherlands - Market size and forecast 2025-2030 ($ million)
Chart on The Netherlands - Year-over-year growth 2025-2030 (%)
Data Table on The Netherlands - Year-over-year growth 2025-2030 (%)

12.5 APAC - Market size and forecast 2025-2030

Chart on APAC - Market size and forecast 2025-2030 ($ million)
Data Table on APAC - Market size and forecast 2025-2030 ($ million)
Chart on APAC - Year-over-year growth 2025-2030 (%)
Data Table on APAC - Year-over-year growth 2025-2030 (%)
Chart on Regional Comparison - APAC
Data Table on Regional Comparison - APAC

12.5.1 China - Market size and forecast 2025-2030

Chart on China - Market size and forecast 2025-2030 ($ million)
Data Table on China - Market size and forecast 2025-2030 ($ million)
Chart on China - Year-over-year growth 2025-2030 (%)
Data Table on China - Year-over-year growth 2025-2030 (%)

12.5.2 Japan - Market size and forecast 2025-2030

Chart on Japan - Market size and forecast 2025-2030 ($ million)
Data Table on Japan - Market size and forecast 2025-2030 ($ million)
Chart on Japan - Year-over-year growth 2025-2030 (%)
Data Table on Japan - Year-over-year growth 2025-2030 (%)

12.5.3 India - Market size and forecast 2025-2030

Chart on India - Market size and forecast 2025-2030 ($ million)
Data Table on India - Market size and forecast 2025-2030 ($ million)
Chart on India - Year-over-year growth 2025-2030 (%)
Data Table on India - Year-over-year growth 2025-2030 (%)

12.5.4 South Korea - Market size and forecast 2025-2030

Chart on South Korea - Market size and forecast 2025-2030 ($ million)
Data Table on South Korea - Market size and forecast 2025-2030 ($ million)
Chart on South Korea - Year-over-year growth 2025-2030 (%)
Data Table on South Korea - Year-over-year growth 2025-2030 (%)

12.5.5 Indonesia - Market size and forecast 2025-2030

Chart on Indonesia - Market size and forecast 2025-2030 ($ million)
Data Table on Indonesia - Market size and forecast 2025-2030 ($ million)
Chart on Indonesia - Year-over-year growth 2025-2030 (%)
Data Table on Indonesia - Year-over-year growth 2025-2030 (%)

12.5.6 Australia - Market size and forecast 2025-2030

Chart on Australia - Market size and forecast 2025-2030 ($ million)
Data Table on Australia - Market size and forecast 2025-2030 ($ million)
Chart on Australia - Year-over-year growth 2025-2030 (%)
Data Table on Australia - Year-over-year growth 2025-2030 (%)

12.6 South America - Market size and forecast 2025-2030

Chart on South America - Market size and forecast 2025-2030 ($ million)
Data Table on South America - Market size and forecast 2025-2030 ($ million)
Chart on South America - Year-over-year growth 2025-2030 (%)
Data Table on South America - Year-over-year growth 2025-2030 (%)
Chart on Regional Comparison - South America
Data Table on Regional Comparison - South America

12.6.1 Brazil - Market size and forecast 2025-2030

Chart on Brazil - Market size and forecast 2025-2030 ($ million)
Data Table on Brazil - Market size and forecast 2025-2030 ($ million)
Chart on Brazil - Year-over-year growth 2025-2030 (%)
Data Table on Brazil - Year-over-year growth 2025-2030 (%)

12.6.2 Argentina - Market size and forecast 2025-2030

Chart on Argentina - Market size and forecast 2025-2030 ($ million)
Data Table on Argentina - Market size and forecast 2025-2030 ($ million)
Chart on Argentina - Year-over-year growth 2025-2030 (%)
Data Table on Argentina - Year-over-year growth 2025-2030 (%)

12.6.3 Colombia - Market size and forecast 2025-2030

Chart on Colombia - Market size and forecast 2025-2030 ($ million)
Data Table on Colombia - Market size and forecast 2025-2030 ($ million)
Chart on Colombia - Year-over-year growth 2025-2030 (%)
Data Table on Colombia - Year-over-year growth 2025-2030 (%)

12.7 Middle East and Africa - Market size and forecast 2025-2030

Chart on Middle East and Africa - Market size and forecast 2025-2030 ($ million)
Data Table on Middle East and Africa - Market size and forecast 2025-2030 ($ million)
Chart on Middle East and Africa - Year-over-year growth 2025-2030 (%)
Data Table on Middle East and Africa - Year-over-year growth 2025-2030 (%)
Chart on Regional Comparison - Middle East and Africa
Data Table on Regional Comparison - Middle East and Africa

12.7.1 UAE - Market size and forecast 2025-2030

Chart on UAE - Market size and forecast 2025-2030 ($ million)
Data Table on UAE - Market size and forecast 2025-2030 ($ million)
Chart on UAE - Year-over-year growth 2025-2030 (%)
Data Table on UAE - Year-over-year growth 2025-2030 (%)

12.7.2 Saudi Arabia - Market size and forecast 2025-2030

Chart on Saudi Arabia - Market size and forecast 2025-2030 ($ million)
Data Table on Saudi Arabia - Market size and forecast 2025-2030 ($ million)
Chart on Saudi Arabia - Year-over-year growth 2025-2030 (%)
Data Table on Saudi Arabia - Year-over-year growth 2025-2030 (%)

12.7.3 South Africa - Market size and forecast 2025-2030

Chart on South Africa - Market size and forecast 2025-2030 ($ million)
Data Table on South Africa - Market size and forecast 2025-2030 ($ million)
Chart on South Africa - Year-over-year growth 2025-2030 (%)
Data Table on South Africa - Year-over-year growth 2025-2030 (%)

12.7.4 Egypt - Market size and forecast 2025-2030

Chart on Egypt - Market size and forecast 2025-2030 ($ million)
Data Table on Egypt - Market size and forecast 2025-2030 ($ million)
Chart on Egypt - Year-over-year growth 2025-2030 (%)
Data Table on Egypt - Year-over-year growth 2025-2030 (%)

12.7.5 Israel - Market size and forecast 2025-2030

Chart on Israel - Market size and forecast 2025-2030 ($ million)
Data Table on Israel - Market size and forecast 2025-2030 ($ million)
Chart on Israel - Year-over-year growth 2025-2030 (%)
Data Table on Israel - Year-over-year growth 2025-2030 (%)

12.8 Market opportunity by geography

Market opportunity by geography ($ million)
Data Tables on Market opportunity by geography ($ million)

13. Drivers, Challenges, and Opportunity

13.1 Market drivers

Escalating consumer focus on health and wellness
Rising demand for convenient and portable nutrition
Intensified product innovation and ingredient diversification

13.2 Market challenges

Intense market saturation and aggressive price competition
Navigating complex regulatory landscapes and health claim substantiation
Managing supply chain volatility and complex ingredient sourcing

13.3 Impact of drivers and challenges

Impact of drivers and challenges in 2025 and 2030

13.4 Market opportunities

Ascendancy of plant-based proteins and clean-label imperatives
Product diversification through functional ingredients and holistic wellness
Hyper-personalization and sophisticated sensory experiences

14. Competitive Landscape

14.1 Overview

14.2

Overview on criticality of inputs and factors of differentiation

14.3 Landscape disruption

Overview on factors of disruption

14.4 Industry risks

Impact of key risks on business

15. Competitive Analysis

15.1 Companies profiled

Companies covered

15.2 Company ranking index

15.3 Market positioning of companies

Matrix on companies position and classification

15.4 Barebells Functional Foods AB

Barebells Functional Foods AB - Overview
Barebells Functional Foods AB - Product / Service
Barebells Functional Foods AB - Key offerings
SWOT

15.5 Built Brands LLC

Built Brands LLC - Overview
Built Brands LLC - Product / Service
Built Brands LLC - Key offerings
SWOT

15.6 Bulletproof 360 Inc.

Bulletproof 360 Inc. - Overview
Bulletproof 360 Inc. - Product / Service
Bulletproof 360 Inc. - Key offerings
SWOT

15.7 Clif Bar and Co.

Clif Bar and Co. - Overview
Clif Bar and Co. - Product / Service
Clif Bar and Co. - Key offerings
SWOT

15.8 Danone SA

Danone SA - Overview
Danone SA - Business segments
Danone SA - Key news
Danone SA - Key offerings
Danone SA - Segment focus
SWOT

15.9 FULFIL Nutrition Ltd.

FULFIL Nutrition Ltd. - Overview
FULFIL Nutrition Ltd. - Product / Service
FULFIL Nutrition Ltd. - Key offerings
SWOT

15.10 GoMacro LLC

GoMacro LLC - Overview
GoMacro LLC - Product / Service
GoMacro LLC - Key offerings
SWOT

15.11 Kellanova

Kellanova - Overview
Kellanova - Business segments
Kellanova - Key offerings
Kellanova - Segment focus
SWOT

15.12 Kind LLC

Kind LLC - Overview
Kind LLC - Product / Service
Kind LLC - Key offerings
SWOT

15.13 ONE Brands

ONE Brands - Overview
ONE Brands - Product / Service
ONE Brands - Key offerings
SWOT

15.14 Optimum Nutrition Inc.

Optimum Nutrition Inc. - Overview
Optimum Nutrition Inc. - Product / Service
Optimum Nutrition Inc. - Key offerings
SWOT

15.15 Orgain Inc.

Orgain Inc. - Overview
Orgain Inc. - Product / Service
Orgain Inc. - Key offerings
SWOT

15.16 PepsiCo Inc.

PepsiCo Inc. - Overview
PepsiCo Inc. - Business segments
PepsiCo Inc. - Key news
PepsiCo Inc. - Key offerings
PepsiCo Inc. - Segment focus
SWOT

15.17 Quest Nutrition LLC

Quest Nutrition LLC - Overview
Quest Nutrition LLC - Product / Service
Quest Nutrition LLC - Key offerings
SWOT

15.18 THG Plc

THG Plc - Overview
THG Plc - Business segments
THG Plc - Key offerings
THG Plc - Segment focus
SWOT

16. Appendix

16.1 Scope of the report

Market definition
Objectives
Notes and caveats

16.2 Inclusions and exclusions checklist

Inclusions checklist
Exclusions checklist

16.3 Currency conversion rates for US$

16.4 Research methodology

16.5 Data procurement

Information sources

16.6 Data validation

16.7 Validation techniques employed for market sizing

16.8 Data synthesis

16.9 360 degree market analysis

16.10 List of abbreviations

Research Methodology

Technavio presents a detailed picture of the market by way of study, synthesis, and summation of data from multiple sources. The analysts have presented the various facets of the market with a particular focus on identifying the key industry influencers. The data thus presented is comprehensive, reliable, and the result of extensive research, both primary and secondary.

INFORMATION SOURCES

Primary sources

  • Manufacturers and suppliers
  • Channel partners
  • Industry experts
  • Strategic decision makers

Secondary sources

  • Industry journals and periodicals
  • Government data
  • Financial reports of key industry players
  • Historical data
  • Press releases

DATA ANALYSIS

Data Synthesis

  • Collation of data
  • Estimation of key figures
  • Analysis of derived insights

Data Validation

  • Triangulation with data models
  • Reference against proprietary databases
  • Corroboration with industry experts

REPORT WRITING

Qualitative

  • Market drivers
  • Market challenges
  • Market trends
  • Five forces analysis

Quantitative

  • Market size and forecast
  • Market segmentation
  • Geographical insights
  • Competitive landscape

Interested in this report?

Get your sample now to see our research methodology and insights!

Download Now

Frequently Asked Questions

Protein Bar market growth will increase by USD 2494.4 million during 2026-2030.

The Protein Bar market is expected to grow at a CAGR of 8.4% during 2026-2030.

Protein Bar market is segmented by Type (Medium protein bar, Low protein bar, High protein bar) Distribution channel (Supermarkets and hypermarkets, Convenience stores, Drug stores, Others) Product type (Animal-based protein bars, Plant-based protein bars)

Aloha, Barebells Functional Foods AB, Built Brands LLC, Bulletproof 360 Inc., Clif Bar and Co., Danone SA, FITCRUNCH, FULFIL Nutrition Ltd., GoMacro LLC, Kellanova, Kind LLC, No Cow Inc., NuGo Nutrition, ONE Brands, Optimum Nutrition Inc., Orgain Inc., PepsiCo Inc., PROBAR Inc., Quest Nutrition LLC, THG Plc are a few of the key vendors in the Protein Bar market.

North America will register the highest growth rate of 40.2% among the other regions. Therefore, the Protein Bar market in North America is expected to garner significant business opportunities for the vendors during the forecast period.

US, Canada, Mexico, Germany, UK, France, Italy, Spain, The Netherlands, China, Japan, India, South Korea, Indonesia, Australia, Brazil, Argentina, Colombia, UAE, Saudi Arabia, South Africa, Egypt, Israel

  • Escalating consumer focus on health and wellness is the driving factor this market.

The Protein Bar market vendors should focus on grabbing business opportunities from the Type segment as it accounted for the largest market share in the base year.
RIA - Research AI Assistant
Ask RIA