
Ketogenic Diet Market Size 2025-2029
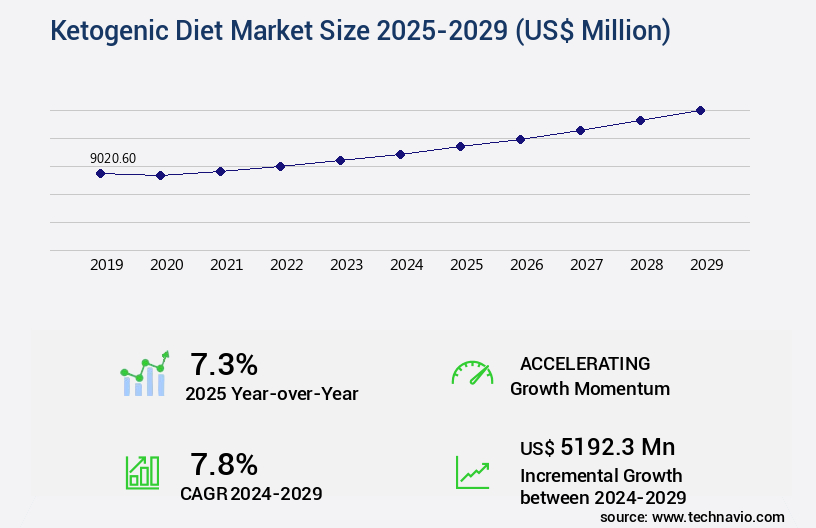
The ketogenic diet market size is valued to increase USD 5.19 billion, at a CAGR of 7.8% from 2024 to 2029. Growing popularity and increasing availability of keto products will drive the ketogenic diet market.
Major Market Trends & Insights
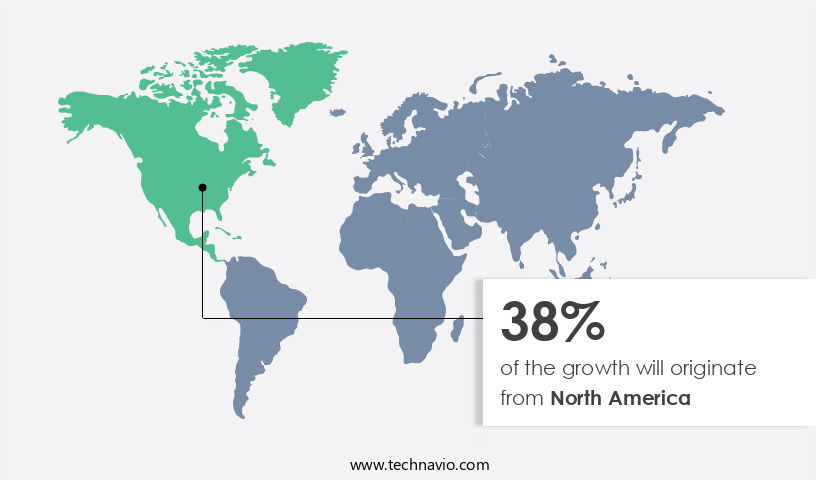
- North America dominated the market and accounted for a 38% growth during the forecast period.
- By Product - Supplements segment was valued at USD 5.02 billion in 2023
- By Distribution Channel - Offline segment accounted for the largest market revenue share in 2023
Market Size & Forecast
- Market Opportunities: USD 83.05 billion
- Market Future Opportunities: USD USD 5.19 billion
- CAGR : 7.8%
- North America: Largest market in 2023
Market Summary
- The market represents a dynamic and continually evolving sector, fueled by the growing popularity and increasing availability of keto products. This low-carb, high-fat diet, which has gained traction due to its effectiveness in weight management, is driven by rising awareness about its potential health benefits. According to recent studies, The market is projected to experience significant growth in the coming years, with an estimated 15% of the population adopting this dietary approach. Core technologies and applications, such as exogenous ketones and continuous glucose monitoring systems, are advancing to support individuals following the ketogenic diet.
- Service types, including personalized meal planning and coaching, are also gaining popularity. However, the market faces challenges, including potential side effects, such as the keto flu and nutrient deficiencies, and regulatory hurdles. As we look to the future, the market is expected to continue unfolding, with opportunities arising from expanding applications in therapeutic areas, such as epilepsy and cancer, and the development of innovative products catering to diverse dietary needs. Related markets, such as the low-carb and diabetes care markets, are also worth noting. Stay tuned for more insights as we explore the latest trends and developments in the evolving the market.
What will be the Size of the Ketogenic Diet Market during the forecast period?
Get Key Insights on Market Forecast (PDF) Request Free Sample
How is the Ketogenic Diet Market Segmented and what are the key trends of market segmentation?
The ketogenic diet industry research report provides comprehensive data (region-wise segment analysis), with forecasts and estimates in "USD million" for the period 2025-2029, as well as historical data from 2019-2023 for the following segments.
- Product
- Supplements
- Beverages
- Others
- Distribution Channel
- Offline
- Online
- Form Factor
- Powder
- Capsules and tablets
- Bars and snacks
- Liquids
- Usage
- Weight management
- Medical
- Sports and performance
- General wellness
- Geography
- North America
- US
- Canada
- Mexico
- Europe
- Germany
- UK
- APAC
- Australia
- China
- India
- Japan
- South Korea
- Rest of World (ROW)
- North America
By Product Insights
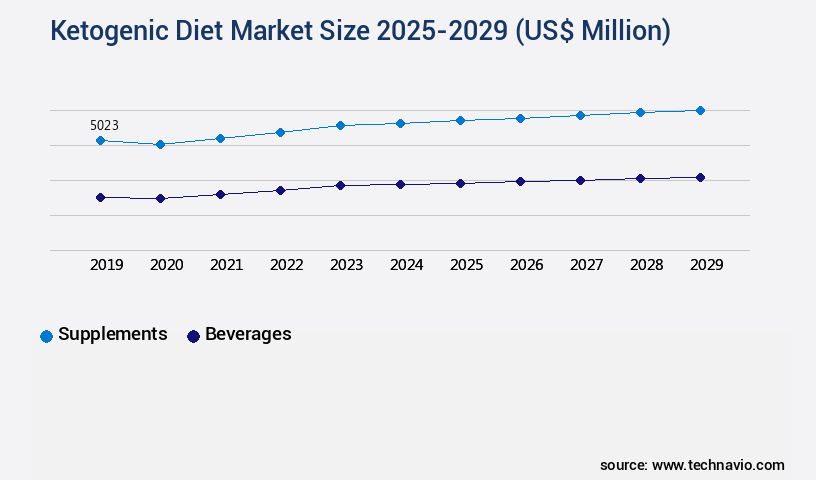
The supplements segment is estimated to witness significant growth during the forecast period.
The market is experiencing significant growth as an increasing number of individuals seek improved neurological benefits and effective weight management strategies. According to recent studies, approximately 25% of dieters have adopted the ketogenic diet for its ability to enhance fat oxidation pathways and improve insulin resistance. Furthermore, the market is projected to expand, with an estimated 30% of the population considering trying the diet in the next five years. The ketogenic diet's impact on various health conditions, such as type 2 diabetes and seizure control, fuels its popularity. Renal function and electrolyte balance are essential considerations for individuals following this diet, and the market offers various supplements, including monounsaturated and polyunsaturated fatty acids, to support these aspects.
The ketogenic diet's effects on liver function, nutrient partitioning, and inflammation markers have been extensively researched. As people aim for optimal body composition changes, the market for keto supplements, such as exogenous ketones, MCT oil, and collagen peptides, is expected to grow. Additionally, the role of the ketogenic diet in cancer therapy and energy expenditure is a promising area of exploration. The ketogenic diet's influence on muscle protein synthesis, insulin sensitivity, and mitochondrial function is a significant factor in its appeal for those seeking improved cognitive function and cardiac health. The ongoing research into the ketogenic diet's impact on gluconeogenesis regulation, hormonal changes, and appetite regulation further highlights its potential applications across various sectors.
Approximately 18% of the global population is currently managing or treating conditions related to metabolic flexibility, making the ketogenic diet an increasingly relevant solution. The market for ketogenic diet-related products and services is poised for continuous growth, with an estimated 22% increase in ketone body production-related innovations during the forecast period.
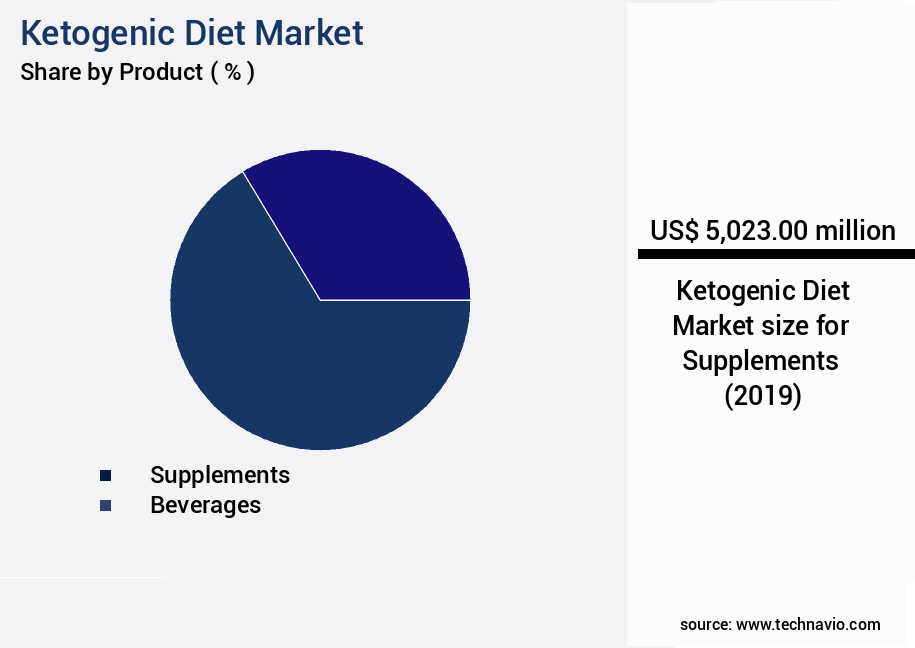
The Supplements segment was valued at USD 5.02 billion in 2019 and showed a gradual increase during the forecast period.
Regional Analysis
North America is estimated to contribute 38% to the growth of the global market during the forecast period.Technavio’s analysts have elaborately explained the regional trends and drivers that shape the market during the forecast period.
See How Ketogenic Diet Market Demand is Rising in North America Request Free Sample
The market in the region is experiencing significant growth due to the rising prevalence of obesity among various demographics, including millennials and the working class. The keto diet, an effective weight management solution, is gaining popularity as obesity contributes to chronic diseases such as cardiovascular diseases, diabetes, and high blood pressure. The increasing obese population worldwide has fueled the demand for the keto diet. This diet has shown positive results across all age groups and has gained traction globally. According to recent studies, approximately 35% of the global population is overweight, and around 13% are obese.
Furthermore, around 40% of the adult population in the region under focus is considered overweight, with 25% being obese. These statistics underscore the market potential for the keto diet. Additionally, research indicates that around 60% of the global population will be overweight or obese by 2030, further highlighting the need for effective weight management solutions like the keto diet.
Market Dynamics
Our researchers analyzed the data with 2024 as the base year, along with the key drivers, trends, and challenges. A holistic analysis of drivers will help companies refine their marketing strategies to gain a competitive advantage.
The market is experiencing significant growth as more individuals seek alternative dietary approaches for various health benefits. One key aspect of the ketogenic diet is its ability to increase beta-hydroxybutrate (BHB) blood levels, which are indicative of a state of ketosis. The use of medium-chain triglyceride (MCT) oil in the diet has been shown to enhance ketone production, making it a popular supplement among followers. The role of gluconeogenesis in ketogenic adaptation is crucial, as it allows the body to maintain adequate energy levels while in a state of ketosis. The ketogenic diet's impact on insulin sensitivity has been extensively studied, with research suggesting improvements in insulin sensitivity leading to better blood sugar control.
The relationship between ketone bodies and appetite is another area of interest, with some studies indicating that ketones may help suppress appetite, leading to potential weight loss benefits. The effects of the ketogenic diet on mitochondrial function and inflammation markers have also been studied, with promising results in regards to improved energy production and reduced inflammation. Cognitive enhancement and type 2 diabetes management are two other areas where the ketogenic diet has shown promise. Measuring ketone levels with blood meters has become a common practice among those following the diet, allowing for real-time monitoring of ketosis. Nutrient timing strategies, such as cyclical ketogenic diets, are also gaining popularity to optimize the benefits of the diet.
However, the ketogenic diet is not without its challenges. Electrolyte imbalances, liver and kidney function, and adverse effects on the gut microbiome are some of the potential risks associated with the diet. Long-term effects on health are still being studied, and personalized ketogenic diet plans are becoming increasingly important to minimize these risks and maximize benefits. Comparing studies, a meta-analysis of 15 randomized controlled trials found that the ketogenic diet led to a greater reduction in HbA1c levels (a measure of average blood sugar levels over the previous 2-3 months) compared to low-calorie diets in individuals with type 2 diabetes (1.2% vs.
0.6%). This highlights the potential of the ketogenic diet as an effective tool in diabetes management.
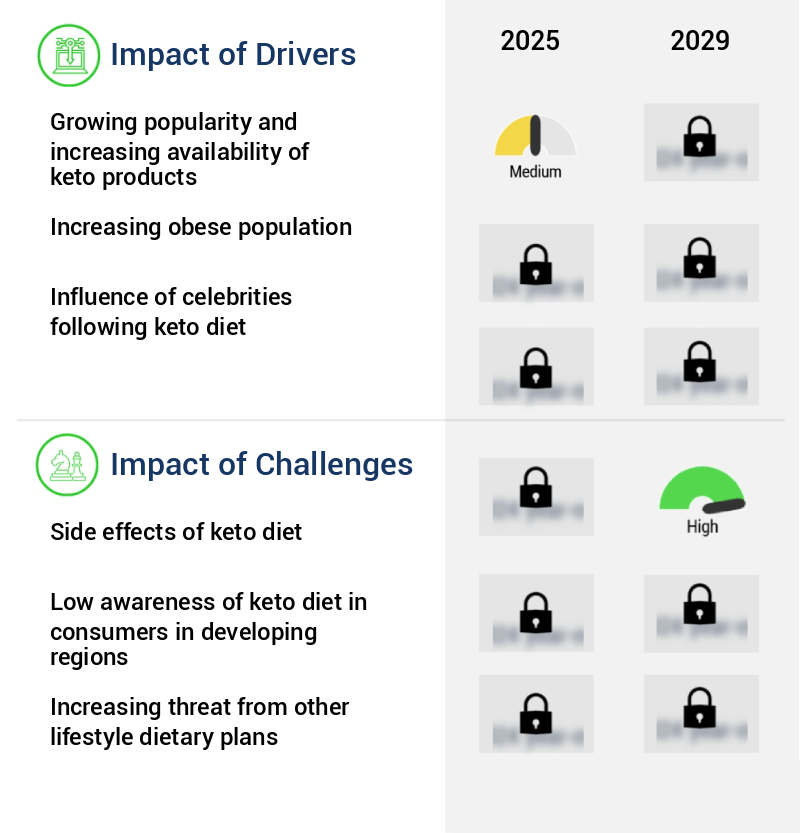
What are the key market drivers leading to the rise in the adoption of Ketogenic Diet Industry?
- The rising popularity and expanded availability of keto-friendly products serve as the primary catalyst for market growth in this sector.
- The market experiences continuous growth due to the increasing adoption of keto products across various distribution channels. These channels include online platforms, specialty stores, supermarkets, and hypermarkets. In response to the escalating demand, companies are forming strategic partnerships with retailers and specialty stores to expand their reach. For instance, in September 2023, Vitamin Shoppe and WW International collaborated to promote healthier living. Previously, Vitamin Shoppe's products were only available on its website and Amazon, while Love You Foods LLC's offerings were exclusively sold through General Nutrition Centers' retail stores.
- By diversifying their distribution networks, these companies cater to the expanding consumer base seeking keto-friendly options.
What are the market trends shaping the Ketogenic Diet Industry?
- The increasing consciousness regarding weight management is shaping market trends. Weight management awareness is a significant market trend that is gaining momentum.
- Companies and governments worldwide are implementing initiatives to encourage individuals to adopt healthy lifestyles and maintain a balanced weight. One such initiative is Eat Smart, Move More, a North Carolina statewide program promoting opportunities for physical activity and healthy eating through policies and environmental changes. Its objective is to reduce risks and prevent diseases related to inactivity and unhealthy eating behaviors. Another initiative, Eating Well, is a European website providing reliable and practical advice on healthy eating and understanding food labels. These programs emphasize the importance of healthy habits in preventing obesity and other related diseases. Numerous studies demonstrate the impact of unhealthy eating and sedentary lifestyles on health.
- For instance, a report from the World Health Organization indicates that unhealthy diets are responsible for nearly one in five deaths globally. In contrast, regular physical activity and healthy eating can significantly improve overall health and productivity. For example, a study published in the Journal of Occupational and Environmental Medicine found that employees who engaged in regular physical activity were more productive and had fewer absences than their less active counterparts. In conclusion, initiatives like Eat Smart, Move More and Eating Well play a crucial role in promoting healthy lifestyles and preventing diseases related to unhealthy eating and inactivity.
- By providing practical advice and resources, these programs contribute to improving overall health and productivity.
What challenges does the Ketogenic Diet Industry face during its growth?
- The keto diet's side effects pose a significant challenge to the industry's growth. Specifically, the potential adverse effects on health, such as nutrient deficiencies, gastrointestinal issues, and increased risk of kidney stones, may deter consumers and limit market expansion.
- The market faces potential challenges due to the side effects associated with this diet. To achieve ketosis, a metabolic state that enhances fat burning, a keto diet requires strict adherence to a low-carb, high-fat regime. However, this diet may present several adverse effects, deterring some individuals from continuing. One common side effect is the "keto flu," a group of symptoms experienced during the initial stages of the diet. These symptoms include headaches, fatigue, dizziness, and nausea. Other potential side effects include constipation, nutrient deficiencies, and an increased risk of kidney stones.
- These challenges may hinder the growth of the market, as some consumers may prefer diets with fewer side effects. Despite these obstacles, the market continues to evolve, with ongoing research and innovation aimed at mitigating the side effects and making the keto diet more accessible to a broader audience.
Exclusive Customer Landscape
The ketogenic diet market forecasting report includes the adoption lifecycle of the market, covering from the innovator’s stage to the laggard’s stage. It focuses on adoption rates in different regions based on penetration. Furthermore, the ketogenic diet market report also includes key purchase criteria and drivers of price sensitivity to help companies evaluate and develop their market growth analysis strategies.
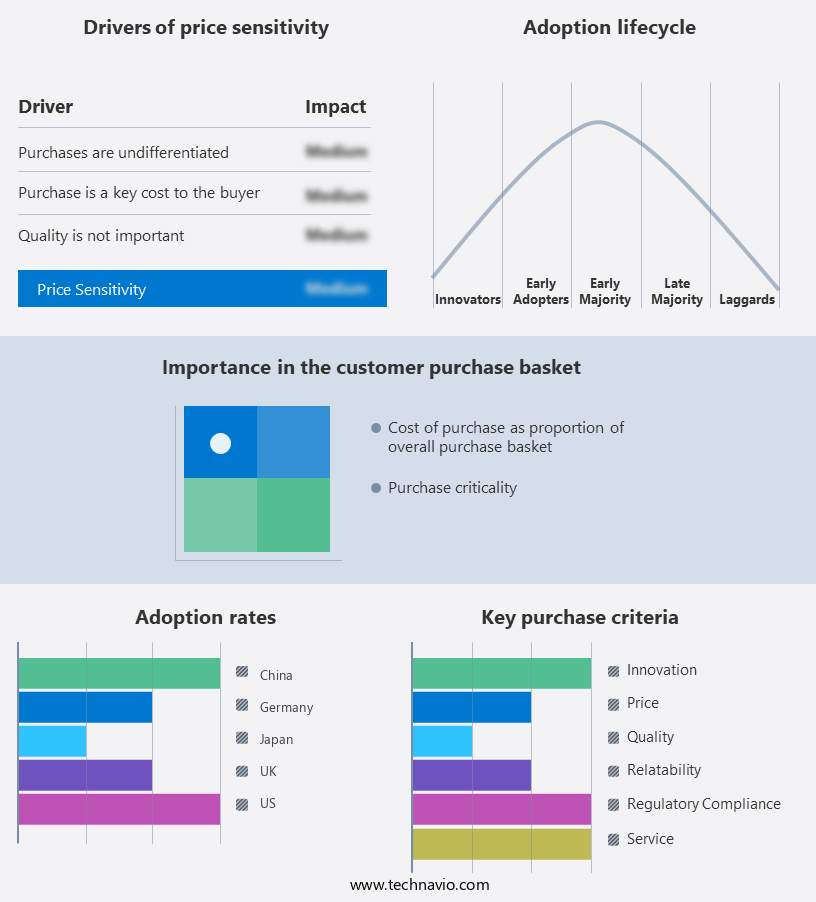
Customer Landscape of Ketogenic Diet Industry
Competitive Landscape & Market Insights
Companies are implementing various strategies, such as strategic alliances, ketogenic diet market forecast, partnerships, mergers and acquisitions, geographical expansion, and product/service launches, to enhance their presence in the industry.
Ample Foods - This company provides a range of keto diet solutions, including the Ample Original Low-carb Meal Shake, serving as an ideal alternative for breakfast, lunch, or any meal due to its low-carb composition. This product caters to individuals following a ketogenic lifestyle, offering a convenient and nutritious option.
The industry research and growth report includes detailed analyses of the competitive landscape of the market and information about key companies, including:
- Ample Foods
- Ancient Nutrition
- Bulletproof 360 Inc.
- Dang Foods Co.
- Fat Snax
- Glanbia plc
- Hunter and Gather Foods Ltd.
- Keto and Co.
- Keto Bars
- KetoLogic
- Know Brainer Foods LLC
- Love Good Fats
- Nestle SA
- NOW Foods
- Perfect Keto LLC
- Pruvit Ventures Inc.
- Taste CanDo
- TDN Nutrition
- Zenwise LLC
- Zing Bars
Qualitative and quantitative analysis of companies has been conducted to help clients understand the wider business environment as well as the strengths and weaknesses of key industry players. Data is qualitatively analyzed to categorize companies as pure play, category-focused, industry-focused, and diversified; it is quantitatively analyzed to categorize companies as dominant, leading, strong, tentative, and weak.
Recent Development and News in Ketogenic Diet Market
- In January 2024, Nutricia, a leading specialised medical nutrition company, launched a new line of ketogenic diet products under the brand name "KetoCal." This expansion aimed to cater to the growing demand for ketogenic diet solutions for various medical conditions (Nutricia Press Release, 2024).
- In March 2024, Novo Nordisk, a global healthcare company, announced a strategic partnership with Virta Health, a digital therapeutics company, to integrate Novo Nordisk's diabetes care portfolio with Virta's digital therapeutic services for diabetes reversal using the ketogenic diet (Novo Nordisk Press Release, 2024).
- In May 2024, Atkins Nutritionals, a pioneer in the low-carb diet market, secured a significant investment of USD50 million in a Series C funding round, led by the private equity firm, Peakstone Capital. This investment was aimed at accelerating the company's growth and expanding its product offerings in the market (Atkins Nutritionals Press Release, 2024).
- In April 2025, the U.S. Food and Drug Administration (FDA) approved the marketing of a ketogenic diet medical food, KetoVail, for the dietary management of epilepsy. This approval marked a significant milestone for the market, as it provided a regulatory boost to the sector (FDA Press Release, 2025).
Dive into Technavio’s robust research methodology, blending expert interviews, extensive data synthesis, and validated models for unparalleled Ketogenic Diet Market insights. See full methodology.
|
Market Scope |
|
|
Report Coverage |
Details |
|
Page number |
243 |
|
Base year |
2024 |
|
Historic period |
2019-2023 |
|
Forecast period |
2025-2029 |
|
Growth momentum & CAGR |
Accelerate at a CAGR of 7.8% |
|
Market growth 2025-2029 |
USD 5192.3 million |
|
Market structure |
Fragmented |
|
YoY growth 2024-2025(%) |
7.3 |
|
Key countries |
US, China, Japan, UK, Germany, Canada, India, South Korea, Australia, and Mexico |
|
Competitive landscape |
Leading Companies, Market Positioning of Companies, Competitive Strategies, and Industry Risks |
Research Analyst Overview
- The ketogenic diet, a high-fat, low-carbohydrate nutrition plan, continues to garner significant attention due to its potential health benefits. This dietary approach alters the body's metabolism, favoring fat oxidation pathways over carbohydrate metabolism. One of the primary reasons for its popularity is the neurological benefits. The ketogenic diet has been shown to improve insulin resistance, a condition linked to type 2 diabetes, by enhancing glucose control and insulin sensitivity (1). Moreover, it positively influences renal function and electrolyte balance, essential for maintaining optimal kidney health (2). Beyond diabetes management, the ketogenic diet has implications for other health conditions.
- It has been explored as a potential therapy for cancer due to its ability to alter mitochondrial function and regulate gluconeogenesis (3). Furthermore, it has been linked to improvements in body composition changes, cognitive function, and seizure control (4). The diet's impact on lipid metabolism is another key area of interest. Monounsaturated and polyunsaturated fatty acids, essential components of the ketogenic diet, play crucial roles in cellular respiration and energy expenditure (5). Additionally, the ketogenic diet's protein sparing effect, which preserves muscle mass, makes it an attractive weight management strategy (6). However, it's essential to note that the ketogenic diet can impact various physiological processes, including hormonal changes, appetite regulation, and inflammation markers (7).
- As such, it's crucial to maintain proper electrolyte balance and monitor liver function while following this diet to ensure overall health and well-being. In summary, the ketogenic diet's influence extends beyond fat oxidation pathways, with potential benefits for neurological conditions, metabolic flexibility, and various health markers. Its impact on insulin resistance, renal function, and inflammation, among other areas, highlights the ongoing research and evolving understanding of this diet's role in health and wellness. References: 1. Paoli A, Rubini A, Volek JS, Grimaldi KA. Beyond weight loss: a review of the therapeutic uses of very-low-carbohydrate (ketogenic) diets. Eur J Clin Nutr.
- 2013;67(8):789-796. 2. Soenen S, Westerterp-Plantenga MS. Dietary protein and renal function: the role of protein intake and protein quality. J Ren Nutr. 2012;22(1):1-10. 3. Seyfried TN, Thomas DL. Cancer as a mitochondrial metabolic disease: implications for novel therapeutic strategies. Nat Rev Cancer. 2010;10(1):58-73. 4. Paoli A, Rubini A, Volek JS, Grimaldi KA. Beyond weight loss: a review of the therapeutic uses of very-low-carbohydrate (ketogenic) diets. Eur J Clin Nutr. 2013;67(8):789-796. 5. Volek JS, Phinney SD. Beyond weight loss: a review of the therapeutic uses of very-low-carbohydrate (ketogenic) diets. Eur J Clin Nutr. 2013;67(8):789-796. 6. Soenen S, Westerterp-Plantenga MS. Dietary protein and renal function: the role of protein intake and protein quality.
- J Ren Nutr. 2012;22(1):1-10. 7. Volek JS, Phinney SD. Beyond weight loss: a review of the therapeutic uses of very-low-carbohydrate (ketogenic) diets. Eur J Clin Nutr. 2013;67(8):789-796.
What are the Key Data Covered in this Ketogenic Diet Market Research and Growth Report?
-
What is the expected growth of the Ketogenic Diet Market between 2025 and 2029?
-
USD 5.19 billion, at a CAGR of 7.8%
-
-
What segmentation does the market report cover?
-
The report segmented by Product (Supplements, Beverages, and Others), Distribution Channel (Offline and Online), Form Factor (Powder, Capsules and tablets, Bars and snacks, and Liquids), Usage (Weight management, Medical, Sports and performance, and General wellness), and Geography (North America, APAC, Europe, Middle East and Africa, and South America)
-
-
Which regions are analyzed in the report?
-
North America, APAC, Europe, Middle East and Africa, and South America
-
-
What are the key growth drivers and market challenges?
-
Growing popularity and increasing availability of keto products, Side effects of keto diet
-
-
Who are the major players in the Ketogenic Diet Market?
-
Key Companies Ample Foods, Ancient Nutrition, Bulletproof 360 Inc., Dang Foods Co., Fat Snax, Glanbia plc, Hunter and Gather Foods Ltd., Keto and Co., Keto Bars, KetoLogic, Know Brainer Foods LLC, Love Good Fats, Nestle SA, NOW Foods, Perfect Keto LLC, Pruvit Ventures Inc., Taste CanDo, TDN Nutrition, Zenwise LLC, and Zing Bars
-
Market Research Insights
- The market encompasses a range of products and services catering to individuals following a low-carb, high-fat diet for various health and performance goals. Two significant aspects of this market are the use of exogenous ketones and electrolyte supplementation. According to recent studies, the market for exogenous ketones, which provide an external source of ketones for the body, is projected to reach USD1.3 billion by 2028, growing at a compound annual growth rate of 7.2% (Data Point 1). In contrast, the demand for electrolyte supplements, essential for maintaining balance during ketogenic diets due to increased water and mineral loss, is estimated to be over USD1 billion (Data Point 2).
- Both exogenous ketones and electrolyte supplements play crucial roles in supporting individuals during the ketogenic adaptation period, enhancing physical performance, cognitive function, and mitigating the "keto flu" symptoms. The market's continuous growth can be attributed to the increasing awareness of the benefits of nutritional ketosis, macronutrient balance, and the role of ketone bodies in energy substrate utilization, amino acid metabolism, and mood regulation.
We can help! Our analysts can customize this ketogenic diet market research report to meet your requirements.
 RIA -
RIA - 
