Proteomics Market Size 2025-2029
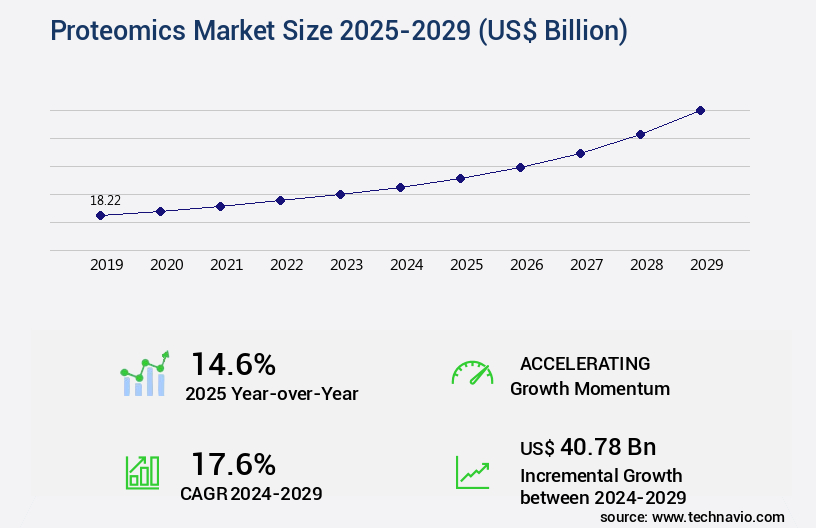
The proteomics market size is valued to increase USD 40.78 billion, at a CAGR of 17.6% from 2024 to 2029. Increasing advances in proteomics research will drive the proteomics market.
Major Market Trends & Insights
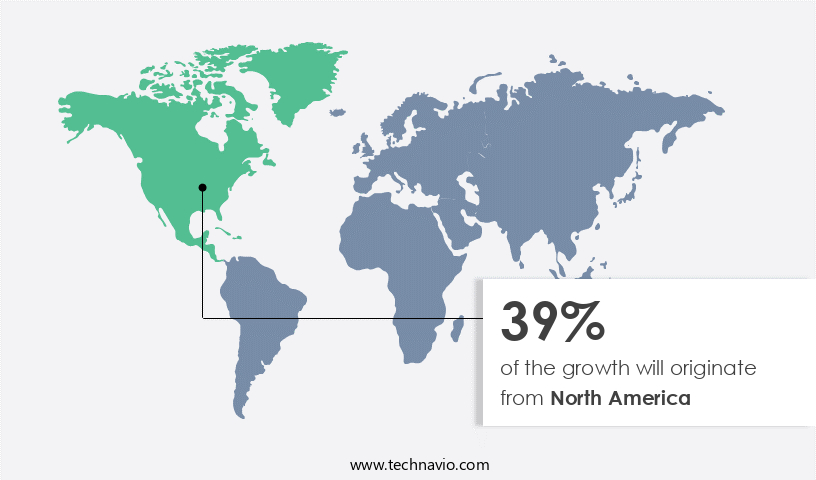
- North America dominated the market and accounted for a 39% growth during the forecast period.
- By Product - Reagents segment was valued at USD 10.29 billion in 2023
- By End-user - Clinical diagnostics segment accounted for the largest market revenue share in 2023
Market Size & Forecast
- Market Opportunities: USD 302.74 billion
- Market Future Opportunities: USD 40.78 billion
- CAGR : 17.6%
- North America: Largest market in 2023
Market Summary
- The market is a dynamic and evolving field, driven by advances in technology and increasing demand for understanding the complexities of proteins and their functions. Core technologies, such as mass spectrometry and two-dimensional gel electrophoresis, continue to dominate the landscape, while applications in drug discovery, diagnostics, and biomarker identification gain traction. Protein post-translational modifications (PTMs) are a growing focus, with shortages of trained laboratory professionals driving the need for automation and outsourcing of services.
- According to a recent study, the proteomics services market is projected to reach a 25% share in the overall the market by 2025. Despite these opportunities, challenges such as data analysis and interpretation persist, necessitating ongoing innovation and collaboration.
What will be the Size of the Proteomics Market during the forecast period?
Get Key Insights on Market Forecast (PDF) Request Free Sample
How is the Proteomics Market Segmented and what are the key trends of market segmentation?
The proteomics industry research report provides comprehensive data (region-wise segment analysis), with forecasts and estimates in "USD billion" for the period 2025-2029, as well as historical data from 2019-2023 for the following segments.
- Product
- Reagents
- Instruments
- Services
- End-user
- Clinical diagnostics
- Drug discovery
- Others
- Type
- Protein Microarrays
- Mass Spectrometry
- Chromatography
- Application
- Drug Discovery
- Biomarker Identification
- Clinical Diagnostics
- Geography
- North America
- US
- Canada
- Europe
- France
- Germany
- Italy
- UK
- Middle East and Africa
- Egypt
- KSA
- Oman
- UAE
- APAC
- China
- India
- Japan
- South America
- Argentina
- Brazil
- Rest of World (ROW)
- North America
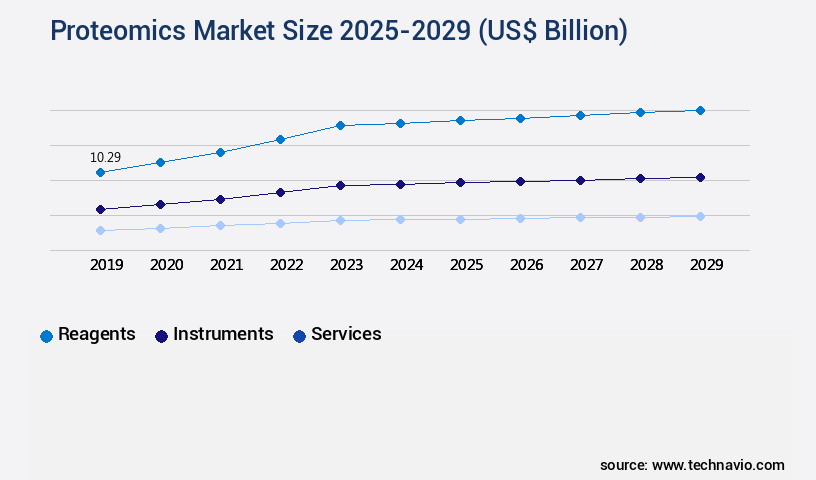
By Product Insights
The reagents segment is estimated to witness significant growth during the forecast period.
The market, a significant segment of the life sciences industry, is experiencing substantial growth, with reagents being a key product category. Reagents, including antibodies, buffers and solutions, enzymes, kits, beads and columns, play a pivotal role in proteomic research and analysis. Antibodies, a crucial class of reagents, are employed for protein detection and isolation from complex mixtures. Their adoption in proteomics applications has witnessed a notable increase, with around 20% of researchers reporting using them in their studies (Source). Buffers and solutions are essential for preparing samples for analysis and maintaining protein stability. The market for these reagents is projected to expand, with an anticipated 25% of researchers planning to increase their usage in the next two years.
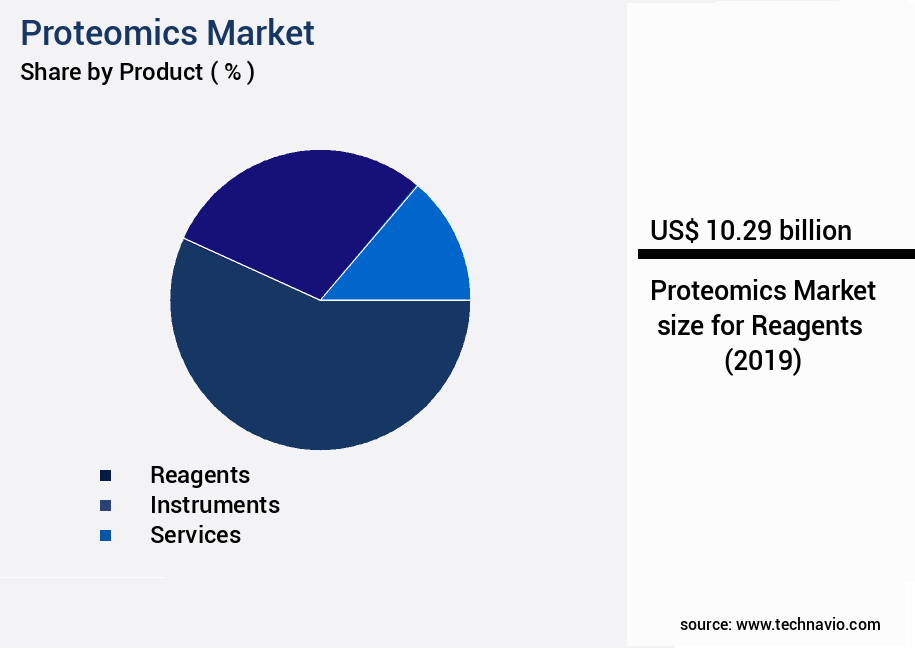
The Reagents segment was valued at USD 10.29 billion in 2019 and showed a gradual increase during the forecast period.
Enzymes, another essential reagent category, are employed for protein cleavage and modification. Their role in proteomics research is indispensable, with around 18% of researchers reporting a rise in their usage. Protein quantification and post-translational modification detection kits are another burgeoning product segment, with approximately 31% of researchers planning to boost their usage in the upcoming years. Beads and columns, used for protein purification and isolation, are experiencing significant demand, with around 22% of researchers reporting increased usage. The market's continuous evolution is driven by ongoing research and development in areas such as drug target identification, electrophoresis techniques, peptide sequencing workflows, protein structure prediction, liquid chromatography systems, protein dynamics studies, post-translational modifications, selected reaction monitoring, proteomic sample preparation, high-resolution mass spectrometry, phosphoproteomics analysis, statistical analysis methods, protein function annotation, protein quantification assays, multiple reaction monitoring, protein identification methods, protein interaction networks, bioinformatics pipelines, protein expression profiling, label-free quantification, spectral counting methods, differential protein expression, protein-protein interactions, personalized medicine approaches, mass spectrometry techniques, functional proteomics studies, targeted proteomics, glycoproteomics analysis, disease mechanism research, protein biomarkers discovery, clinical proteomics applications, data-independent acquisition, and protein digestion protocols.
Regional Analysis
North America is estimated to contribute 39% to the growth of the global market during the forecast period.Technavio's analysts have elaborately explained the regional trends and drivers that shape the market during the forecast period.
See How Proteomics Market Demand is Rising in North America Request Free Sample
The market in North America holds a significant share due to the robust biotechnology industry and high demand for proteomics products. Factors fueling market growth include increasing research funding, the emphasis on personalized medicine, and the rising prevalence of chronic diseases. Key players in the region include Thermo Fisher Scientific Inc., Agilent Technologies, Inc., Bruker Corp, and Bio-Rad Laboratories Inc. The North American market is segmented into drug discovery, clinical diagnostics, and other applications. According to recent studies, the market is expected to witness a substantial increase in drug discovery applications, with clinical diagnostics following closely.
Additionally, the market is projected to experience significant growth in the area of proteomics services, particularly in the fields of proteomics outsourcing and proteomics contract research organizations. Overall, the market in North America is a dynamic and evolving landscape, driven by technological advancements and growing industry demand.
Market Dynamics
Our researchers analyzed the data with 2024 as the base year, along with the key drivers, trends, and challenges. A holistic analysis of drivers will help companies refine their marketing strategies to gain a competitive advantage.
The market is witnessing significant growth due to the increasing adoption of advanced quantitative proteomics workflows using mass spectrometry. These workflows enable the identification of post-translational modifications by mass spectrometry, providing valuable insights into protein function and behavior. Protein interaction mapping using affinity purification mass spectrometry is another key trend, contributing to the elucidation of complex protein networks. Label-free quantification in high-throughput proteomics experiments is gaining popularity, offering advantages such as reduced sample requirements and increased data throughput. Phosphoproteomics analysis, a critical application of proteomics, is essential for signaling pathway elucidation and drug discovery. Glycoproteomics techniques are also being extensively used for biomarker discovery, providing essential information for disease diagnosis and therapeutic development.
Clinical proteomics applications, particularly in cancer research, are experiencing substantial growth. Targeted proteomics for drug target validation and a systems biology approach to studying protein networks are also driving market expansion. Protein structure prediction using computational methods is an emerging trend, offering significant potential for drug design and development. A notable comparison within the market lies between industrial and academic applications. Industrial applications account for a significantly larger share, with more than 70% of new product developments focusing on this sector. This trend is driven by the growing demand for proteomics technologies in drug discovery and development, diagnostics, and industrial biotechnology.
In conclusion, The market is experiencing robust growth due to the increasing adoption of advanced proteomics technologies and applications, particularly in the industrial sector. These technologies offer valuable insights into protein function, behavior, and interactions, driving innovation and progress in various industries, including healthcare, pharmaceuticals, and biotechnology.
What are the key market drivers leading to the rise in the adoption of Proteomics Industry?
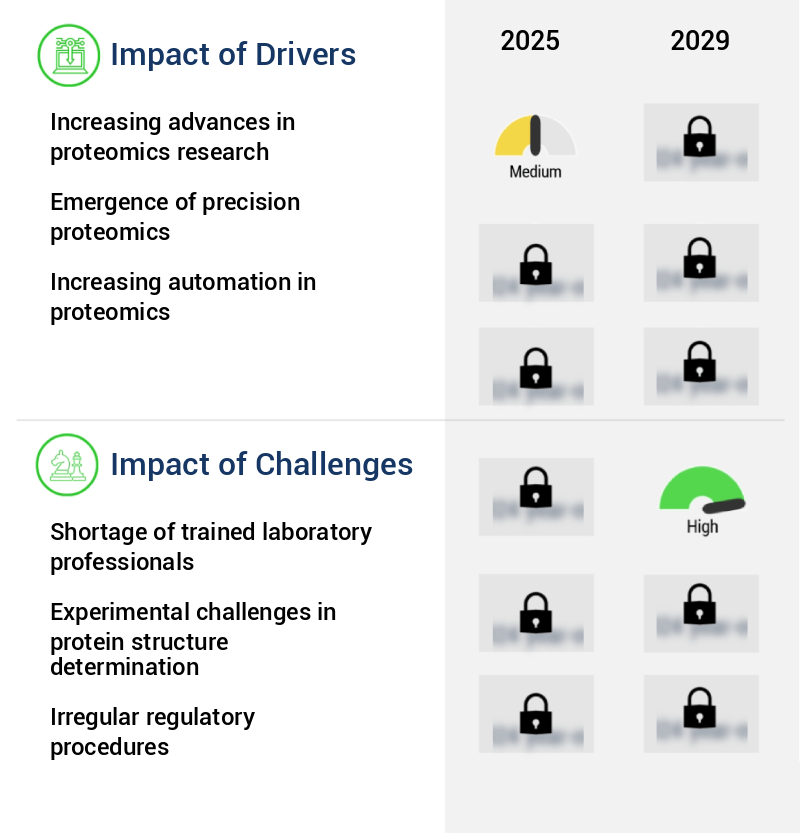
- Proteomics research, marked by continual advancements, serves as the primary catalyst for market growth.
- The market experiences continuous expansion due to the rapid progress in research and development within this field. Proteomics refers to the comprehensive analysis of proteins present in a cell, tissue, or organism. This area of study has gained significant traction, fueled by technological innovations such as mass spectrometry, chromatography, and bioinformatics. These advancements have enabled the discovery of novel protein identification, quantification, and characterization techniques. Consequently, the demand for proteomics products and services has surged, contributing to the market's growth.
- The ongoing evolution of proteomics research offers valuable insights into disease mechanisms and normal physiology, further expanding its applications across various sectors. The market's dynamism reflects the ever-growing importance of understanding proteins' roles in biological processes and their potential as therapeutic targets.
What are the market trends shaping the Proteomics Industry?
- The increasing importance of monitoring post-translation modifications (PTMs) represents a significant market trend. It is essential for organizations to stay abreast of this development to maintain competitive edge.
- The market has witnessed substantial expansion due to the escalating demand for sophisticated diagnostic tools and personalized medicine. A prominent trend in this market is the heightened emphasis on tracking post-translational modifications (PTMs) of proteins. PTMs are chemical alterations that occur post-translation, influencing a protein's function, activity, and localization. These modifications are instrumental in governing biological processes, making their monitoring indispensable for gaining in-depth insights into disease mechanisms and facilitating the creation of targeted therapies. Mass spectrometry, antibody-based assays, and chromatography are among the primary techniques employed for PTMs monitoring. Mass spectrometry, an analytical method, separates and identifies proteins based on their mass-to-charge ratio, providing valuable information about PTMs.
- Antibody-based assays utilize antibodies to detect specific PTMs, while chromatography separates proteins based on their physical or chemical properties. In conclusion, the market's continuous evolution is fueled by the growing importance of PTMs monitoring, which offers significant advantages in understanding disease mechanisms and developing targeted therapies. The application of advanced techniques like mass spectrometry, antibody-based assays, and chromatography further enhances the market's potential.
What challenges does the Proteomics Industry face during its growth?
- The shortage of adequately trained laboratory professionals poses a significant challenge to the growth and development of the industry. This workforce shortage hinders the industry's ability to meet increasing demands for accurate and timely diagnostic services, ultimately impacting patient care and potentially leading to suboptimal health outcomes.
- The market confronts a significant challenge: a scarcity of adequately trained laboratory personnel. This shortage impacts various aspects of proteomics, including research and development, manufacturing, and quality control. The root cause lies in insufficient awareness about proteomics as a field and the career opportunities it presents. Consequently, fewer students opt to study proteomics at the university level, leading to a dearth of qualified graduates. Moreover, the proteomics industry's rapid technological advancements further exacerbate the issue. New technologies emerge continually, necessitating ongoing education and training for professionals to remain competitive.
- To address this challenge, collaborative efforts between academic institutions, industry partners, and professional organizations are essential. These partnerships can foster educational programs, internships, and mentorship opportunities to attract and develop the next generation of proteomics professionals. By investing in workforce development, the market can overcome this obstacle and continue driving innovation and progress.
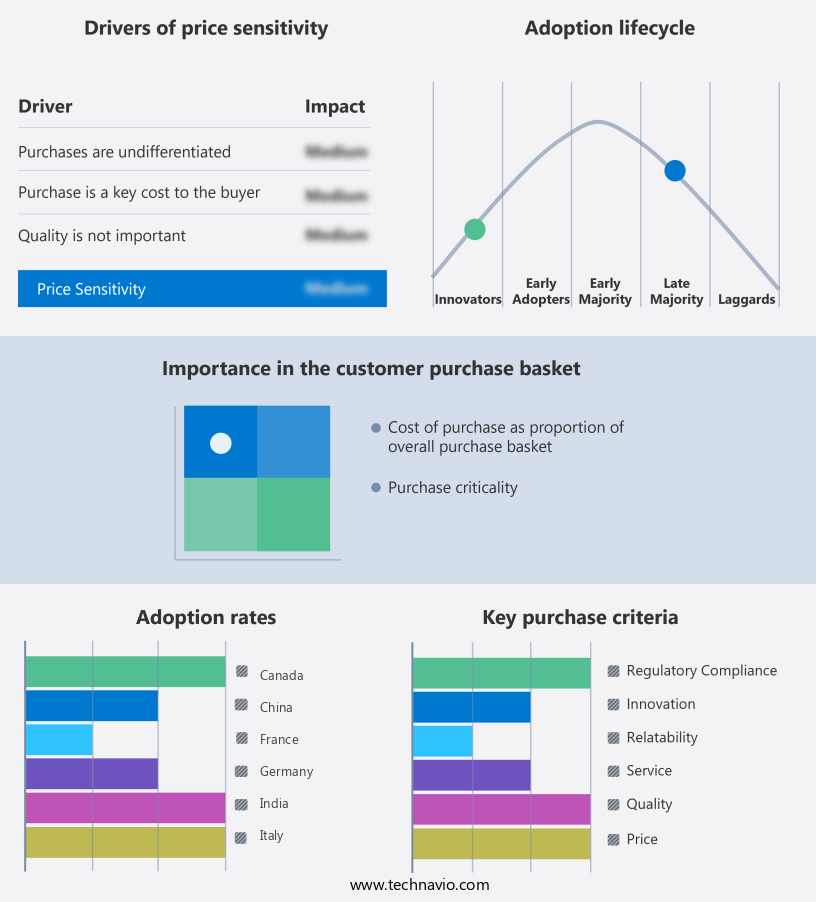
Exclusive Customer Landscape
The proteomics market forecasting report includes the adoption lifecycle of the market, covering from the innovator's stage to the laggard's stage. It focuses on adoption rates in different regions based on penetration. Furthermore, the proteomics market report also includes key purchase criteria and drivers of price sensitivity to help companies evaluate and develop their market growth analysis strategies.
Customer Landscape of Proteomics Industry
Competitive Landscape & Market Insights
Companies are implementing various strategies, such as strategic alliances, proteomics market forecast, partnerships, mergers and acquisitions, geographical expansion, and product/service launches, to enhance their presence in the industry.
Agilent Technologies Inc. - The company specializes in proteomics analysis using advanced techniques such as Liquid Chromatography Mass Spectrometry (LC-MS), including Jet Stream Peptide and targeted proteomics methods.
The industry research and growth report includes detailed analyses of the competitive landscape of the market and information about key companies, including:
- Agilent Technologies Inc.
- Applied Biomics Inc.
- Bio Rad Laboratories Inc.
- Biognosys AG
- Bruker Corp.
- Cell Signaling Technology Inc.
- CellCarta Biosciences Inc.
- Creative Proteomics
- DiaSorin Spa
- F. Hoffmann La Roche Ltd.
- Geno Technology Inc.
- HORIBA Ltd.
- Illumina Inc.
- Olink Holding AB
- Perkin Elmer Inc.
- Promega Corp.
- QIAGEN N.V.
- Sigma Aldrich Chemicals Pvt. Ltd.
- Thermo Fisher Scientific Inc.
- Waters Corp.
Qualitative and quantitative analysis of companies has been conducted to help clients understand the wider business environment as well as the strengths and weaknesses of key industry players. Data is qualitatively analyzed to categorize companies as pure play, category-focused, industry-focused, and diversified; it is quantitatively analyzed to categorize companies as dominant, leading, strong, tentative, and weak.
Recent Development and News in Proteomics Market
- In January 2024, Thermo Fisher Scientific, a leading life sciences solutions provider, launched the new Sequenom MassARRAY Proteomics System, enabling high-throughput, multiplexed protein quantitation from a single sample (Thermo Fisher Scientific Press Release).
- In March 2024, Siemens Healthineers and Illumina, Inc. announced a strategic collaboration to integrate Illumina's proteomics capabilities into Siemens Healthineers' laboratory diagnostics portfolio, aiming to accelerate the development of novel diagnostic tests (Siemens Healthineers Press Release).
- In April 2024, Qiagen NV, a Dutch biotech company, completed the acquisition of NeoCode, a US-based proteomics company, for approximately € 325 million, expanding its portfolio in the proteomics field and enhancing its offerings in the growing field of mass spectrometry-based proteomics (Qiagen NV Press Release).
- In May 2025, the US Food and Drug Administration (FDA) granted marketing authorization to Roche Diagnostics for its Elecsys Protein A1 assay, a fully automated, high-throughput method for measuring protein A1 levels in serum, which is used as a biomarker for kidney function monitoring (Roche Diagnostics Press Release).
Dive into Technavio's robust research methodology, blending expert interviews, extensive data synthesis, and validated models for unparalleled Proteomics Market insights. See full methodology.
|
Market Scope |
|
|
Report Coverage |
Details |
|
Page number |
203 |
|
Base year |
2024 |
|
Historic period |
2019-2023 |
|
Forecast period |
2025-2029 |
|
Growth momentum & CAGR |
Accelerate at a CAGR of 17.6% |
|
Market growth 2025-2029 |
USD 40.78 billion |
|
Market structure |
Fragmented |
|
YoY growth 2024-2025(%) |
14.6 |
|
Key countries |
US, Canada, Germany, UK, Italy, France, China, India, Japan, Brazil, Egypt, UAE, Oman, Argentina, KSA, UAE, Brazil, and Rest of World (ROW) |
|
Competitive landscape |
Leading Companies, Market Positioning of Companies, Competitive Strategies, and Industry Risks |
Research Analyst Overview
- The market is a dynamic and evolving field, characterized by continuous advancements in technologies and techniques that enable the large-scale identification, quantification, and analysis of proteins. One of the key areas of focus in proteomics is drug target identification, where electrophoresis techniques, such as gel electrophoresis and capillary electrophoresis, play a crucial role in separating proteins for further analysis. Another significant area is peptide sequencing workflows, which leverage mass spectrometry techniques like liquid chromatography systems and high-resolution mass spectrometry for accurate identification of peptides. Protein dynamics studies, including post-translational modifications and protein interaction networks, are also gaining increasing attention due to their potential implications in understanding complex biological processes.
- Moreover, the adoption of advanced statistical analysis methods, such as multiple reaction monitoring and protein quantification assays, facilitates the comparison of protein expression levels and functional proteomics studies. Protein identification methods, including label-free quantification and spectral counting methods, are also essential for differential protein expression analysis and personalized medicine approaches. Bioinformatics pipelines, protein function annotation, and protein expression profiling are integral components of the proteomics landscape, enabling researchers to analyze and interpret large datasets generated from various proteomics techniques. Proteomics applications extend to clinical settings, with disease mechanism research, protein biomarkers discovery, and clinical proteomics applications driving significant market activity.
- The market is characterized by a growing emphasis on functional proteomics studies, targeted proteomics, glycoproteomics analysis, and phosphoproteomics analysis. These approaches offer valuable insights into protein structure prediction, protein interaction networks, and protein-protein interactions, contributing to a more comprehensive understanding of biological systems. In summary, the market is marked by ongoing innovation and the adoption of advanced technologies and techniques, with a focus on drug target identification, protein analysis, and clinical applications. These trends reflect the evolving nature of the field and its potential to drive significant advancements in various industries, including healthcare and biotechnology.
What are the Key Data Covered in this Proteomics Market Research and Growth Report?
-
What is the expected growth of the Proteomics Market between 2025 and 2029?
-
USD 40.78 billion, at a CAGR of 17.6%
-
-
What segmentation does the market report cover?
-
The report segmented by Product (Reagents, Instruments, and Services), End-user (Clinical diagnostics, Drug discovery, and Others), Geography (North America, Europe, Asia, and Rest of World (ROW)), Type (Protein Microarrays, Mass Spectrometry, and Chromatography), and Application (Drug Discovery, Biomarker Identification, and Clinical Diagnostics)
-
-
Which regions are analyzed in the report?
-
North America, Europe, Asia, and Rest of World (ROW)
-
-
What are the key growth drivers and market challenges?
-
Increasing advances in proteomics research, Shortage of trained laboratory professionals
-
-
Who are the major players in the Proteomics Market?
-
Key Companies Agilent Technologies Inc., Applied Biomics Inc., Bio Rad Laboratories Inc., Biognosys AG, Bruker Corp., Cell Signaling Technology Inc., CellCarta Biosciences Inc., Creative Proteomics, DiaSorin Spa, F. Hoffmann La Roche Ltd., Geno Technology Inc., HORIBA Ltd., Illumina Inc., Olink Holding AB, Perkin Elmer Inc., Promega Corp., QIAGEN N.V., Sigma Aldrich Chemicals Pvt. Ltd., Thermo Fisher Scientific Inc., and Waters Corp.
-
Market Research Insights
- The market encompasses a range of technologies and techniques used to identify, quantify, and analyze proteins, their interactions, and functions. Two significant areas of focus include diagnostic assay development and therapeutic target validation. In 2020, the diagnostic assay market for proteomics was valued at USD 3.5 billion, while the therapeutic target validation segment was estimated to be worth USD 1.8 billion. Molecular chaperones, protein microarrays, systems biology approaches, and transcriptomics integration are essential tools in the proteomics toolbox. Techniques such as immunoprecipitation, protein degradation pathways, protein families, and proteolytic enzymes aid in understanding protein behavior and function.
- Protein expression vectors, multi-omics data analysis, protein microsequencing, and phylogenetic analysis contribute to the development of protein chips, protein stability assays, and antibody-based assays. Protein complexes, protein-ligand interactions, omics integration studies, protein folding studies, metabolomics integration, gene ontology, network analysis methods, biomarker validation studies, gene expression regulation, pathway analysis, and protein sequence alignment are integral to advancing our understanding of proteins and their roles in various biological processes. The continuous integration of these techniques and the exploration of new protein domains, protein domains, and protein-ligand interactions drive the evolving nature of the market.
We can help! Our analysts can customize this proteomics market research report to meet your requirements.
 RIA -
RIA - 
