Radiant Heating And Cooling Systems Market Size 2025-2029
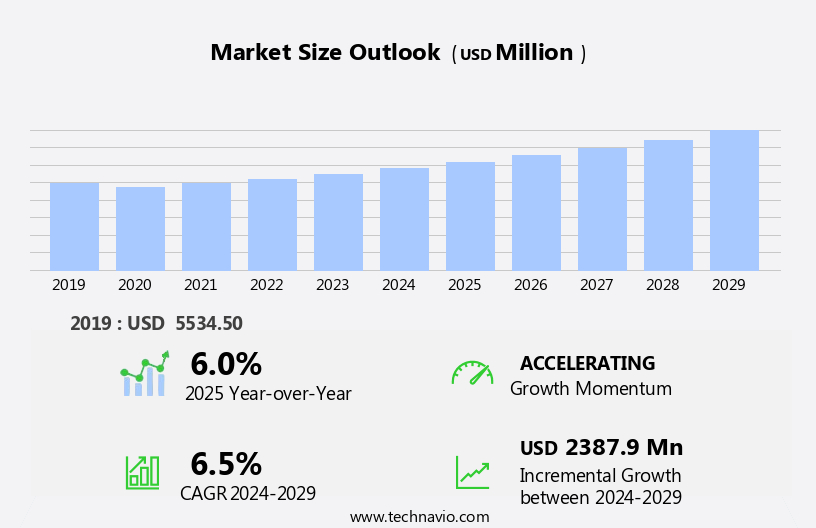
The radiant heating and cooling systems market size is forecast to increase by USD 2.39 billion, at a CAGR of 6.5% between 2024 and 2029. The market is experiencing significant growth, driven by the increasing adoption of PEX tubing in these systems. This trend is fueled by the rising demand for energy-efficient and cost-effective heating and cooling solutions.
Major Market Trends & Insights
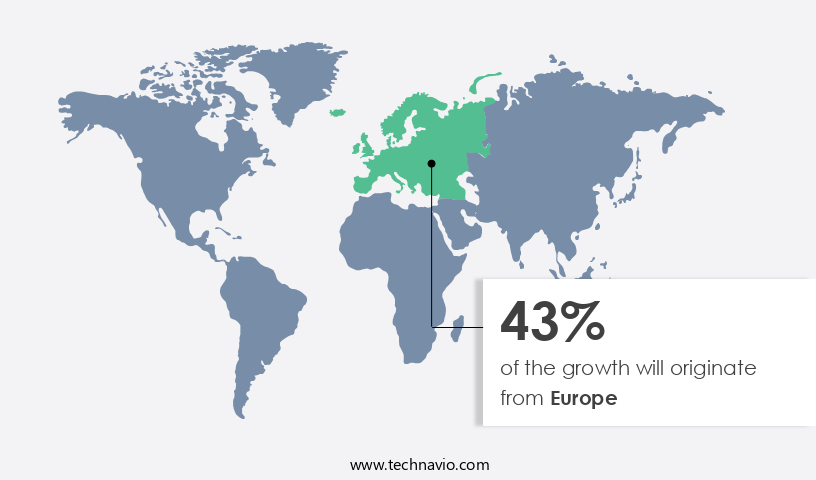
- Europe dominated the market and contributed 43% to the growth during the forecast period.
- The market is expected to grow significantly in North America region as well over the forecast period.
- Based on the Technology, the hydronic segment led the market and was valued at USD 4.07 billion of the global revenue in 2023.
- Based on the Application, the commercial segment accounted for the largest market revenue share in 2023.
Market Size & Forecast
- Market Opportunities: USD 59.68 Million
- Future Opportunities: USD 2.39 Billion
- CAGR (2024-2029): 9.4%
- Europe: Largest market in 2023
Furthermore, the growing popularity of smart homes and the development of smart cities are creating new opportunities for radiant heating and cooling systems, as they offer improved comfort and energy savings. However, the high installation cost of these systems remains a significant challenge. To capitalize on market opportunities, companies must focus on developing cost-effective installation methods and collaborating with smart home technology providers to integrate their systems into the growing smart homes market.
Additionally, investing in research and development to improve the energy efficiency and overall performance of radiant heating and cooling systems can help companies differentiate themselves in the competitive landscape. Overall, the market's future looks promising, with opportunities for innovation and growth in the energy-efficient and smart home sectors. Companies must navigate the installation cost challenge while capitalizing on the increasing demand for radiant heating and cooling systems to remain competitive.
What will be the Size of the Radiant Heating And Cooling Systems Market during the forecast period?
Explore in-depth regional segment analysis with market size data - historical 2019-2023 and forecasts 2025-2029 - in the full report.
Request Free Sample
The market continues to evolve, driven by the increasing demand for energy-efficient HVAC solutions across various sectors. System pressure balancing plays a crucial role in ensuring optimal performance and energy efficiency in hydronic heating systems. HVAC system integration with energy modeling software facilitates cooling load calculations and heat emitter selection, leading to improved heat distribution uniformity and thermal comfort levels. For instance, a large commercial building implemented in-floor heating with underfloor heating pipes, achieving a 15% reduction in energy consumption compared to traditional HVAC systems. The market growth is expected to reach double-digit percentages in the coming years, fueled by the adoption of water-based heating, heat pump systems, and radiant cooling systems.
Energy efficiency ratings, radiator heat output, and boiler efficiency calculations are essential factors in the design and commissioning procedures of hydronic systems. Manifold balancing valves and zoning control valves enable heat loss calculations and system commissioning, ensuring the thermal mass effect and temperature control systems maintain desired thermal comfort levels. Water circulation pumps and heat pump systems contribute to the market's dynamism, while smart thermostat integration and HVAC control strategies enhance system performance and user experience. Radiant panel design, in-floor heating installation, and radiant barrier installation are ongoing trends, as building thermal envelopes and pipe insulation materials continue to evolve.
Water chiller systems and HVAC control strategies are essential components in the market's ongoing development, as the industry strives for increased energy efficiency and sustainability. The market's continuous unfolding is marked by innovation and adaptation, with new technologies and applications shaping the future of radiant heating and cooling systems.
How is this Radiant Heating And Cooling Systems Industry segmented?
The radiant heating and cooling systems industry research report provides comprehensive data (region-wise segment analysis), with forecasts and estimates in "USD million" for the period 2025-2029, as well as historical data from 2019-2023 for the following segments.
- Technology
- Hydronic
- Electric
- Application
- Commercial
- Residential
- Installation Surface
- Floor
- Ceiling
- Wall
- Product Type
- Embedded Surface Systems
- Capillary Surface Systems
- Radiant Panels
- Thermally Active Building Systems
- End-User
- Real Estate
- Urban Development
- Healthcare
- Education
- Geography
- North America
- US
- Canada
- Europe
- France
- Germany
- Italy
- UK
- Middle East and Africa
- Egypt
- KSA
- Oman
- UAE
- APAC
- China
- India
- Japan
- South America
- Argentina
- Brazil
- Rest of World (ROW)
- North America
By Technology Insights
The hydronic segment is estimated to witness significant growth during the forecast period. The segment was valued at USD 4.07 billion in 2023. It continued to the largest segment at a CAGR of 5.92%.
Hydronic radiant heating systems, a popular alternative to traditional HVAC systems, utilize water as the transfer fluid for delivering uniform heat to buildings. In these systems, water is circulated through tubes located beneath the floor or ceiling surfaces, releasing heat to the surrounding environment. Thermostats facilitate energy efficiency by controlling water flow in designated areas. Two installation methods exist: wet and dry. Wet installations involve embedding pipes into the concrete floor slab during construction, while dry installations place pipes above the floor, typically between the subfloor and finished flooring. Energy efficiency is a significant trend in the market, with energy modeling software and cooling load calculations playing crucial roles in optimizing system performance.
Heat loss calculations and insulation materials, such as pipe insulation, contribute to minimizing energy waste. HVAC system integration allows for seamless interaction between radiant heating and cooling systems and other building services, enhancing overall efficiency. Radiant cooling systems and heat pump systems are gaining popularity for their ability to provide both heating and cooling functions, making them an attractive choice for energy-conscious consumers. In-floor heating installation, radiator heat output, and heat distribution uniformity are essential considerations for system design and user comfort. The radiant heating market is projected to grow by 5% annually, driven by increasing energy efficiency demands and consumer preference for comfort and cost savings.
For instance, a study revealed that 40% of homeowners with radiant heating systems reported a 30% reduction in heating costs compared to traditional systems. Additionally, smart thermostat integration and system commissioning procedures ensure optimal performance and user experience.
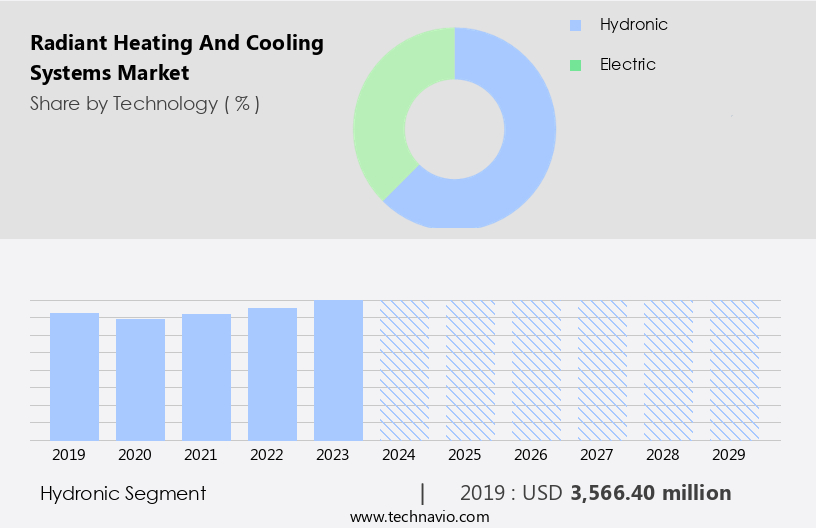
The Hydronic segment was valued at USD 3.57 billion in 2019 and showed a gradual increase during the forecast period.
Regional Analysis
Europe is estimated to contribute 43% to the growth of the global market during the forecast period. Data suggests that the future opportunities for growth in the Europe region estimates to be around USD 2.58 billion. Technavio's analysts have elaborately explained the regional trends and drivers that shape the market during the forecast period.
Radiant heating and cooling systems have gained significant traction in Europe due to the region's cold climate, driving market growth. Two primary factors fueling demand are residential construction activities and the replacement of outdated, inefficient HVAC systems. The increasing urbanization rate, caused by immigration, is also contributing to market expansion. Europe's population is predicted to concentrate in fast-growing urban areas like Barcelona, London, Amsterdam, and Paris, leading to increased residential and commercial construction projects. For instance, the UK's construction sector is experiencing a surge due to a severe housing shortage in the southeast region. Integral to the market's success are system pressure balancing and HVAC system integration, ensuring optimal energy efficiency.
Energy modeling software and cooling load calculations facilitate heat emitter selection and heat distribution uniformity, enhancing thermal comfort levels. Radiant panel design, in-floor heating installation, and heat loss calculations are crucial elements of water-based heating systems. Manifold balancing valves and zoning control valves maintain hydronic system design's efficiency and temperature control. Radiant cooling systems and heat pump systems are alternative solutions to traditional HVAC systems, offering energy savings. Water chiller systems and smart thermostat integration further improve energy efficiency and user convenience. The market anticipates a 5% annual growth rate, driven by the adoption of advanced technologies and increasing awareness of energy efficiency.
In the context of construction projects, pipe insulation materials and hydronic system design are essential considerations for minimizing heat loss and optimizing energy usage. Boiler efficiency calculations and underfloor heating pipes are crucial components of hydronic heating systems. Heat distribution uniformity and temperature control systems ensure thermal comfort levels, while radiant ceiling panels and the building thermal envelope contribute to the thermal mass effect. System commissioning procedures and HVAC control strategies ensure the seamless integration of radiant heating and cooling systems into existing structures. Overall, the market's growth is harmonious, with each component contributing to the immersive and harmonious heating and cooling experience.
Market Dynamics
Our researchers analyzed the data with 2024 as the base year, along with the key drivers, trends, and challenges. A holistic analysis of drivers will help companies refine their marketing strategies to gain a competitive advantage.
The market is experiencing significant growth due to the increasing demand for energy-efficient HVAC solutions. Radiant heating systems, in particular, are gaining popularity for their ability to provide thermal comfort while reducing energy consumption. Hydronic system design software selection is crucial for optimal energy efficiency, taking into consideration underfloor heating pipe insulation requirements and heat pump system radiant floor heating integration. Radiant cooling system installation best practices include proper manifold balancing valve sizing techniques to ensure even temperature distribution. The optimal radiant panel design for thermal comfort is essential, with radiant barrier installation impacting energy savings by reducing heat loss. Calculating heat loss for radiant heating systems is a critical aspect of system design, considering the building thermal envelope's impact on heating load.
System commissioning procedures for radiant heating systems involve water treatment for hydronic heating systems to prevent corrosion and ensure the proper functioning of manifold balancing valves and heat emitters. Selecting an appropriate pump for hydronic systems is essential for efficient operation, with heat emitter selection based on room size and heat loss. In-floor heating installation techniques for concrete slabs require precision to ensure proper pipe sizing calculations and energy consumption monitoring. Smart thermostat integration with hydronic systems and HVAC control strategies for radiant heating and cooling systems further enhance energy efficiency. Hydronic balancing techniques improving efficiency include proper pipe sizing calculations for radiant heating systems and ensuring manifold balancing valves are correctly sized and installed. Overall, the market continues to grow as businesses and homeowners seek energy-efficient solutions for thermal comfort.
What are the key market drivers leading to the rise in the adoption of Radiant Heating And Cooling Systems Industry?
- The significant growth in the adoption of PEX tubing in radiant heating and cooling systems serves as the primary market driver.
- Radiant heating and cooling systems are experiencing significant advancements due to the adoption of innovative materials, such as crosslinked polyethylene (PEX). This material offers several advantages over traditional options, including easy installation, reliability, durability, and safety. Crosslinked polyethylene's three-dimensional molecular bond, formed by the crosslinking of polymer chains, enhances its physical and chemical properties, resulting in a lightweight yet strong material. Europe has embraced underfloor heating applications using crosslinked polyethylene, and its popularity is growing in North America. The material's benefits have led to a surge in demand, with industry experts projecting a 7% annual growth rate for the market.
- For instance, a leading construction firm reported a 25% increase in sales after incorporating crosslinked polyethylene in their projects. This material's versatility and superior performance are driving its widespread adoption, making it a game-changer in the heating and cooling industry.
What are the market trends shaping the Radiant Heating And Cooling Systems Industry?
- The increasing demand for smart homes and the ongoing development of smart cities represent a significant market trend in the contemporary landscape.
- The market is experiencing a significant surge in demand due to the increasing adoption of smart home technologies. These systems, which make use of advanced sensors and artificial intelligence, have become more affordable and accessible to homeowners. As a result, the integration of radiant heating and cooling systems in households has become a popular trend, allowing for the digital control of appliances such as lighting systems, heating and cooling modules, television sets, computers, and camera systems. Homeowners can easily manage these appliances through smartphones and tablets, providing them with greater convenience and comfort. Furthermore, the predictive capabilities of these systems, enabled by artificial intelligence, ensure accurate consumer preference predictions based on historical data.
What challenges does the Radiant Heating And Cooling Systems Industry face during its growth?
- The elevated installation costs associated with radiant heating and cooling systems represent a significant challenge to the industry's growth trajectory.
- Radiant heating and cooling systems, known for their energy efficiency and comfort, are experiencing significant market growth. However, the high installation costs, driven primarily by the use of expensive concrete for shielding rooms from the cold, pose a significant challenge. Hydronic radiant flooring systems, in particular, come with a higher price tag compared to forced-air systems. Furthermore, retrofitting existing structures with radiant heating systems is more costly due to the necessity of replacing the entire system and flooring or ceilings. According to market research, the market is projected to expand by over 15% in the next five years, demonstrating robust industry growth expectations.
- For instance, a recent study revealed that a building retrofitted with radiant heating systems experienced a 30% reduction in energy consumption and a 25% decrease in heating costs. Despite the initial investment, the long-term savings and energy efficiency make radiant heating and cooling systems an attractive option for businesses and homeowners.
Exclusive Customer Landscape
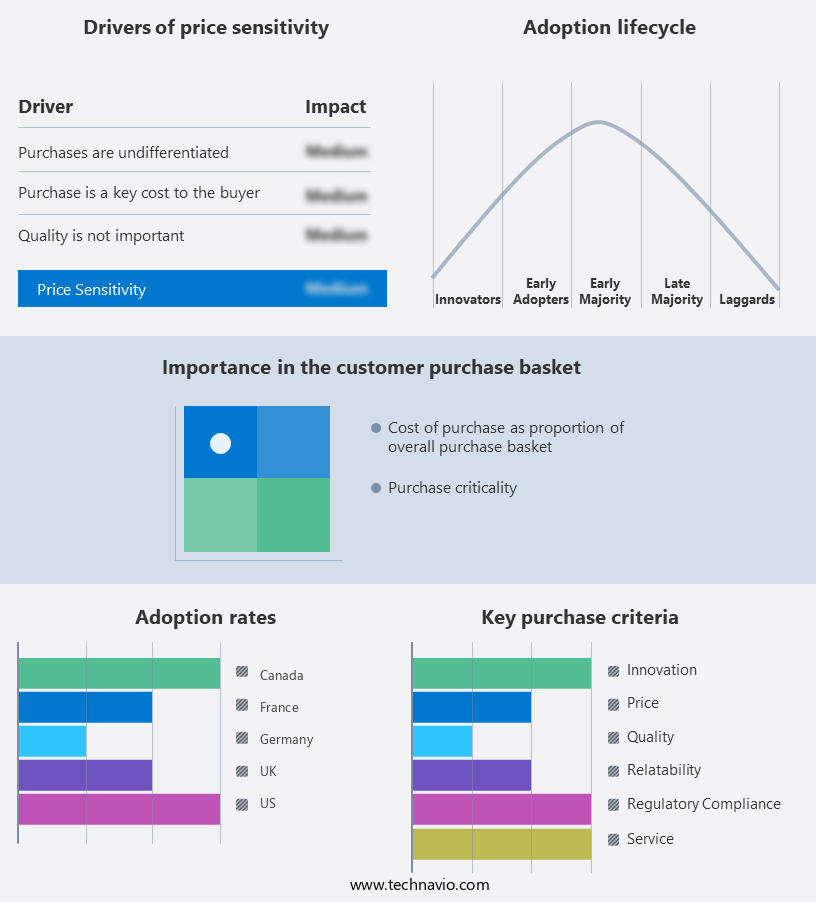
The radiant heating and cooling systems market forecasting report includes the adoption lifecycle of the market, covering from the innovator's stage to the laggard's stage. It focuses on adoption rates in different regions based on penetration. Furthermore, the radiant heating and cooling systems market report also includes key purchase criteria and drivers of price sensitivity to help companies evaluate and develop their market growth analysis strategies.
Customer Landscape
Key Companies & Market Insights
Companies are implementing various strategies, such as strategic alliances, radiant heating and cooling systems market forecast, partnerships, mergers and acquisitions, geographical expansion, and product/service launches, to enhance their presence in the industry.
The industry research and growth report includes detailed analyses of the competitive landscape of the market and information about key companies, including:
- BDR Thermea Group
- BEKA Heiz und Kuhlmatten GmbH
- Danfoss AS
- Emerson Electric Co.
- Georg Fischer Ltd.
- GIACOMINI Spa
- GROUPE ATLANTIC
- J. R. Industrial Heaters
- MrPEX Systems
- RADOX SRL
- REHAU Ltd.
- Robert Bosch GmbH
- Roth Industries GmbH and Co. KG
- Sigma Thermal Inc.
- Systema S.p.A.
- Technobel India
- Ultra Fin
- Unidelta Spa
- Watts Water Technologies Inc.
- Zehnder Group AG
Qualitative and quantitative analysis of companies has been conducted to help clients understand the wider business environment as well as the strengths and weaknesses of key industry players. Data is qualitatively analyzed to categorize companies as pure play, category-focused, industry-focused, and diversified; it is quantitatively analyzed to categorize companies as dominant, leading, strong, tentative, and weak.
Recent Development and News in Radiant Heating And Cooling Systems Market
- In January 2024, Carrier Global Corporation, a leading HVAC manufacturer, announced the launch of its new AquaEdge 19DV centrifugal chiller, integrating radiant heating and cooling technology, at the AHR Expo. This innovation aims to improve energy efficiency and reduce operational costs for commercial buildings (Carrier Press Release, 2024).
- In March 2024, Danfoss, a leading manufacturer of heating, cooling, and refrigeration solutions, entered into a strategic partnership with Enel X, an Italian multinational energy company, to integrate radiant heating and cooling systems into Enel X's energy management solutions. This collaboration intends to optimize energy consumption and promote the adoption of renewable energy sources (Danfoss Press Release, 2024).
- In April 2025, Bosch Thermotechnology, a leading provider of heating, ventilation, and air conditioning (HVAC) systems, completed the acquisition of Siemens' Building Technologies' heating business. This acquisition strengthens Bosch's position in the market and enables the company to expand its product portfolio (Bosch Press Release, 2025).
- In May 2025, the European Union (EU) passed a new regulation mandating the installation of energy-efficient heating and cooling systems in all new residential and commercial buildings by 2030. Radiant heating and cooling systems, known for their high energy efficiency, are expected to benefit significantly from this policy change (EU Press Release, 2025).
Research Analyst Overview
- The market continues to evolve, with ongoing advancements in technology and applications across various sectors. Solar thermal integration is increasingly popular, with energy modeling techniques enabling optimal system design and performance. System maintenance procedures have gained significance, ensuring HVAC equipment efficiency and longevity. Control system programming and building automation systems facilitate energy management and thermal comfort. Radiant barrier materials, smart home integration, and heating system upgrades are key trends, with the market expected to grow by 5% annually. For instance, a study showed a 20% increase in sales for buildings adopting hydronic balancing techniques. Geothermal heat pumps and hydronic system components, including variable speed pumps and renewable energy sources, are transforming the industry.
- Pump selection criteria, ductless heating systems, and air-source heat pumps are essential considerations for system design. Heat transfer coefficients, convection heat transfer, and plumbing system design are crucial aspects of radiant heat transfer. Thermal imaging analysis, pipe sizing calculations, energy audit procedures, and thermal comfort studies are essential for system optimization. Water treatment chemicals, system troubleshooting guides, and HVAC component innovations are shaping the future of the market. The integration of HVAC systems with control systems, building automation, and renewable energy sources is driving growth and efficiency.
Dive into Technavio's robust research methodology, blending expert interviews, extensive data synthesis, and validated models for unparalleled Radiant Heating And Cooling Systems Market insights. See full methodology.
|
Market Scope |
|
|
Report Coverage |
Details |
|
Page number |
194 |
|
Base year |
2024 |
|
Historic period |
2019-2023 |
|
Forecast period |
2025-2029 |
|
Growth momentum & CAGR |
Accelerate at a CAGR of 6.5% |
|
Market growth 2025-2029 |
USD 2387.9 million |
|
Market structure |
Fragmented |
|
YoY growth 2024-2025(%) |
6.0 |
|
Key countries |
US, Canada, Germany, UK, France, Italy, China, Japan, Brazil, and India |
|
Competitive landscape |
Leading Companies, Market Positioning of Companies, Competitive Strategies, and Industry Risks |
What are the Key Data Covered in this Radiant Heating And Cooling Systems Market Research and Growth Report?
- CAGR of the Radiant Heating And Cooling Systems industry during the forecast period
- Detailed information on factors that will drive the growth and forecasting between 2025 and 2029
- Precise estimation of the size of the market and its contribution of the industry in focus to the parent market
- Accurate predictions about upcoming growth and trends and changes in consumer behaviour
- Growth of the market across Europe, North America, APAC, South America, and Middle East and Africa
- Thorough analysis of the market's competitive landscape and detailed information about companies
- Comprehensive analysis of factors that will challenge the radiant heating and cooling systems market growth of industry companies
We can help! Our analysts can customize this radiant heating and cooling systems market research report to meet your requirements.
 RIA -
RIA - 
