Refractory Materials Market Analysis, Size, and Forecast 2026-2030: APAC (China, India, and Japan), Europe (Germany, France, and UK), North America (US, Canada, and Mexico), South America (Brazil, Argentina, and Colombia), Middle East and Africa (Saudi Arabia, UAE, and South Africa), and Rest of World (ROW)

Refractory Materials Market Analysis, Size, and Forecast 2026-2030:
APAC (China, India, and Japan), Europe (Germany, France, and UK), North America (US, Canada, and Mexico), South America (Brazil, Argentina, and Colombia), Middle East and Africa (Saudi Arabia, UAE, and South Africa), and Rest of World (ROW)

Published: Dec 2025 310 Pages SKU: IRTNTR70495

Market Overview at a Glance

$8.48 B
Market Opportunity
5.4%
CAGR 2025 - 2030
68.3%
APAC Growth
$20.48 B
Clay segment 2024

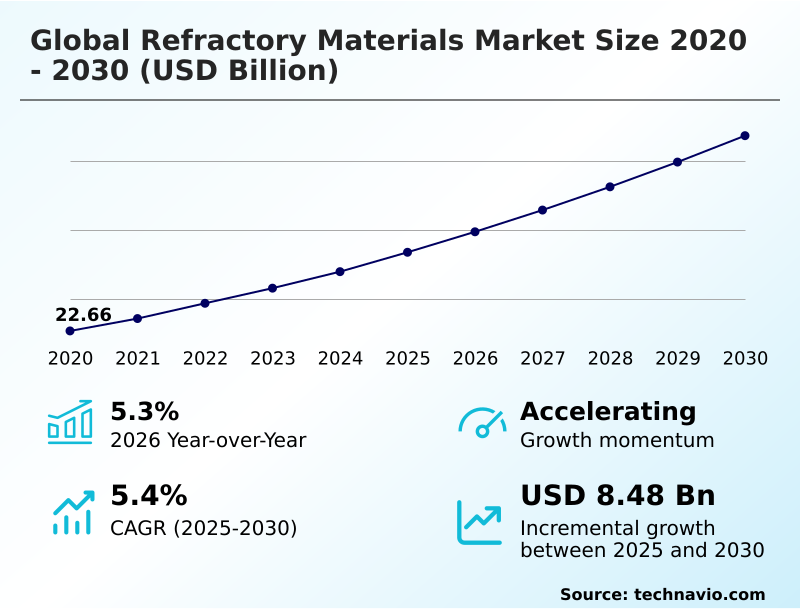
Refractory Materials Market Size 2026-2030

The refractory materials market size is valued to increase by USD 8.48 billion, at a CAGR of 5.4% from 2025 to 2030. Sustained global demand and capacity expansion in core end-use industries will drive the refractory materials market.

Major Market Trends & Insights

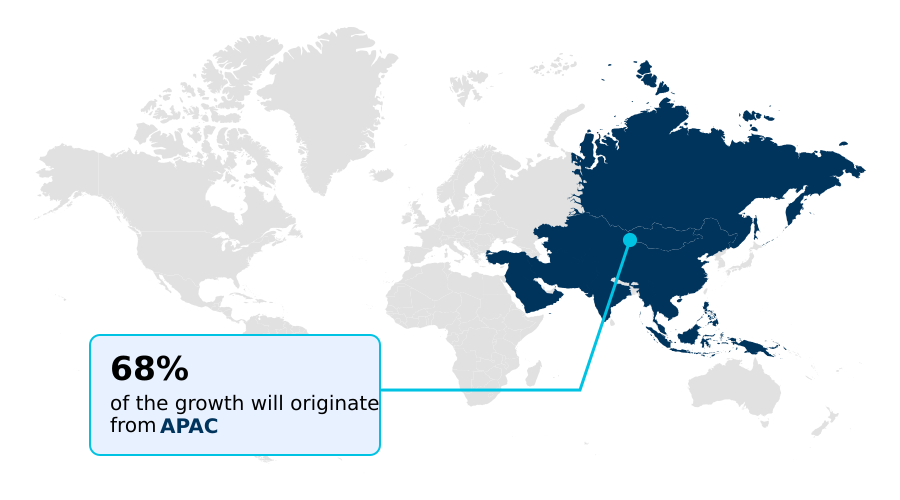
  • APAC dominated the market and accounted for a 68.3% growth during the forecast period.
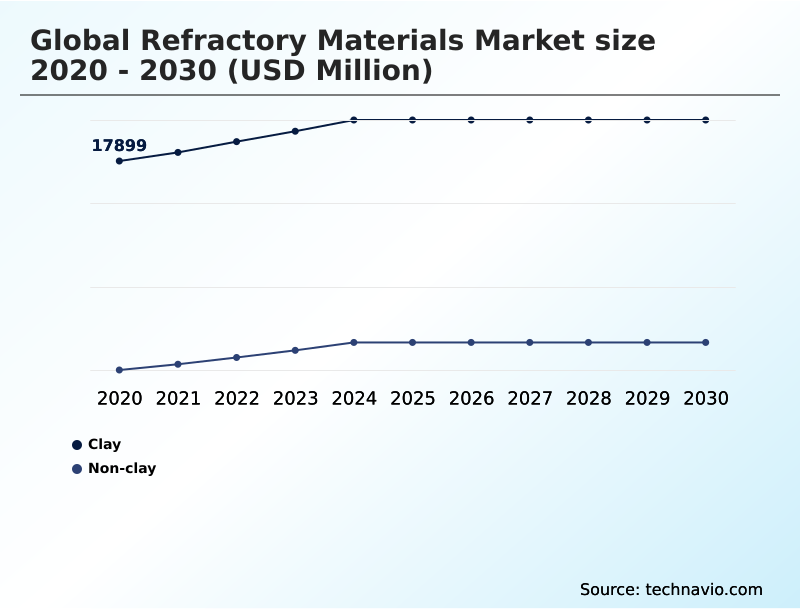
  • By Product Type - Clay segment was valued at USD 20.48 billion in 2024
  • By Type - Shaped segment accounted for the largest market revenue share in 2024

Market Size & Forecast

  • Market Opportunities: USD 14.20 billion
  • Market Future Opportunities: USD 8.48 billion
  • CAGR from 2025 to 2030 : 5.4%

Market Summary

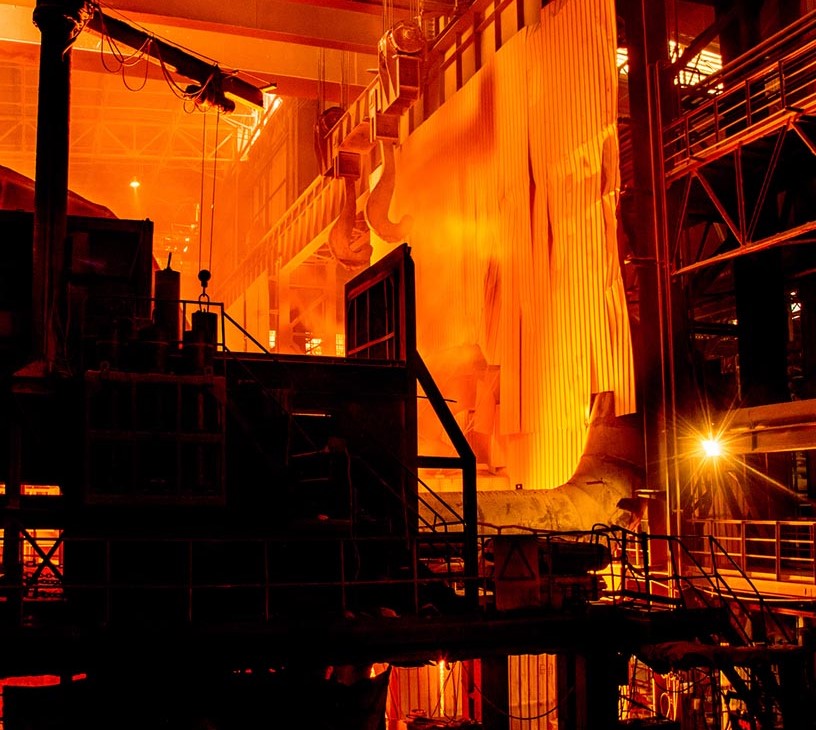
  • The refractory materials market is integral to high-temperature industrial processes, providing critical thermal containment for sectors like steel, cement, and glass. Market dynamics are shaped by a persistent need for operational efficiency, driving a transition from commodity products to high-performance, engineered solutions.
  • A key trend is the move toward materials that support industrial decarbonization, such as linings for electric arc furnaces and hydrogen-based production units, which demand enhanced chemical and thermal resistance. Concurrently, the industry grapples with volatile raw material supply chains and the challenge of developing longer-lasting products that inherently slow replacement cycles.
  • For instance, a steel manufacturer might implement a new monolithic lining that extends campaign life by 15%, reducing annual maintenance costs but also lowering the frequency of refractory purchases.
  • This scenario highlights the market's shift toward value-based partnerships, where suppliers provide integrated solutions, including predictive maintenance and recycling services, to align with customer goals of maximizing uptime and minimizing total cost of ownership. Digitalization, through sensor-embedded refractories and AI-driven wear modeling, further accelerates this transformation from a material supplier to a technology and service provider.

What will be the Size of the Refractory Materials Market during the forecast period?

Get Key Insights on Market Forecast (PDF) Request Free Sample

How is the Refractory Materials Market Segmented?

The refractory materials industry research report provides comprehensive data (region-wise segment analysis), with forecasts and estimates in "USD million" for the period 2026-2030, as well as historical data from 2020-2024 for the following segments.

  • Product type
    • Clay
    • Non-clay
  • Type
    • Shaped
    • Monolithic
  • Application
    • Iron and steel
    • Non-metallic materials
    • Non-ferrous metals
    • Others
  • Geography
    • APAC
      • China
      • India
      • Japan
    • Europe
      • Germany
      • France
      • UK
    • North America
      • US
      • Canada
      • Mexico
    • South America
      • Brazil
      • Argentina
      • Colombia
    • Middle East and Africa
      • Saudi Arabia
      • UAE
      • South Africa
    • Rest of World (ROW)

By Product Type Insights

The clay segment is estimated to witness significant growth during the forecast period.

The clay-based segment, built on aluminosilicate systems, remains foundational in high-temperature industries. While evolving, its market position is sustained by cost-effectiveness and raw material availability.

Innovation focuses on developing high-alumina compositions and advanced chemically bonded refractories to enhance performance in demanding applications like anode baking furnace linings.

This includes non-wetting alumina castables engineered for superior corundum growth prevention and low thermal mass refractories that directly contribute to embodied carbon reduction. The core objective is optimizing thermal containment design to improve efficiency and extend service life.

For instance, new formulations demonstrate improved refractory wear rate predictability, a critical factor for industries where lining performance must align with strict production schedules and refractory compatibility with green hydrogen is a growing concern.

Request Free Sample

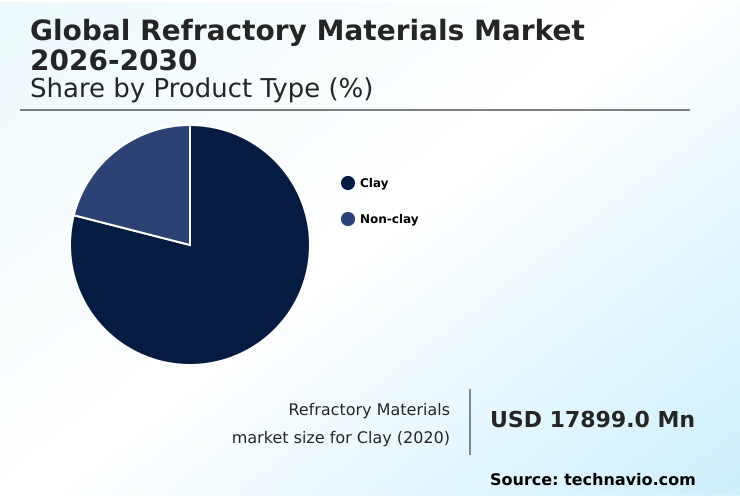
The Clay segment was valued at USD 20.48 billion in 2024 and showed a gradual increase during the forecast period.

Request Free Sample

Regional Analysis

APAC is estimated to contribute 68.3% to the growth of the global market during the forecast period.Technavio’s analysts have elaborately explained the regional trends and drivers that shape the market during the forecast period.

See How Refractory Materials Market Demand is Rising in APAC Request Free Sample

The geographic landscape is dominated by APAC, which accounts for over 68% of the incremental growth, driven by massive industrial expansion. This region’s demand for fused-cast refractories and magnesia-spinel bricks is fueled by new steel and cement capacity.

In contrast, Europe and North America focus on technological upgrades, with a strong emphasis on green steel production and materials for clinker-free cement kilns.

This drives adoption of specialized products like high-purity fused silica for glass and ultra-low cement castables with superior alkali attack resistance. The market shift includes a focus on end-of-life material management and detailed structural integrity assessment to optimize performance.

Specialized submerged entry nozzles remain critical for advanced steelmaking globally.
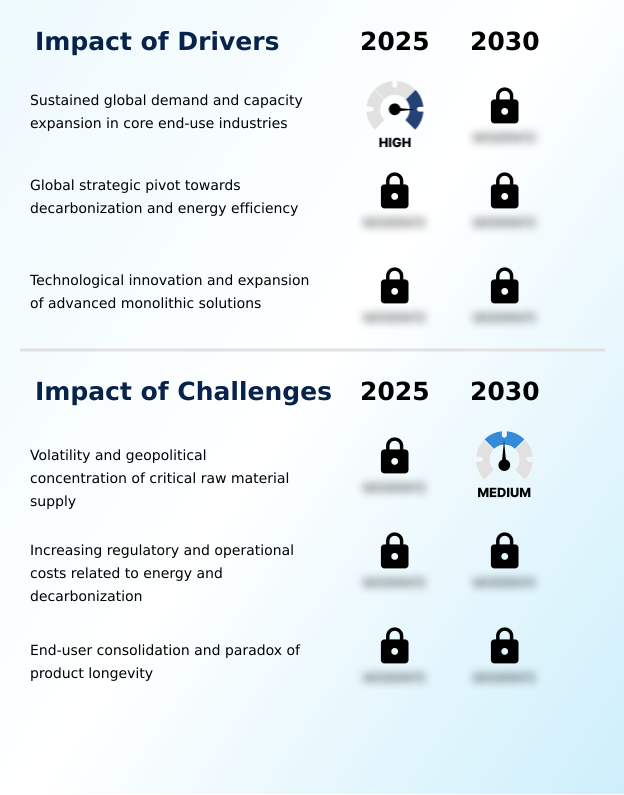
Market Dynamics

Our researchers analyzed the data with 2025 as the base year, along with the key drivers, trends, and challenges. A holistic analysis of drivers will help companies refine their marketing strategies to gain a competitive advantage.

  • The global refractory materials market is undergoing a significant transformation, moving beyond traditional supply models to address complex industrial challenges. There is a growing demand for refractory materials for hydrogen DRI, as steelmakers pivot to greener production methods. This requires materials with unique chemical resistance.
  • Similarly, the need for high-purity refractories for glass melting remains critical to prevent product contamination and ensure long furnace campaigns. In steelmaking, monolithic linings for steel ladles are gaining preference over bricks due to faster installation and repair, while refractory performance in EAF steelmaking is a key focus area driving innovation in magnesia-carbon products.
  • For the energy sector, insulating materials for petrochemical reformers are essential for thermal efficiency. The move to refractory solutions for alternative fuels in cement kilns presents new challenges for material durability. Emerging applications include advanced ceramics for energy storage and wear resistant linings for cement kilns designed for longer life.
  • The market is also seeing specialized demand for non-wetting castables for aluminum smelting and specialized refractories for copper smelting. Technology is a key enabler, with predictive analytics for refractory wear and robotic gunning for furnace repair becoming standard. Sustainability is driving interest in recycled content in refractory bricks and low-carbon binders for castables.
  • Other innovations include thermal shock resistant ladle shrouds, lightweight castables for furnace doors, smart refractories with embedded sensors, and chrome-free refractories for cement industry. Ensuring refractory compatibility with green hydrogen and developing high-emissivity coatings for furnace efficiency represent the next frontier.
  • Adopting these technologies allows firms to extend maintenance cycles, in some cases doubling the time between major relines compared to legacy systems.

What are the key market drivers leading to the rise in the adoption of Refractory Materials Industry?

  • Sustained global demand and strategic capacity expansion within core end-use industries, including steel and cement, represent the key driver for market growth.

  • Sustained industrial output creates a non-negotiable cyclical demand for refractory materials, driving market expansion. The preference is shifting toward advanced solutions that offer superior slag erosion tolerance and operational efficiency.
  • The adoption of robotic refractory installation for high-density gunning mixes has reduced application times by up to 40%, enhancing safety and consistency. Innovation in monolithic refractories, such as the non-cement refractory castable, is streamlining repair cycles.
  • Furthermore, demand is growing for pre-cast refractory shapes and insulating firebrick based on the traditional alumina-silica system, which are integral to thermal efficiency optimization. This trend is underpinned by enhanced high-temperature process control across end-user industries.

What are the market trends shaping the Refractory Materials Industry?

  • The market is defined by an accelerated shift toward digitalization and the integration of smart refractories. This trend is fundamentally reshaping competitive dynamics and value propositions for industrial end-users.

  • The refractory materials market is rapidly evolving through digitalization and sustainability mandates. The adoption of smart refractories with embedded sensors is enabling advanced predictive refractory maintenance, improving asset reliability by over 30%. This shift supports the broader push for industrial decarbonization, where material selection is critical. Innovations in microporous insulation and silicon carbide castables are lowering energy consumption.
  • At the same time, circular economy principles are driving the development of magnesia-carbon bricks with recycled content, enhancing supply chain resilience. High-performance monolithic refractories are increasingly specified for their superior thermal shock resistance, contributing to a market where technological value and lifecycle performance are paramount.

What challenges does the Refractory Materials Industry face during its growth?

  • The volatility and geopolitical concentration inherent in critical raw material supply chains pose a significant structural challenge to the industry's growth and cost stability.

  • The market faces significant headwinds from raw material volatility and evolving end-user demands. The supply of critical materials like dead burned magnesia and alumina-zirconia-silica remains geopolitically concentrated, leading to price instability. This affects the cost of high-performance products, including direct-bonded magnesia-chrome bricks and low-carbon resin-bonded mgo-c variants.
  • Concurrently, the success of advanced materials is extending furnace campaign life by up to 15%, altering the traditional refractory relining cycle. This paradox challenges revenue models, pushing suppliers toward the cost-per-ton-of-steel model. Technical issues such as molten metal infiltration and hydrogen-induced degradation require constant innovation in calcium aluminate binders to meet new performance thresholds.

Exclusive Technavio Analysis on Customer Landscape

The refractory materials market forecasting report includes the adoption lifecycle of the market, covering from the innovator’s stage to the laggard’s stage. It focuses on adoption rates in different regions based on penetration. Furthermore, the refractory materials market report also includes key purchase criteria and drivers of price sensitivity to help companies evaluate and develop their market growth analysis strategies.

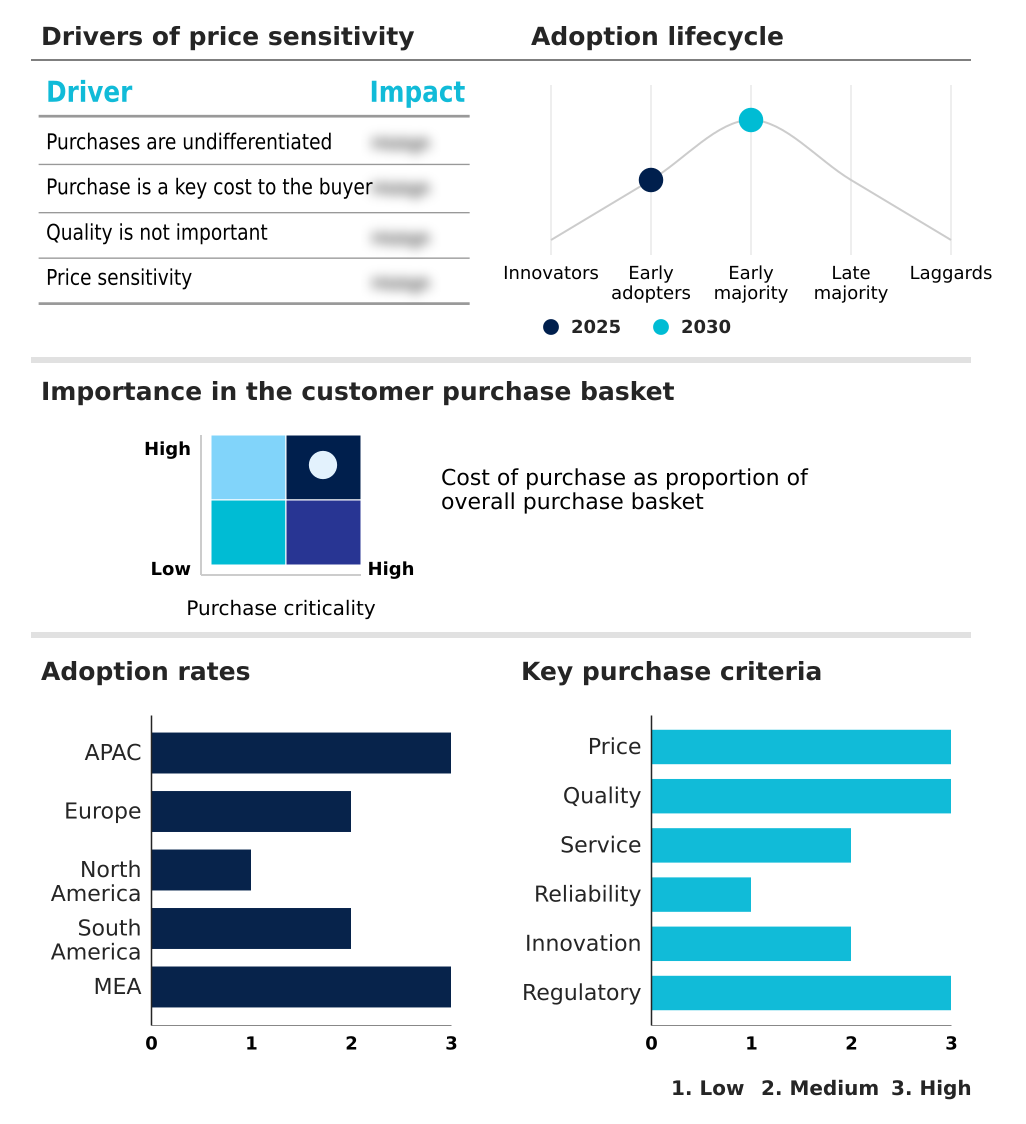
Customer Landscape of Refractory Materials Industry

Competitive Landscape

Companies are implementing various strategies, such as strategic alliances, refractory materials market forecast, partnerships, mergers and acquisitions, geographical expansion, and product/service launches, to enhance their presence in the industry.

Carborundum Universal - Offerings include a range of fired, monolithic, and super refractory materials providing high-temperature thermal insulation solutions for critical industrial processes in steel, cement, and glass manufacturing.

The industry research and growth report includes detailed analyses of the competitive landscape of the market and information about key companies, including:

  • Carborundum Universal
  • Compagnie de Saint Gobain SA
  • Corning Inc.
  • HarbisonWalker International
  • IFGL Refractories Ltd.
  • Imerys S.A.
  • INTOCAST AG
  • KAEFER SE and Co.
  • Krosaki Harima Corp.
  • Magnezit Group
  • Minerals Technologies Inc.
  • Morgan Advanced Materials
  • Refratechnik Holding
  • RHI Magnesita GmbH
  • SCR Sibelco NV
  • Shinagawa Refractories.
  • Vesuvius Plc

Qualitative and quantitative analysis of companies has been conducted to help clients understand the wider business environment as well as the strengths and weaknesses of key industry players. Data is qualitatively analyzed to categorize companies as pure play, category-focused, industry-focused, and diversified; it is quantitatively analyzed to categorize companies as dominant, leading, strong, tentative, and weak.

Recent Development and News in Refractory materials market

  • In March, 2025, RHI Magnesita finalized the integration of a newly acquired production facility in South America, strengthening its local presence and service capabilities for the region's steel and mining industries.
  • In January, 2025, HarbisonWalker International (HWI) introduced a next-generation non-cement refractory castable with improved flow and shorter curing times, enhancing operational efficiency for steel ladle maintenance.
  • In April, 2025, Imerys S.A. announced a breakthrough in high-purity calcium aluminate binder technology, enabling superior strength development in refractory castables at intermediate temperatures to extend service life.
  • In May, 2025, Vesuvius Plc announced a strategic partnership with a global artificial intelligence software firm to integrate machine learning into its software for optimizing tundish lining life in continuous casting.

Dive into Technavio’s robust research methodology, blending expert interviews, extensive data synthesis, and validated models for unparalleled Refractory Materials Market insights. See full methodology.

Market Scope
Page number 310
Base year 2025
Historic period 2020-2024
Forecast period 2026-2030
Growth momentum & CAGR Accelerate at a CAGR of 5.4%
Market growth 2026-2030 USD 8484.7 million
Market structure Fragmented
YoY growth 2025-2026(%) 5.3%
Key countries China, India, Japan, South Korea, Australia, Indonesia, Germany, France, UK, Italy, Spain, The Netherlands, US, Canada, Mexico, Brazil, Argentina, Colombia, Saudi Arabia, UAE, South Africa, Israel and Turkey
Competitive landscape Leading Companies, Market Positioning of Companies, Competitive Strategies, and Industry Risks

Request Free Sample

Research Analyst Overview

  • The refractory materials market is defined by its critical role in enabling high-temperature industrial manufacturing and its ongoing technological evolution. Demand is increasingly shifting toward advanced materials that offer extended service life and support sustainability goals. The use of sophisticated monolithic refractories, including the non-cement refractory castable and ultra-low cement castables, is rising due to installation flexibility and superior performance.
  • Core products like magnesia-carbon bricks and insulating firebrick from the alumina-silica system are being enhanced with new formulations, such as high-alumina compositions and advanced calcium aluminate binders. Specialized applications drive demand for fused-cast refractories, high-purity fused silica, and alumina-zirconia-silica in glassmaking, as well as direct-bonded magnesia-chrome and magnesia-spinel bricks in metallurgy.
  • The transition to EAFs and new DRI processes propels innovation in low-carbon resin-bonded mgo-c and chemically bonded refractories. A key boardroom-level consideration is the shift to performance-based contracts, enabled by smart refractories with embedded sensors. This service model, leveraging microporous insulation and pre-cast refractory shapes, allows end-users to achieve verified reductions in energy consumption by up to 10%.
  • This evolution demands continuous investment in materials like silicon carbide castables, high-density gunning mixes, and solutions for anode baking furnace linings, moving the industry from a product supplier to a service partner.

What are the Key Data Covered in this Refractory Materials Market Research and Growth Report?

  • What is the expected growth of the Refractory Materials Market between 2026 and 2030?

    • USD 8.48 billion, at a CAGR of 5.4%

  • What segmentation does the market report cover?

    • The report is segmented by Product Type (Clay, Non-clay), Type (Shaped, Monolithic), Application (Iron and steel, Non-metallic materials, Non-ferrous metals, Others) and Geography (APAC, Europe, North America, South America, Middle East and Africa)

  • Which regions are analyzed in the report?

    • APAC, Europe, North America, South America and Middle East and Africa

  • What are the key growth drivers and market challenges?

    • Sustained global demand and capacity expansion in core end-use industries, Volatility and geopolitical concentration of critical raw material supply

  • Who are the major players in the Refractory Materials Market?

    • Carborundum Universal, Compagnie de Saint Gobain SA, Corning Inc., HarbisonWalker International, IFGL Refractories Ltd., Imerys S.A., INTOCAST AG, KAEFER SE and Co., Krosaki Harima Corp., Magnezit Group, Minerals Technologies Inc., Morgan Advanced Materials, Refratechnik Holding, RHI Magnesita GmbH, SCR Sibelco NV, Shinagawa Refractories. and Vesuvius Plc

Market Research Insights

  • The refractory materials market is characterized by a dynamic shift toward value-added solutions, driven by the need for enhanced thermal efficiency optimization and supply chain resilience. The adoption of circular economy principles is reshaping end-of-life material management, with some producers achieving a 20% reduction in embodied carbon by using innovative binders.
  • As industries pursue industrial decarbonization, particularly in green steel production, demand for specialized materials with superior performance is increasing. This move toward high-performance solutions is changing procurement, with a notable shift toward the cost-per-ton-of-steel model that aligns supplier incentives with end-user productivity.
  • The focus on extending furnace campaign life and improving predictive refractory maintenance has enabled some operators to reduce unscheduled downtime by over 30%, highlighting the market's transition to a service-oriented and technology-led ecosystem.

We can help! Our analysts can customize this refractory materials market research report to meet your requirements.

Get in touch

1. Executive Summary

1.1 Market overview

Executive Summary - Chart on Market Overview
Executive Summary - Data Table on Market Overview
Executive Summary - Chart on Global Market Characteristics
Executive Summary - Chart on Market by Geography
Executive Summary - Chart on Market Segmentation by Product Type
Executive Summary - Chart on Market Segmentation by Type
Executive Summary - Chart on Market Segmentation by Application
Executive Summary - Chart on Incremental Growth
Executive Summary - Data Table on Incremental Growth
Executive Summary - Chart on Company Market Positioning

2. Technavio Analysis

2.1 Analysis of price sensitivity, lifecycle, customer purchase basket, adoption rates, and purchase criteria

2.2 Criticality of inputs and Factors of differentiation

Chart on Overview on criticality of inputs and factors of differentiation

2.3 Factors of disruption

Chart on Overview on factors of disruption

2.4 Impact of drivers and challenges

Chart on Impact of drivers and challenges in 2025 and 2030

3. Market Landscape

3.1 Market ecosystem

Chart on Parent Market
Data Table on - Parent Market

3.2 Market characteristics

Chart on Market characteristics analysis

3.3 Value chain analysis

Chart on Value chain analysis

4. Market Sizing

4.1 Market definition

Data Table on Offerings of companies included in the market definition

4.2 Market segment analysis

Market segments

4.3 Market size 2025

4.4 Market outlook: Forecast for 2025-2030

Chart on Global - Market size and forecast 2025-2030 ($ million)
Data Table on Global - Market size and forecast 2025-2030 ($ million)
Chart on Global Market: Year-over-year growth 2025-2030 (%)
Data Table on Global Market: Year-over-year growth 2025-2030 (%)

5. Historic Market Size

5.1 Global Refractory Materials Market 2020 - 2024

Historic Market Size - Data Table on Global Refractory Materials Market 2020 - 2024 ($ million)

5.2 Product Type segment analysis 2020 - 2024

Historic Market Size - Product Type Segment 2020 - 2024 ($ million)

5.3 Type segment analysis 2020 - 2024

Historic Market Size - Type Segment 2020 - 2024 ($ million)

5.4 Application segment analysis 2020 - 2024

Historic Market Size - Application Segment 2020 - 2024 ($ million)

5.5 Geography segment analysis 2020 - 2024

Historic Market Size - Geography Segment 2020 - 2024 ($ million)

5.6 Country segment analysis 2020 - 2024

Historic Market Size - Country Segment 2020 - 2024 ($ million)

6. Qualitative Analysis

6.1 The AI impact on global refractory materials market

7. Five Forces Analysis

7.1 Five forces summary

Five forces analysis - Comparison between 2025 and 2030

7.2 Bargaining power of buyers

Bargaining power of buyers - Impact of key factors 2025 and 2030

7.3 Bargaining power of suppliers

Bargaining power of suppliers - Impact of key factors in 2025 and 2030

7.4 Threat of new entrants

Threat of new entrants - Impact of key factors in 2025 and 2030

7.5 Threat of substitutes

Threat of substitutes - Impact of key factors in 2025 and 2030

7.6 Threat of rivalry

Threat of rivalry - Impact of key factors in 2025 and 2030

7.7 Market condition

Chart on Market condition - Five forces 2025 and 2030

8. Market Segmentation by Product Type

8.1 Market segments

Chart on Product Type - Market share 2025-2030 (%)
Data Table on Product Type - Market share 2025-2030 (%)

8.2 Comparison by Product Type

Chart on Comparison by Product Type
Data Table on Comparison by Product Type

8.3 Clay - Market size and forecast 2025-2030

Chart on Clay - Market size and forecast 2025-2030 ($ million)
Data Table on Clay - Market size and forecast 2025-2030 ($ million)
Chart on Clay - Year-over-year growth 2025-2030 (%)
Data Table on Clay - Year-over-year growth 2025-2030 (%)

8.4 Non-clay - Market size and forecast 2025-2030

Chart on Non-clay - Market size and forecast 2025-2030 ($ million)
Data Table on Non-clay - Market size and forecast 2025-2030 ($ million)
Chart on Non-clay - Year-over-year growth 2025-2030 (%)
Data Table on Non-clay - Year-over-year growth 2025-2030 (%)

8.5 Market opportunity by Product Type

Market opportunity by Product Type ($ million)
Data Table on Market opportunity by Product Type ($ million)

9. Market Segmentation by Type

9.1 Market segments

Chart on Type - Market share 2025-2030 (%)
Data Table on Type - Market share 2025-2030 (%)

9.2 Comparison by Type

Chart on Comparison by Type
Data Table on Comparison by Type

9.3 Shaped - Market size and forecast 2025-2030

Chart on Shaped - Market size and forecast 2025-2030 ($ million)
Data Table on Shaped - Market size and forecast 2025-2030 ($ million)
Chart on Shaped - Year-over-year growth 2025-2030 (%)
Data Table on Shaped - Year-over-year growth 2025-2030 (%)

9.4 Monolithic - Market size and forecast 2025-2030

Chart on Monolithic - Market size and forecast 2025-2030 ($ million)
Data Table on Monolithic - Market size and forecast 2025-2030 ($ million)
Chart on Monolithic - Year-over-year growth 2025-2030 (%)
Data Table on Monolithic - Year-over-year growth 2025-2030 (%)

9.5 Market opportunity by Type

Market opportunity by Type ($ million)
Data Table on Market opportunity by Type ($ million)

10. Market Segmentation by Application

10.1 Market segments

Chart on Application - Market share 2025-2030 (%)
Data Table on Application - Market share 2025-2030 (%)

10.2 Comparison by Application

Chart on Comparison by Application
Data Table on Comparison by Application

10.3 Iron and steel - Market size and forecast 2025-2030

Chart on Iron and steel - Market size and forecast 2025-2030 ($ million)
Data Table on Iron and steel - Market size and forecast 2025-2030 ($ million)
Chart on Iron and steel - Year-over-year growth 2025-2030 (%)
Data Table on Iron and steel - Year-over-year growth 2025-2030 (%)

10.4 Non-metallic materials - Market size and forecast 2025-2030

Chart on Non-metallic materials - Market size and forecast 2025-2030 ($ million)
Data Table on Non-metallic materials - Market size and forecast 2025-2030 ($ million)
Chart on Non-metallic materials - Year-over-year growth 2025-2030 (%)
Data Table on Non-metallic materials - Year-over-year growth 2025-2030 (%)

10.5 Non-ferrous metals - Market size and forecast 2025-2030

Chart on Non-ferrous metals - Market size and forecast 2025-2030 ($ million)
Data Table on Non-ferrous metals - Market size and forecast 2025-2030 ($ million)
Chart on Non-ferrous metals - Year-over-year growth 2025-2030 (%)
Data Table on Non-ferrous metals - Year-over-year growth 2025-2030 (%)

10.6 Others - Market size and forecast 2025-2030

Chart on Others - Market size and forecast 2025-2030 ($ million)
Data Table on Others - Market size and forecast 2025-2030 ($ million)
Chart on Others - Year-over-year growth 2025-2030 (%)
Data Table on Others - Year-over-year growth 2025-2030 (%)

10.7 Market opportunity by Application

Market opportunity by Application ($ million)
Data Table on Market opportunity by Application ($ million)

11. Customer Landscape

11.1 Customer landscape overview

Analysis of price sensitivity, lifecycle, customer purchase basket, adoption rates, and purchase criteria

12. Geographic Landscape

12.1 Geographic segmentation

Chart on Market share by geography 2025-2030 (%)
Data Table on Market share by geography 2025-2030 (%)

12.2 Geographic comparison

Chart on Geographic comparison
Data Table on Geographic comparison

12.3 APAC - Market size and forecast 2025-2030

Chart on APAC - Market size and forecast 2025-2030 ($ million)
Data Table on APAC - Market size and forecast 2025-2030 ($ million)
Chart on APAC - Year-over-year growth 2025-2030 (%)
Data Table on APAC - Year-over-year growth 2025-2030 (%)
Chart on Regional Comparison - APAC
Data Table on Regional Comparison - APAC

12.3.1 China - Market size and forecast 2025-2030

Chart on China - Market size and forecast 2025-2030 ($ million)
Data Table on China - Market size and forecast 2025-2030 ($ million)
Chart on China - Year-over-year growth 2025-2030 (%)
Data Table on China - Year-over-year growth 2025-2030 (%)

12.3.2 India - Market size and forecast 2025-2030

Chart on India - Market size and forecast 2025-2030 ($ million)
Data Table on India - Market size and forecast 2025-2030 ($ million)
Chart on India - Year-over-year growth 2025-2030 (%)
Data Table on India - Year-over-year growth 2025-2030 (%)

12.3.3 Japan - Market size and forecast 2025-2030

Chart on Japan - Market size and forecast 2025-2030 ($ million)
Data Table on Japan - Market size and forecast 2025-2030 ($ million)
Chart on Japan - Year-over-year growth 2025-2030 (%)
Data Table on Japan - Year-over-year growth 2025-2030 (%)

12.3.4 South Korea - Market size and forecast 2025-2030

Chart on South Korea - Market size and forecast 2025-2030 ($ million)
Data Table on South Korea - Market size and forecast 2025-2030 ($ million)
Chart on South Korea - Year-over-year growth 2025-2030 (%)
Data Table on South Korea - Year-over-year growth 2025-2030 (%)

12.3.5 Australia - Market size and forecast 2025-2030

Chart on Australia - Market size and forecast 2025-2030 ($ million)
Data Table on Australia - Market size and forecast 2025-2030 ($ million)
Chart on Australia - Year-over-year growth 2025-2030 (%)
Data Table on Australia - Year-over-year growth 2025-2030 (%)

12.3.6 Indonesia - Market size and forecast 2025-2030

Chart on Indonesia - Market size and forecast 2025-2030 ($ million)
Data Table on Indonesia - Market size and forecast 2025-2030 ($ million)
Chart on Indonesia - Year-over-year growth 2025-2030 (%)
Data Table on Indonesia - Year-over-year growth 2025-2030 (%)

12.4 Europe - Market size and forecast 2025-2030

Chart on Europe - Market size and forecast 2025-2030 ($ million)
Data Table on Europe - Market size and forecast 2025-2030 ($ million)
Chart on Europe - Year-over-year growth 2025-2030 (%)
Data Table on Europe - Year-over-year growth 2025-2030 (%)
Chart on Regional Comparison - Europe
Data Table on Regional Comparison - Europe

12.4.1 Germany - Market size and forecast 2025-2030

Chart on Germany - Market size and forecast 2025-2030 ($ million)
Data Table on Germany - Market size and forecast 2025-2030 ($ million)
Chart on Germany - Year-over-year growth 2025-2030 (%)
Data Table on Germany - Year-over-year growth 2025-2030 (%)

12.4.2 France - Market size and forecast 2025-2030

Chart on France - Market size and forecast 2025-2030 ($ million)
Data Table on France - Market size and forecast 2025-2030 ($ million)
Chart on France - Year-over-year growth 2025-2030 (%)
Data Table on France - Year-over-year growth 2025-2030 (%)

12.4.3 UK - Market size and forecast 2025-2030

Chart on UK - Market size and forecast 2025-2030 ($ million)
Data Table on UK - Market size and forecast 2025-2030 ($ million)
Chart on UK - Year-over-year growth 2025-2030 (%)
Data Table on UK - Year-over-year growth 2025-2030 (%)

12.4.4 Italy - Market size and forecast 2025-2030

Chart on Italy - Market size and forecast 2025-2030 ($ million)
Data Table on Italy - Market size and forecast 2025-2030 ($ million)
Chart on Italy - Year-over-year growth 2025-2030 (%)
Data Table on Italy - Year-over-year growth 2025-2030 (%)

12.4.5 Spain - Market size and forecast 2025-2030

Chart on Spain - Market size and forecast 2025-2030 ($ million)
Data Table on Spain - Market size and forecast 2025-2030 ($ million)
Chart on Spain - Year-over-year growth 2025-2030 (%)
Data Table on Spain - Year-over-year growth 2025-2030 (%)

12.4.6 The Netherlands - Market size and forecast 2025-2030

Chart on The Netherlands - Market size and forecast 2025-2030 ($ million)
Data Table on The Netherlands - Market size and forecast 2025-2030 ($ million)
Chart on The Netherlands - Year-over-year growth 2025-2030 (%)
Data Table on The Netherlands - Year-over-year growth 2025-2030 (%)

12.5 North America - Market size and forecast 2025-2030

Chart on North America - Market size and forecast 2025-2030 ($ million)
Data Table on North America - Market size and forecast 2025-2030 ($ million)
Chart on North America - Year-over-year growth 2025-2030 (%)
Data Table on North America - Year-over-year growth 2025-2030 (%)
Chart on Regional Comparison - North America
Data Table on Regional Comparison - North America

12.5.1 US - Market size and forecast 2025-2030

Chart on US - Market size and forecast 2025-2030 ($ million)
Data Table on US - Market size and forecast 2025-2030 ($ million)
Chart on US - Year-over-year growth 2025-2030 (%)
Data Table on US - Year-over-year growth 2025-2030 (%)

12.5.2 Canada - Market size and forecast 2025-2030

Chart on Canada - Market size and forecast 2025-2030 ($ million)
Data Table on Canada - Market size and forecast 2025-2030 ($ million)
Chart on Canada - Year-over-year growth 2025-2030 (%)
Data Table on Canada - Year-over-year growth 2025-2030 (%)

12.5.3 Mexico - Market size and forecast 2025-2030

Chart on Mexico - Market size and forecast 2025-2030 ($ million)
Data Table on Mexico - Market size and forecast 2025-2030 ($ million)
Chart on Mexico - Year-over-year growth 2025-2030 (%)
Data Table on Mexico - Year-over-year growth 2025-2030 (%)

12.6 South America - Market size and forecast 2025-2030

Chart on South America - Market size and forecast 2025-2030 ($ million)
Data Table on South America - Market size and forecast 2025-2030 ($ million)
Chart on South America - Year-over-year growth 2025-2030 (%)
Data Table on South America - Year-over-year growth 2025-2030 (%)
Chart on Regional Comparison - South America
Data Table on Regional Comparison - South America

12.6.1 Brazil - Market size and forecast 2025-2030

Chart on Brazil - Market size and forecast 2025-2030 ($ million)
Data Table on Brazil - Market size and forecast 2025-2030 ($ million)
Chart on Brazil - Year-over-year growth 2025-2030 (%)
Data Table on Brazil - Year-over-year growth 2025-2030 (%)

12.6.2 Argentina - Market size and forecast 2025-2030

Chart on Argentina - Market size and forecast 2025-2030 ($ million)
Data Table on Argentina - Market size and forecast 2025-2030 ($ million)
Chart on Argentina - Year-over-year growth 2025-2030 (%)
Data Table on Argentina - Year-over-year growth 2025-2030 (%)

12.6.3 Colombia - Market size and forecast 2025-2030

Chart on Colombia - Market size and forecast 2025-2030 ($ million)
Data Table on Colombia - Market size and forecast 2025-2030 ($ million)
Chart on Colombia - Year-over-year growth 2025-2030 (%)
Data Table on Colombia - Year-over-year growth 2025-2030 (%)

12.7 Middle East and Africa - Market size and forecast 2025-2030

Chart on Middle East and Africa - Market size and forecast 2025-2030 ($ million)
Data Table on Middle East and Africa - Market size and forecast 2025-2030 ($ million)
Chart on Middle East and Africa - Year-over-year growth 2025-2030 (%)
Data Table on Middle East and Africa - Year-over-year growth 2025-2030 (%)
Chart on Regional Comparison - Middle East and Africa
Data Table on Regional Comparison - Middle East and Africa

12.7.1 Saudi Arabia - Market size and forecast 2025-2030

Chart on Saudi Arabia - Market size and forecast 2025-2030 ($ million)
Data Table on Saudi Arabia - Market size and forecast 2025-2030 ($ million)
Chart on Saudi Arabia - Year-over-year growth 2025-2030 (%)
Data Table on Saudi Arabia - Year-over-year growth 2025-2030 (%)

12.7.2 UAE - Market size and forecast 2025-2030

Chart on UAE - Market size and forecast 2025-2030 ($ million)
Data Table on UAE - Market size and forecast 2025-2030 ($ million)
Chart on UAE - Year-over-year growth 2025-2030 (%)
Data Table on UAE - Year-over-year growth 2025-2030 (%)

12.7.3 South Africa - Market size and forecast 2025-2030

Chart on South Africa - Market size and forecast 2025-2030 ($ million)
Data Table on South Africa - Market size and forecast 2025-2030 ($ million)
Chart on South Africa - Year-over-year growth 2025-2030 (%)
Data Table on South Africa - Year-over-year growth 2025-2030 (%)

12.7.4 Israel - Market size and forecast 2025-2030

Chart on Israel - Market size and forecast 2025-2030 ($ million)
Data Table on Israel - Market size and forecast 2025-2030 ($ million)
Chart on Israel - Year-over-year growth 2025-2030 (%)
Data Table on Israel - Year-over-year growth 2025-2030 (%)

12.7.5 Turkey - Market size and forecast 2025-2030

Chart on Turkey - Market size and forecast 2025-2030 ($ million)
Data Table on Turkey - Market size and forecast 2025-2030 ($ million)
Chart on Turkey - Year-over-year growth 2025-2030 (%)
Data Table on Turkey - Year-over-year growth 2025-2030 (%)

12.8 Market opportunity by geography

Market opportunity by geography ($ million)
Data Tables on Market opportunity by geography ($ million)

13. Drivers, Challenges, and Opportunity

13.1 Market drivers

Sustained global demand and capacity expansion in core end-use industries
Global strategic pivot towards decarbonization and energy efficiency
Technological innovation and expansion of advanced monolithic solutions

13.2 Market challenges

Volatility and geopolitical concentration of critical raw material supply
Increasing regulatory and operational costs related to energy and decarbonization
End-user consolidation and paradox of product longevity

13.3 Impact of drivers and challenges

Impact of drivers and challenges in 2025 and 2030

13.4 Market opportunities

Accelerated shift to digitalization and smart refractories
Sustainability and circular economy mandate
Regional capacity realignment and local-for-local strategy

14. Competitive Landscape

14.1 Overview

14.2

Overview on criticality of inputs and factors of differentiation

14.3 Landscape disruption

Overview on factors of disruption

14.4 Industry risks

Impact of key risks on business

15. Competitive Analysis

15.1 Companies profiled

Companies covered

15.2 Company ranking index

15.3 Market positioning of companies

Matrix on companies position and classification

15.4 Carborundum Universal

Carborundum Universal - Overview
Carborundum Universal - Business segments
Carborundum Universal - Key offerings
Carborundum Universal - Segment focus
SWOT

15.5 Compagnie de Saint Gobain SA

Compagnie de Saint Gobain SA - Overview
Compagnie de Saint Gobain SA - Business segments
Compagnie de Saint Gobain SA - Key news
Compagnie de Saint Gobain SA - Key offerings
Compagnie de Saint Gobain SA - Segment focus
SWOT

15.6 Corning Inc.

Corning Inc. - Overview
Corning Inc. - Business segments
Corning Inc. - Key news
Corning Inc. - Key offerings
Corning Inc. - Segment focus
SWOT

15.7 HarbisonWalker International

HarbisonWalker International - Overview
HarbisonWalker International - Product / Service
HarbisonWalker International - Key offerings
SWOT

15.8 IFGL Refractories Ltd.

IFGL Refractories Ltd. - Overview
IFGL Refractories Ltd. - Product / Service
IFGL Refractories Ltd. - Key offerings
SWOT

15.9 Imerys S.A.

Imerys S.A. - Overview
Imerys S.A. - Business segments
Imerys S.A. - Key offerings
Imerys S.A. - Segment focus
SWOT

15.10 INTOCAST AG

INTOCAST AG - Overview
INTOCAST AG - Product / Service
INTOCAST AG - Key offerings
SWOT

15.11 KAEFER SE and Co.

KAEFER SE and Co. - Overview
KAEFER SE and Co. - Product / Service
KAEFER SE and Co. - Key offerings
SWOT

15.12 Krosaki Harima Corp.

Krosaki Harima Corp. - Overview
Krosaki Harima Corp. - Business segments
Krosaki Harima Corp. - Key offerings
Krosaki Harima Corp. - Segment focus
SWOT

15.13 Magnezit Group

Magnezit Group - Overview
Magnezit Group - Product / Service
Magnezit Group - Key offerings
SWOT

15.14 Minerals Technologies Inc.

Minerals Technologies Inc. - Overview
Minerals Technologies Inc. - Business segments
Minerals Technologies Inc. - Key news
Minerals Technologies Inc. - Key offerings
Minerals Technologies Inc. - Segment focus
SWOT

15.15 Morgan Advanced Materials

Morgan Advanced Materials - Overview
Morgan Advanced Materials - Business segments
Morgan Advanced Materials - Key news
Morgan Advanced Materials - Key offerings
Morgan Advanced Materials - Segment focus
SWOT

15.16 Refratechnik Holding

Refratechnik Holding - Overview
Refratechnik Holding - Product / Service
Refratechnik Holding - Key offerings
SWOT

15.17 RHI Magnesita GmbH

RHI Magnesita GmbH - Overview
RHI Magnesita GmbH - Business segments
RHI Magnesita GmbH - Key news
RHI Magnesita GmbH - Key offerings
RHI Magnesita GmbH - Segment focus
SWOT

15.18 SCR Sibelco NV

SCR Sibelco NV - Overview
SCR Sibelco NV - Product / Service
SCR Sibelco NV - Key news
SCR Sibelco NV - Key offerings
SWOT

16. Appendix

16.1 Scope of the report

Market definition
Objectives
Notes and caveats

16.2 Inclusions and exclusions checklist

Inclusions checklist
Exclusions checklist

16.3 Currency conversion rates for US$

16.4 Research methodology

16.5 Data procurement

Information sources

16.6 Data validation

16.7 Validation techniques employed for market sizing

16.8 Data synthesis

16.9 360 degree market analysis

16.10 List of abbreviations

Research Methodology

Technavio presents a detailed picture of the market by way of study, synthesis, and summation of data from multiple sources. The analysts have presented the various facets of the market with a particular focus on identifying the key industry influencers. The data thus presented is comprehensive, reliable, and the result of extensive research, both primary and secondary.

INFORMATION SOURCES

Primary sources

  • Manufacturers and suppliers
  • Channel partners
  • Industry experts
  • Strategic decision makers

Secondary sources

  • Industry journals and periodicals
  • Government data
  • Financial reports of key industry players
  • Historical data
  • Press releases

DATA ANALYSIS

Data Synthesis

  • Collation of data
  • Estimation of key figures
  • Analysis of derived insights

Data Validation

  • Triangulation with data models
  • Reference against proprietary databases
  • Corroboration with industry experts

REPORT WRITING

Qualitative

  • Market drivers
  • Market challenges
  • Market trends
  • Five forces analysis

Quantitative

  • Market size and forecast
  • Market segmentation
  • Geographical insights
  • Competitive landscape

Interested in this report?

Get your sample now to see our research methodology and insights!

Download Now

Frequently Asked Questions

Refractory Materials market growth will increase by USD 8484.7 million during 2026-2030 .

The Refractory Materials market is expected to grow at a CAGR of 5.4% during 2026-2030 .

Refractory Materials market is segmented by Product type (Clay, Non-clay) Type (Shaped, Monolithic) Application (Iron and steel, Non-metallic materials, Non-ferrous metals, Others)

Carborundum Universal, Compagnie de Saint Gobain SA, Corning Inc., HarbisonWalker International, IFGL Refractories Ltd., Imerys S.A., INTOCAST AG, KAEFER SE and Co., Krosaki Harima Corp., Magnezit Group, Minerals Technologies Inc., Morgan Advanced Materials, Refratechnik Holding, RHI Magnesita GmbH, SCR Sibelco NV, Shinagawa Refractories., Vesuvius Plc are a few of the key vendors in the Refractory Materials market.

APAC will register the highest growth rate of 68.3% among the other regions. Therefore, the Refractory Materials market in APAC is expected to garner significant business opportunities for the vendors during the forecast period.

China, India, Japan, South Korea, Australia, Indonesia, Germany, France, UK, Italy, Spain, The Netherlands, US, Canada, Mexico, Brazil, Argentina, Colombia, Saudi Arabia, UAE, South Africa, Israel, Turkey

  • Sustained global demand and capacity expansion in core end-use industries is the driving factor this market.

The Refractory Materials market vendors should focus on grabbing business opportunities from the Product type segment as it accounted for the largest market share in the base year.