Vehicle To Grid Market Analysis, Size, and Forecast 2025-2029: North America (US and Canada), Europe (France, Germany, Italy, Spain, UK), APAC (China, Japan, South Korea), Middle East and Africa , and South America

Vehicle To Grid Market Analysis, Size, and Forecast 2025-2029:
North America (US and Canada), Europe (France, Germany, Italy, Spain, UK), APAC (China, Japan, South Korea), Middle East and Africa , and South America

Published: Mar 2025 238 Pages SKU: IRTNTR43777

Market Overview at a Glance

$115.62 B
Market Opportunity
49.7%
CAGR
37.7
YoY growth 2024-2025(%)

Vehicle To Grid Market Size 2025-2029

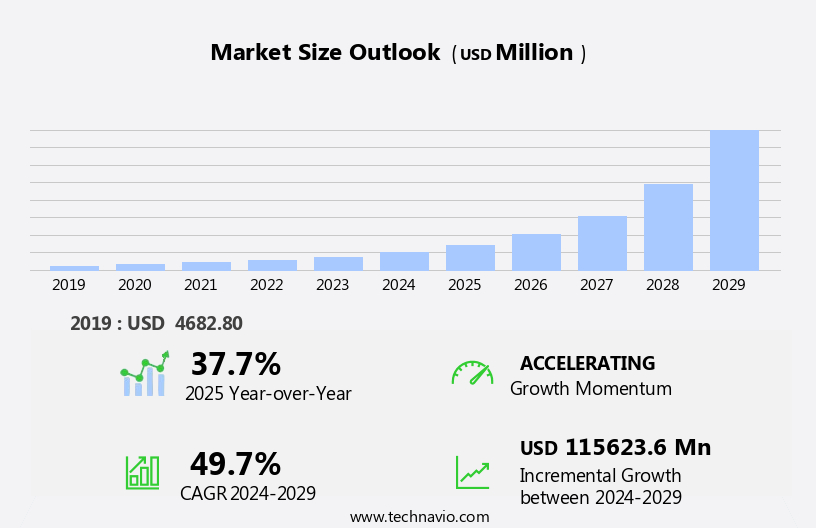
The vehicle to grid market size is forecast to increase by USD 115.62 billion, at a CAGR of 49.7% between 2024 and 2029.

  • The Vehicle to Grid (V2G) market is experiencing significant growth, driven by advancements in Electric Vehicle (EV) battery technology and the increasing number of EV charging stations. These factors are creating new opportunities for energy storage and grid management solutions. However, interoperability issues pose a significant challenge to the market's growth. EV batteries are becoming more efficient and powerful, enabling them to store excess energy generated during off-peak hours and release it back to the grid during peak demand. This two-way energy flow not only benefits the grid by balancing supply and demand but also provides financial incentives for EV owners.
  • The growing number of EV charging stations further expands the potential market for V2G technology. Despite these opportunities, interoperability issues persist as a major obstacle. The lack of standardized communication protocols between EVs, charging stations, and the grid can hinder the seamless integration of V2G systems. Addressing these interoperability challenges through industry collaborations and regulatory initiatives is crucial for the market's growth and the effective implementation of V2G technology. Companies seeking to capitalize on this market should focus on developing interoperable solutions and collaborating with key stakeholders to overcome these challenges.

What will be the Size of the Vehicle To Grid Market during the forecast period?

Vehicle To Grid Market Size

 Request Free Sample

The vehicle-to-grid (V2G) market continues to evolve, driven by the integration of renewable energy sources and the electrification of various transportation sectors. Electric motorcycles, cars, buses, trucks, scooters, and taxis are increasingly becoming part of the grid as they adopt advanced technologies such as energy storage, battery management systems, and artificial intelligence. These innovations enable these vehicles to provide ancillary services, including frequency regulation, voltage support, and peak shaving, to the grid. Moreover, the integration of renewable energy sources like wind power and solar PV into the grid necessitates the need for load management and power flow optimization.

Smart grid technologies, such as demand response, power electronics, and data analytics, are crucial in managing the intermittency and variability of renewable energy sources. Charging station infrastructure, including private and public charging stations, wireless communication, and fast charging, plays a significant role in the V2G market's growth. Battery degradation, battery life cycle, and battery recycling are critical considerations in ensuring the sustainability and efficiency of the V2G market. Furthermore, emerging technologies like inductive charging, bidirectional charging, and vehicle-to-vehicle communication are revolutionizing the way vehicles interact with the grid and each other. Blockchain technology is also gaining traction in the V2G market, enabling secure and transparent energy trading and battery capacity management.

The V2G market's continuous dynamism is reflected in its applications across various sectors, including transportation electrification, environmental sustainability, and grid modernization. The integration of geothermal power and solid-state batteries is expected to further expand the market's potential. Overall, the V2G market's evolution is a testament to the ongoing unfolding of market activities and evolving patterns in the renewable energy sector.

How is this Vehicle To Grid Industry segmented?

The vehicle to grid industry research report provides comprehensive data (region-wise segment analysis), with forecasts and estimates in "USD million" for the period 2025-2029, as well as historical data from 2019-2023 for the following segments.

  • Product
    • Power electronics
    • Software
  • Vehicle Type
    • BEV
    • PHEV
    • FCEV
  • Charging
    • DC
    • AC
  • Application
    • Commercial
    • Individual
  • Geography
    • North America
      • US
      • Canada
    • Europe
      • France
      • Germany
      • Italy
      • Spain
      • UK
    • APAC
      • China
      • Japan
      • South Korea
    • South America
      • Brazil
      • Argentina
    • Middle East and Africa
      • UAE
    • Rest of World (ROW)

By Product Insights

The power electronics segment is estimated to witness significant growth during the forecast period.

The wind power sector is witnessing significant growth as renewable energy integration becomes a priority. Electric motorcycles and scooters are joining the electric vehicle (EV) revolution, expanding the market scope. Load management systems optimize energy usage and efficiency, enhancing the integration of renewable energy sources. Artificial intelligence and machine learning algorithms are essential for managing complex power grids, ensuring grid stability and frequency regulation. Energy storage solutions, including battery management systems and utility-scale batteries, play a crucial role in managing the variability of renewable energy sources. Bidirectional charging technologies enable EVs to act as energy storage systems, providing voltage support and frequency regulation services to the grid.

Charging station infrastructure, including wireless and inductive charging, is evolving to meet the demands of fleet electrification and smart city initiatives. Thermal management systems are essential for maintaining battery efficiency and extending battery life cycle. Fast charging and power flow optimization are essential for the widespread adoption of EVs. Smart grid technologies, such as power electronics and demand response, enable efficient energy usage and peak shaving. Lithium-ion batteries remain the dominant battery chemistry, but solid-state batteries and battery recycling are gaining attention for their potential to improve energy density and reduce carbon emissions. Blockchain technology and vehicle-to-vehicle communication are transforming the EV market by enabling peer-to-peer energy trading and optimizing the charging process.

Grid modernization and the expansion of public charging stations are crucial for the successful implementation of transportation electrification. Electric buses, taxis, and trucks are significant contributors to the growing EV market. Solar PV and geothermal power are essential renewable energy sources for charging infrastructure. In conclusion, the EV market is experiencing exponential growth, driven by renewable energy integration, fleet electrification, and the development of advanced charging technologies. Drive systems, power electronics, and communication equipment are critical components for enabling bi-directional flow and communication between vehicles and the grid. The market's future is promising, with innovations in battery technology, grid modernization, and smart city initiatives.

Vehicle To Grid Market Size

Request Free Sample

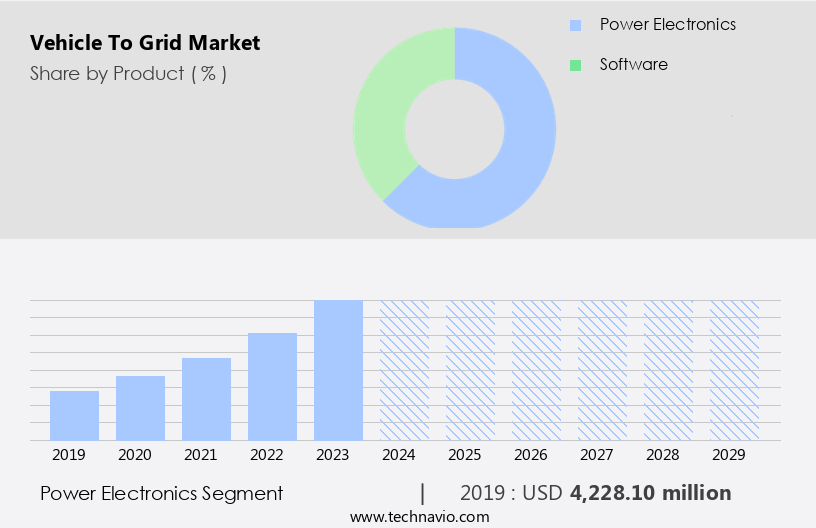
The Power electronics segment was valued at USD 4.23 billion in 2019 and showed a gradual increase during the forecast period.

Regional Analysis

North America is estimated to contribute 35% to the growth of the global market during the forecast period.Technavio's analysts have elaborately explained the regional trends and drivers that shape the market during the forecast period.

Vehicle To Grid Market Share by Geography

 Request Free Sample

The US market for Vehicle to Grid (V2G) technology is experiencing significant growth in North America, driven by substantial investments in infrastructure development and deployment. This expansion is further fueled by aggressive government initiatives to promote the adoption of battery electric vehicles (BEV) and plug-in hybrid electric vehicles (PHEV) in the region. By integrating EVs into the power grid, utilities can save costs and EV owners can offset their overall ownership expenses through revenue generation. For instance, a government fleet of plug-in electric vehicles (PEVs) in Southern California, US, can earn up to USD100/month per vehicle by providing regulation services to the California Independent System Operator (CAISO) market.

Integration of renewable energy sources, such as wind power, into the grid is another key factor driving the V2G market. Energy storage solutions, including battery management systems and utility-scale batteries, play a crucial role in the efficient integration of renewable energy. Artificial intelligence and data analytics enable smart grid technologies, enabling power flow optimization and demand response. Moreover, the adoption of electric vehicles (EVs) is expanding beyond cars to include motorcycles, buses, trucks, scooters, and taxis. Fleet electrification and the deployment of private charging stations are essential components of this trend. Fast charging and wireless communication technologies facilitate the convenience and accessibility of charging infrastructure.

Battery degradation, thermal management, and battery life cycle are critical concerns in the V2G market. Innovations in battery chemistry, such as solid-state batteries, and battery recycling are addressing these challenges. Additionally, bidirectional charging, vehicle-to-vehicle communication, and grid modernization are essential for optimizing the overall efficiency of the grid and reducing carbon emissions. The integration of renewable energy sources, such as solar PV and geothermal power, with the grid through V2G technology is crucial for peak shaving and carbon emission reduction. Energy trading platforms and battery capacity are essential components of this process. Voltage support, distributed generation, and demand response are also critical aspects of grid integration.

In conclusion, the V2G market in the US is witnessing substantial growth due to the integration of EVs into the power grid, the adoption of renewable energy sources, and the development of advanced technologies, such as artificial intelligence, energy storage, and smart grid technologies. These trends are shaping the future of transportation electrification and the modernization of the power grid.

Market Dynamics

The Vehicle-to-Grid (V2G) Market is revolutionizing energy systems with vehicle-to-grid systems and bidirectional chargers, enabling electric vehicle supply equipment (EVSE) to support smart grid integration. Battery electric vehicles (BEVs) for V2G dominate, particularly in the residential V2G market, offering energy cost savings with V2G and sustainable energy management. Applications like peak shaving with V2G and renewable energy integration enhance grid stability, while V2G software solutions and AI for V2G energy management optimize performance. Innovations such as V2G-enabled electric vehicles and blockchain for V2G energy trading drive growth. Exploring how to implement V2G for home energy and V2G technology trends for 2025 ensures scalability, with bidirectional charging for electric vehicles and cost savings with vehicle-to-grid technology attracting EV owners.

Our researchers analyzed the data with 2024 as the base year, along with the key drivers, trends, and challenges. A holistic analysis of drivers will help companies refine their marketing strategies to gain a competitive advantage.

What are the key market drivers leading to the rise in the adoption of Vehicle To Grid Industry?

  • The advancements in EV (Electric Vehicle) battery technology serve as the primary catalyst for market growth. 
  • The Electric Vehicle (EV) market is experiencing significant growth due to the increasing demand for energy independence and government support. As more EVs are adopted, the limitations of existing charging technologies are becoming apparent. To address these challenges, substantial investments are being made in research and development. Over the years, advancements in EV technology have led to reduced battery costs and increased energy densities. This, in turn, has resulted in higher-capacity batteries. With the widespread availability of charging infrastructure, the market for bidirectional charging, solar PV integration, peak shaving, and energy trading is also growing.
  • Technological advancements in EVs, such as lithium-ion batteries, grid integration, voltage support, distributed generation, and EV fleet management, are enabling the integration of EVs into the power grid. These developments contribute to carbon emission reduction and the promotion of renewable energy sources.

What are the market trends shaping the Vehicle To Grid Industry?

  • The rising demand for electric vehicles (EVs) is driving the market trend towards an expansion in the number of EV charging stations. This growth is essential for addressing the increasing need for convenient and accessible charging infrastructure to support the widespread adoption of EVs.
  • Electric vehicles (EVs) are gaining popularity as a sustainable transportation alternative, with wind power being a significant contributor to their charging sources. However, the limited range of EVs necessitates an increased number of charging facilities to boost their adoption. Government organizations are taking steps to address this need, such as expanding the number of public EV charging stations. For instance, India currently has over 12,000 operational charging stations, a notable increase from the previous year. Charging stations serve as crucial infrastructure for the development of vehicle-to-grid (V2G) technology. V2G enables EVs to provide energy back to the grid during peak demand periods, enhancing renewable energy integration and energy efficiency.
  • This two-way energy flow also benefits thermal management and frequency regulation. Advanced technologies, such as artificial intelligence, energy storage, and battery management systems, facilitate V2G's seamless integration. Moreover, innovative charging solutions like inductive charging and vehicle-to-infrastructure communication further improve the overall efficiency of the charging process. Additionally, blockchain technology can ensure secure and transparent energy transactions between EVs and the grid. In conclusion, the integration of V2G technology into EV charging infrastructure is a promising development in the renewable energy sector, offering benefits for both energy providers and consumers.

What challenges does the Vehicle To Grid Industry face during its growth?

  • Interoperability issues represent a significant challenge to the growth of the industry, limiting the seamless exchange and integration of data and processes between different systems and organizations. 
  • The integration of electric vehicles (EVs) into the power grid, also known as Vehicle to Grid (V2G), plays a significant role in addressing peak hour demands, regulating grid voltage fluctuations, and balancing intermittent renewable energy generation. To ensure seamless interaction between charging stations, EVs, and communication and control systems, several key factors must be considered. Firstly, a reference architecture is necessary for facilitating interoperability requirements. This includes adhering to codes and standards, implementing advanced metering infrastructure, and securing systems. These factors enable higher-level grid integration by allowing smooth communication between components. However, the independent design of various V2G technologies by different organizations necessitates compatibility with a standard, which may not be fully harmonized with other technologies.
  • Moreover, the adoption of renewable energy sources like geothermal power and the advancement of battery technologies, such as solid-state batteries, are crucial in the growth of the V2G market. Fast charging and power flow optimization, achieved through power electronics and smart grid technologies, are also essential components of this market. Electric cars, trucks, scooters, and other EVs are expected to contribute significantly to the increasing demand for V2G systems. In conclusion, the successful integration of EVs into the power grid through V2G technology is essential for managing the increasing demand for renewable energy and ensuring grid stability.
  • By focusing on the key factors mentioned above, we can create a harmonized and efficient system that benefits both the power grid and EV users. Recent research indicates that this market will continue to grow as more organizations invest in V2G technology and the adoption of electric vehicles becomes more widespread.

Exclusive Customer Landscape

The vehicle to grid market forecasting report includes the adoption lifecycle of the market, covering from the innovator's stage to the laggard's stage. It focuses on adoption rates in different regions based on penetration. Furthermore, the vehicle to grid market report also includes key purchase criteria and drivers of price sensitivity to help companies evaluate and develop their market growth analysis strategies.

Vehicle To Grid Market Share by Geography

 Customer Landscape

Key Companies & Market Insights

Companies are implementing various strategies, such as strategic alliances, vehicle to grid market forecast, partnerships, mergers and acquisitions, geographical expansion, and product/service launches, to enhance their presence in the industry.

ABB Ltd. - The company specializes in vehicle-to-grid (V2G) technology, enabling temporary power supply to homes and buildings during power interruptions. V2G solutions leverage electric vehicles as mobile energy storage systems, providing an alternative power source during grid outages. This innovative approach to energy management offers increased resilience and reliability, bridging the gap between transportation and electricity sectors. By intelligently managing energy flow between vehicles and buildings, V2G solutions contribute to a more sustainable and flexible energy infrastructure.

The industry research and growth report includes detailed analyses of the competitive landscape of the market and information about key companies, including:

  • ABB Ltd.
  • AC Propulsion Inc.
  • ChargePoint Holdings Inc.
  • Continental AG
  • Coritech Services
  • Edison International
  • Fermata LLC
  • Ford Motor Co.
  • Hitachi Ltd.
  • Honda Motor Co. Ltd.
  • Liikennevirta Oy Ltd.
  • Mercedes Benz Group AG
  • Mitsubishi Motors Corp.
  • Nuvve Holding Corp.
  • OVO Energy Ltd.
  • Qualcomm Inc.
  • Renault SAS
  • Tesla Inc.
  • TransnetBW GmbH
  • Wallbox N.V.

Qualitative and quantitative analysis of companies has been conducted to help clients understand the wider business environment as well as the strengths and weaknesses of key industry players. Data is qualitatively analyzed to categorize companies as pure play, category-focused, industry-focused, and diversified; it is quantitatively analyzed to categorize companies as dominant, leading, strong, tentative, and weak.

Recent Development and News in Vehicle To Grid Market

  • In February 2023, Ford and Volkswagen announced a strategic collaboration to develop vehicle-to-grid (V2G) technology, aiming to create a more sustainable energy system by enabling electric vehicles (EVs) to sell excess energy back to the grid. This partnership represents a significant step towards integrating EVs into the power grid and promoting renewable energy adoption (Ford Media Center, 2023).
  • In October 2024, Tesla received approval from the California Public Utilities Commission to deploy its V2G technology at a large scale, making it the first utility-scale V2G project in the United States. This approval marks a major milestone for Tesla and the V2G market, demonstrating the viability of large-scale energy storage and grid integration using EVs (Tesla Investor Relations, 2024).
  • In March 2025, Nissan and Enel X, an Italian energy technology company, announced a partnership to deploy V2G infrastructure in Europe. This collaboration involves installing V2G systems in Nissan's electric vehicle fleet and integrating them into Enel X's energy management platform. The partnership aims to provide grid stability and promote the adoption of renewable energy (Nissan Newsroom, 2025).
  • In June 2025, ABB, a leading technology provider, secured a USD20 million contract from the New York Power Authority to deploy V2G infrastructure in the US state. This project involves installing V2G systems in over 1,000 electric vehicles, enabling them to provide grid services and support the integration of renewable energy sources (ABB, 2025). These developments underscore the growing importance of V2G technology in promoting grid stability, integrating renewable energy, and creating a more sustainable energy system.

Research Analyst Overview

  • The vehicle-to-grid (V2G) market is witnessing significant activity and trends as electric mobility gains traction. Energy trading platforms enable electric vehicles (EVs) to sell excess energy back to the grid, promoting social impact and economic benefits. Energy consumption optimization and battery health monitoring are crucial for maximizing the value of this two-way energy flow. Data privacy is a key concern in the V2G market, with the need for secure and open standards to protect consumer information. Charging time reduction and smart grid deployment are essential for enhancing the future of mobility and increasing EV adoption.
  • Electric vehicle aggregators play a vital role in managing the grid's power quality and synchronization, ensuring grid security and power system stability. Technology innovation in battery pack design, V2X communication, and autonomous vehicles is driving the market forward. Government policy and EV incentives are significant factors influencing the market's economic impact. Battery swapping and charging infrastructure development are also crucial for advancing the V2G market and promoting the adoption of electric vehicles.

Dive into Technavio's robust research methodology, blending expert interviews, extensive data synthesis, and validated models for unparalleled Vehicle To Grid Market insights. See full methodology.

Market Scope

Report Coverage

Details

Page number

238

Base year

2024

Historic period

2019-2023

Forecast period

2025-2029

Growth momentum & CAGR

Accelerate at a CAGR of 49.7%

Market growth 2025-2029

USD 115623.6 million

Market structure

Fragmented

YoY growth 2024-2025(%)

37.7

Key countries

US, Japan, Germany, Canada, UK, France, South Korea, China, Italy, and Spain

Competitive landscape

Leading Companies, Market Positioning of Companies, Competitive Strategies, and Industry Risks

Request Free Sample

What are the Key Data Covered in this Vehicle To Grid Market Research and Growth Report?

  • CAGR of the Vehicle To Grid industry during the forecast period
  • Detailed information on factors that will drive the growth and forecasting between 2025 and 2029
  • Precise estimation of the size of the market and its contribution of the industry in focus to the parent market
  • Accurate predictions about upcoming growth and trends and changes in consumer behaviour
  • Growth of the market across North America, Europe, APAC, Middle East and Africa, and South America
  • Thorough analysis of the market's competitive landscape and detailed information about companies
  • Comprehensive analysis of factors that will challenge the vehicle to grid market growth of industry companies

We can help! Our analysts can customize this vehicle to grid market research report to meet your requirements.

Get in touch

1 Executive Summary

  • 1.1 Market overview
    • Executive Summary - Chart on Market Overview
    • Executive Summary - Data Table on Market Overview
    • Executive Summary - Chart on Global Market Characteristics
    • Executive Summary - Chart on Market by Geography
    • Executive Summary - Chart on Market Segmentation by Product
    • Executive Summary - Chart on Market Segmentation by Vehicle Type
    • Executive Summary - Chart on Market Segmentation by Charging
    • Executive Summary - Chart on Market Segmentation by Application
    • Executive Summary - Chart on Incremental Growth
    • Executive Summary - Data Table on Incremental Growth
    • Executive Summary - Chart on Company Market Positioning

2 Technavio Analysis

  • 2.1 Analysis of price sensitivity, lifecycle, customer purchase basket, adoption rates, and purchase criteria
    • Analysis of price sensitivity, lifecycle, customer purchase basket, adoption rates, and purchase criteria
  • 2.2 Criticality of inputs and Factors of differentiation
    • Overview on criticality of inputs and factors of differentiation
  • 2.3 Factors of disruption
    • Overview on factors of disruption
  • 2.4 Impact of drivers and challenges
    • Impact of drivers and challenges in 2024 and 2029

3 Market Landscape

  • 3.1 Market ecosystem
    • Parent Market
    • Data Table on - Parent Market
  • 3.2 Market characteristics
    • Market characteristics analysis
  • 3.3 Value chain analysis
    • Value chain analysis

4 Market Sizing

  • 4.1 Market definition
    • Offerings of companies included in the market definition
  • 4.2 Market segment analysis
    • Market segments
  • 4.3 Market size 2024
    • 4.4 Market outlook: Forecast for 2024-2029
      • Chart on Global - Market size and forecast 2024-2029 ($ million)
      • Data Table on Global - Market size and forecast 2024-2029 ($ million)
      • Chart on Global Market: Year-over-year growth 2024-2029 (%)
      • Data Table on Global Market: Year-over-year growth 2024-2029 (%)

    5 Historic Market Size

    • 5.1 Global Vehicle To Grid Market 2019 - 2023
      • Historic Market Size - Data Table on Global Vehicle To Grid Market 2019 - 2023 ($ million)
    • 5.2 Product segment analysis 2019 - 2023
      • Historic Market Size - Product Segment 2019 - 2023 ($ million)
    • 5.3 Vehicle Type segment analysis 2019 - 2023
      • Historic Market Size - Vehicle Type Segment 2019 - 2023 ($ million)
    • 5.4 Charging segment analysis 2019 - 2023
      • Historic Market Size - Charging Segment 2019 - 2023 ($ million)
    • 5.5 Application segment analysis 2019 - 2023
      • Historic Market Size - Application Segment 2019 - 2023 ($ million)
    • 5.6 Geography segment analysis 2019 - 2023
      • Historic Market Size - Geography Segment 2019 - 2023 ($ million)
    • 5.7 Country segment analysis 2019 - 2023
      • Historic Market Size - Country Segment 2019 - 2023 ($ million)

    6 Qualitative Analysis

    • 6.1 The impact of AI on global vehicle to grid market

      7 Five Forces Analysis

      • 7.1 Five forces summary
        • Five forces analysis - Comparison between 2024 and 2029
      • 7.2 Bargaining power of buyers
        • Bargaining power of buyers - Impact of key factors 2024 and 2029
      • 7.3 Bargaining power of suppliers
        • Bargaining power of suppliers - Impact of key factors in 2024 and 2029
      • 7.4 Threat of new entrants
        • Threat of new entrants - Impact of key factors in 2024 and 2029
      • 7.5 Threat of substitutes
        • Threat of substitutes - Impact of key factors in 2024 and 2029
      • 7.6 Threat of rivalry
        • Threat of rivalry - Impact of key factors in 2024 and 2029
      • 7.7 Market condition
        • Chart on Market condition - Five forces 2024 and 2029

      8 Market Segmentation by Product

      • 8.1 Market segments
        • Chart on Product - Market share 2024-2029 (%)
        • Data Table on Product - Market share 2024-2029 (%)
      • 8.2 Comparison by Product
        • Chart on Comparison by Product
        • Data Table on Comparison by Product
      • 8.3 Power electronics - Market size and forecast 2024-2029
        • Chart on Power electronics - Market size and forecast 2024-2029 ($ million)
        • Data Table on Power electronics - Market size and forecast 2024-2029 ($ million)
        • Chart on Power electronics - Year-over-year growth 2024-2029 (%)
        • Data Table on Power electronics - Year-over-year growth 2024-2029 (%)
      • 8.4 Software - Market size and forecast 2024-2029
        • Chart on Software - Market size and forecast 2024-2029 ($ million)
        • Data Table on Software - Market size and forecast 2024-2029 ($ million)
        • Chart on Software - Year-over-year growth 2024-2029 (%)
        • Data Table on Software - Year-over-year growth 2024-2029 (%)
      • 8.5 Market opportunity by Product
        • Market opportunity by Product ($ million)
        • Data Table on Market opportunity by Product ($ million)

      9 Market Segmentation by Vehicle Type

      • 9.1 Market segments
        • Chart on Vehicle Type - Market share 2024-2029 (%)
        • Data Table on Vehicle Type - Market share 2024-2029 (%)
      • 9.2 Comparison by Vehicle Type
        • Chart on Comparison by Vehicle Type
        • Data Table on Comparison by Vehicle Type
      • 9.3 BEV - Market size and forecast 2024-2029
        • Chart on BEV - Market size and forecast 2024-2029 ($ million)
        • Data Table on BEV - Market size and forecast 2024-2029 ($ million)
        • Chart on BEV - Year-over-year growth 2024-2029 (%)
        • Data Table on BEV - Year-over-year growth 2024-2029 (%)
      • 9.4 PHEV - Market size and forecast 2024-2029
        • Chart on PHEV - Market size and forecast 2024-2029 ($ million)
        • Data Table on PHEV - Market size and forecast 2024-2029 ($ million)
        • Chart on PHEV - Year-over-year growth 2024-2029 (%)
        • Data Table on PHEV - Year-over-year growth 2024-2029 (%)
      • 9.5 FCEV - Market size and forecast 2024-2029
        • Chart on FCEV - Market size and forecast 2024-2029 ($ million)
        • Data Table on FCEV - Market size and forecast 2024-2029 ($ million)
        • Chart on FCEV - Year-over-year growth 2024-2029 (%)
        • Data Table on FCEV - Year-over-year growth 2024-2029 (%)
      • 9.6 Market opportunity by Vehicle Type
        • Market opportunity by Vehicle Type ($ million)
        • Data Table on Market opportunity by Vehicle Type ($ million)

      10 Market Segmentation by Charging

      • 10.1 Market segments
        • Chart on Charging - Market share 2024-2029 (%)
        • Data Table on Charging - Market share 2024-2029 (%)
      • 10.2 Comparison by Charging
        • Chart on Comparison by Charging
        • Data Table on Comparison by Charging
      • 10.3 DC - Market size and forecast 2024-2029
        • Chart on DC - Market size and forecast 2024-2029 ($ million)
        • Data Table on DC - Market size and forecast 2024-2029 ($ million)
        • Chart on DC - Year-over-year growth 2024-2029 (%)
        • Data Table on DC - Year-over-year growth 2024-2029 (%)
      • 10.4 AC - Market size and forecast 2024-2029
        • Chart on AC - Market size and forecast 2024-2029 ($ million)
        • Data Table on AC - Market size and forecast 2024-2029 ($ million)
        • Chart on AC - Year-over-year growth 2024-2029 (%)
        • Data Table on AC - Year-over-year growth 2024-2029 (%)
      • 10.5 DC and AC - Market size and forecast 2024-2029
        • Chart on DC and AC - Market size and forecast 2024-2029 ($ million)
        • Data Table on DC and AC - Market size and forecast 2024-2029 ($ million)
        • Chart on DC and AC - Year-over-year growth 2024-2029 (%)
        • Data Table on DC and AC - Year-over-year growth 2024-2029 (%)
      • 10.6 Market opportunity by Charging
        • Market opportunity by Charging ($ million)
        • Data Table on Market opportunity by Charging ($ million)

      11 Market Segmentation by Application

      • 11.1 Market segments
        • Chart on Application - Market share 2024-2029 (%)
        • Data Table on Application - Market share 2024-2029 (%)
      • 11.2 Comparison by Application
        • Chart on Comparison by Application
        • Data Table on Comparison by Application
      • 11.3 Commercial - Market size and forecast 2024-2029
        • Chart on Commercial - Market size and forecast 2024-2029 ($ million)
        • Data Table on Commercial - Market size and forecast 2024-2029 ($ million)
        • Chart on Commercial - Year-over-year growth 2024-2029 (%)
        • Data Table on Commercial - Year-over-year growth 2024-2029 (%)
      • 11.4 Individual - Market size and forecast 2024-2029
        • Chart on Individual - Market size and forecast 2024-2029 ($ million)
        • Data Table on Individual - Market size and forecast 2024-2029 ($ million)
        • Chart on Individual - Year-over-year growth 2024-2029 (%)
        • Data Table on Individual - Year-over-year growth 2024-2029 (%)
      • 11.5 Commercial and individual - Market size and forecast 2024-2029
        • Chart on Commercial and individual - Market size and forecast 2024-2029 ($ million)
        • Data Table on Commercial and individual - Market size and forecast 2024-2029 ($ million)
        • Chart on Commercial and individual - Year-over-year growth 2024-2029 (%)
        • Data Table on Commercial and individual - Year-over-year growth 2024-2029 (%)
      • 11.6 Market opportunity by Application
        • Market opportunity by Application ($ million)
        • Data Table on Market opportunity by Application ($ million)

      12 Customer Landscape

      • 12.1 Customer landscape overview
        • Analysis of price sensitivity, lifecycle, customer purchase basket, adoption rates, and purchase criteria

      13 Geographic Landscape

      • 13.1 Geographic segmentation
        • Chart on Market share by geography 2024-2029 (%)
        • Data Table on Market share by geography 2024-2029 (%)
      • 13.2 Geographic comparison
        • Chart on Geographic comparison
        • Data Table on Geographic comparison
      • 13.3 North America - Market size and forecast 2024-2029
        • Chart on North America - Market size and forecast 2024-2029 ($ million)
        • Data Table on North America - Market size and forecast 2024-2029 ($ million)
        • Chart on North America - Year-over-year growth 2024-2029 (%)
        • Data Table on North America - Year-over-year growth 2024-2029 (%)
      • 13.4 Europe - Market size and forecast 2024-2029
        • Chart on Europe - Market size and forecast 2024-2029 ($ million)
        • Data Table on Europe - Market size and forecast 2024-2029 ($ million)
        • Chart on Europe - Year-over-year growth 2024-2029 (%)
        • Data Table on Europe - Year-over-year growth 2024-2029 (%)
      • 13.5 APAC - Market size and forecast 2024-2029
        • Chart on APAC - Market size and forecast 2024-2029 ($ million)
        • Data Table on APAC - Market size and forecast 2024-2029 ($ million)
        • Chart on APAC - Year-over-year growth 2024-2029 (%)
        • Data Table on APAC - Year-over-year growth 2024-2029 (%)
      • 13.6 Middle East and Africa - Market size and forecast 2024-2029
        • Chart on Middle East and Africa - Market size and forecast 2024-2029 ($ million)
        • Data Table on Middle East and Africa - Market size and forecast 2024-2029 ($ million)
        • Chart on Middle East and Africa - Year-over-year growth 2024-2029 (%)
        • Data Table on Middle East and Africa - Year-over-year growth 2024-2029 (%)
      • 13.7 South America - Market size and forecast 2024-2029
        • Chart on South America - Market size and forecast 2024-2029 ($ million)
        • Data Table on South America - Market size and forecast 2024-2029 ($ million)
        • Chart on South America - Year-over-year growth 2024-2029 (%)
        • Data Table on South America - Year-over-year growth 2024-2029 (%)
      • 13.8 US - Market size and forecast 2024-2029
        • Chart on US - Market size and forecast 2024-2029 ($ million)
        • Data Table on US - Market size and forecast 2024-2029 ($ million)
        • Chart on US - Year-over-year growth 2024-2029 (%)
        • Data Table on US - Year-over-year growth 2024-2029 (%)
      • 13.9 Japan - Market size and forecast 2024-2029
        • Chart on Japan - Market size and forecast 2024-2029 ($ million)
        • Data Table on Japan - Market size and forecast 2024-2029 ($ million)
        • Chart on Japan - Year-over-year growth 2024-2029 (%)
        • Data Table on Japan - Year-over-year growth 2024-2029 (%)
      • 13.10 Germany - Market size and forecast 2024-2029
        • Chart on Germany - Market size and forecast 2024-2029 ($ million)
        • Data Table on Germany - Market size and forecast 2024-2029 ($ million)
        • Chart on Germany - Year-over-year growth 2024-2029 (%)
        • Data Table on Germany - Year-over-year growth 2024-2029 (%)
      • 13.11 Canada - Market size and forecast 2024-2029
        • Chart on Canada - Market size and forecast 2024-2029 ($ million)
        • Data Table on Canada - Market size and forecast 2024-2029 ($ million)
        • Chart on Canada - Year-over-year growth 2024-2029 (%)
        • Data Table on Canada - Year-over-year growth 2024-2029 (%)
      • 13.12 UK - Market size and forecast 2024-2029
        • Chart on UK - Market size and forecast 2024-2029 ($ million)
        • Data Table on UK - Market size and forecast 2024-2029 ($ million)
        • Chart on UK - Year-over-year growth 2024-2029 (%)
        • Data Table on UK - Year-over-year growth 2024-2029 (%)
      • 13.13 China - Market size and forecast 2024-2029
        • Chart on China - Market size and forecast 2024-2029 ($ million)
        • Data Table on China - Market size and forecast 2024-2029 ($ million)
        • Chart on China - Year-over-year growth 2024-2029 (%)
        • Data Table on China - Year-over-year growth 2024-2029 (%)
      • 13.14 France - Market size and forecast 2024-2029
        • Chart on France - Market size and forecast 2024-2029 ($ million)
        • Data Table on France - Market size and forecast 2024-2029 ($ million)
        • Chart on France - Year-over-year growth 2024-2029 (%)
        • Data Table on France - Year-over-year growth 2024-2029 (%)
      • 13.15 South Korea - Market size and forecast 2024-2029
        • Chart on South Korea - Market size and forecast 2024-2029 ($ million)
        • Data Table on South Korea - Market size and forecast 2024-2029 ($ million)
        • Chart on South Korea - Year-over-year growth 2024-2029 (%)
        • Data Table on South Korea - Year-over-year growth 2024-2029 (%)
      • 13.16 Italy - Market size and forecast 2024-2029
        • Chart on Italy - Market size and forecast 2024-2029 ($ million)
        • Data Table on Italy - Market size and forecast 2024-2029 ($ million)
        • Chart on Italy - Year-over-year growth 2024-2029 (%)
        • Data Table on Italy - Year-over-year growth 2024-2029 (%)
      • 13.17 Spain - Market size and forecast 2024-2029
        • Chart on Spain - Market size and forecast 2024-2029 ($ million)
        • Data Table on Spain - Market size and forecast 2024-2029 ($ million)
        • Chart on Spain - Year-over-year growth 2024-2029 (%)
        • Data Table on Spain - Year-over-year growth 2024-2029 (%)
      • 13.18 Market opportunity by geography
        • Market opportunity by geography ($ million)
        • Data Tables on Market opportunity by geography ($ million)

      14 Drivers, Challenges, and Opportunity/Restraints

      • 14.1 Market drivers
        • 14.2 Market challenges
          • 14.3 Impact of drivers and challenges
            • Impact of drivers and challenges in 2024 and 2029
          • 14.4 Market opportunities/restraints

            15 Competitive Landscape

            • 15.1 Overview
              • 15.2 Competitive Landscape
                • Overview on criticality of inputs and factors of differentiation
              • 15.3 Landscape disruption
                • Overview on factors of disruption
              • 15.4 Industry risks
                • Impact of key risks on business

              16 Competitive Analysis

              • 16.1 Companies profiled
                • Companies covered
              • 16.2 Company ranking index
                • Company ranking index
              • 16.3 Market positioning of companies
                • Matrix on companies position and classification
              • 16.4 ABB Ltd.
                • ABB Ltd. - Overview
                • ABB Ltd. - Business segments
                • ABB Ltd. - Key news
                • ABB Ltd. - Key offerings
                • ABB Ltd. - Segment focus
                • SWOT
              • 16.5 AC Propulsion Inc.
                • AC Propulsion Inc. - Overview
                • AC Propulsion Inc. - Product / Service
                • AC Propulsion Inc. - Key offerings
                • SWOT
              • 16.6 Coritech Services
                • Coritech Services - Overview
                • Coritech Services - Product / Service
                • Coritech Services - Key offerings
                • SWOT
              • 16.7 Edison International
                • Edison International - Overview
                • Edison International - Business segments
                • Edison International - Key offerings
                • Edison International - Segment focus
                • SWOT
              • 16.8 Ford Motor Co.
                • Ford Motor Co. - Overview
                • Ford Motor Co. - Business segments
                • Ford Motor Co. - Key offerings
                • Ford Motor Co. - Segment focus
                • SWOT
              • 16.9 Hitachi Ltd.
                • Hitachi Ltd. - Overview
                • Hitachi Ltd. - Business segments
                • Hitachi Ltd. - Key news
                • Hitachi Ltd. - Key offerings
                • Hitachi Ltd. - Segment focus
                • SWOT
              • 16.10 Honda Motor Co. Ltd.
                • Honda Motor Co. Ltd. - Overview
                • Honda Motor Co. Ltd. - Business segments
                • Honda Motor Co. Ltd. - Key news
                • Honda Motor Co. Ltd. - Key offerings
                • Honda Motor Co. Ltd. - Segment focus
                • SWOT
              • 16.11 Liikennevirta Oy Ltd.
                • Liikennevirta Oy Ltd. - Overview
                • Liikennevirta Oy Ltd. - Product / Service
                • Liikennevirta Oy Ltd. - Key offerings
                • SWOT
              • 16.12 Mercedes Benz Group AG
                • Mercedes Benz Group AG - Overview
                • Mercedes Benz Group AG - Product / Service
                • Mercedes Benz Group AG - Key offerings
                • SWOT
              • 16.13 Mitsubishi Motors Corp.
                • Mitsubishi Motors Corp. - Overview
                • Mitsubishi Motors Corp. - Business segments
                • Mitsubishi Motors Corp. - Key news
                • Mitsubishi Motors Corp. - Key offerings
                • Mitsubishi Motors Corp. - Segment focus
                • SWOT
              • 16.14 Nuvve Holding Corp.
                • Nuvve Holding Corp. - Overview
                • Nuvve Holding Corp. - Product / Service
                • Nuvve Holding Corp. - Key offerings
                • SWOT
              • 16.15 Qualcomm Inc.
                • Qualcomm Inc. - Overview
                • Qualcomm Inc. - Business segments
                • Qualcomm Inc. - Key news
                • Qualcomm Inc. - Key offerings
                • Qualcomm Inc. - Segment focus
                • SWOT
              • 16.16 Renault SAS
                • Renault SAS - Overview
                • Renault SAS - Product / Service
                • Renault SAS - Key news
                • Renault SAS - Key offerings
                • SWOT
              • 16.17 Tesla Inc.
                • Tesla Inc. - Overview
                • Tesla Inc. - Business segments
                • Tesla Inc. - Key news
                • Tesla Inc. - Key offerings
                • Tesla Inc. - Segment focus
                • SWOT
              • 16.18 Wallbox N.V.
                • Wallbox N.V. - Overview
                • Wallbox N.V. - Business segments
                • Wallbox N.V. - Key offerings
                • Wallbox N.V. - Segment focus
                • SWOT

              17 Appendix

              • 17.1 Scope of the report
                • 17.2 Inclusions and exclusions checklist
                  • Inclusions checklist
                  • Exclusions checklist
                • 17.3 Currency conversion rates for US$
                  • Currency conversion rates for US$
                • 17.4 Research methodology
                  • Research methodology
                • 17.5 Data procurement
                  • Information sources
                • 17.6 Data validation
                  • Data validation
                • 17.7 Validation techniques employed for market sizing
                  • Validation techniques employed for market sizing
                • 17.8 Data synthesis
                  • Data synthesis
                • 17.9 360 degree market analysis
                  • 360 degree market analysis
                • 17.10 List of abbreviations
                  • List of abbreviations

                Research Methodology

                Technavio presents a detailed picture of the market by way of study, synthesis, and summation of data from multiple sources. The analysts have presented the various facets of the market with a particular focus on identifying the key industry influencers. The data thus presented is comprehensive, reliable, and the result of extensive research, both primary and secondary.

                INFORMATION SOURCES

                Primary sources

                • Manufacturers and suppliers
                • Channel partners
                • Industry experts
                • Strategic decision makers

                Secondary sources

                • Industry journals and periodicals
                • Government data
                • Financial reports of key industry players
                • Historical data
                • Press releases

                DATA ANALYSIS

                Data Synthesis

                • Collation of data
                • Estimation of key figures
                • Analysis of derived insights

                Data Validation

                • Triangulation with data models
                • Reference against proprietary databases
                • Corroboration with industry experts

                REPORT WRITING

                Qualitative

                • Market drivers
                • Market challenges
                • Market trends
                • Five forces analysis

                Quantitative

                • Market size and forecast
                • Market segmentation
                • Geographical insights
                • Competitive landscape

                Interested in this report?

                Get your sample now to see our research methodology and insights!

                Download Now

                Frequently Asked Questions

                Vehicle To Grid market growth will increase by $ 115623.6 mn during 2025-2029 .

                The Vehicle To Grid market is expected to grow at a CAGR of 49.7% during 2025-2029 .

                Vehicle To Grid market is segmented by Product( Power electronics, Software) Vehicle Type( BEV, PHEV, FCEV, MEA, South America) Charging( DC, AC, DC and AC, Middle East and Africa, South America)

                ABB Ltd., AC Propulsion Inc., ChargePoint Holdings Inc., Continental AG, Coritech Services, Edison International, Fermata LLC, Ford Motor Co., Hitachi Ltd., Honda Motor Co. Ltd., Liikennevirta Oy Ltd., Mercedes Benz Group AG, Mitsubishi Motors Corp., Nuvve Holding Corp., OVO Energy Ltd., Qualcomm Inc., Renault SAS, Tesla Inc., TransnetBW GmbH, Wallbox N.V. are a few of the key vendors in the Vehicle To Grid market.

                North America will register the highest growth rate of 35% among the other regions. Therefore, the Vehicle To Grid market in North America is expected to garner significant business opportunities for the vendors during the forecast period.

                US, Japan, Germany, Canada, UK, France, South Korea, China, Italy, Spain

                • Improvements in EV battery technologyThe global rise in the number of EVs is driven by the need for energy independence and support by governments. With the increase in the adoption of EVs is the driving factor this market.
                • existing technologies are being pushed to the limits of their functionalities. Limitations in existing technologies require the development of newer technologies. Therefore is the driving factor this market.
                • a high amount of investments is being made in research and development. Over the years is the driving factor this market.
                • technological advancements in EVs have enabled the reduction of battery costs while increasing their energy densities. Improvements in energy density in EVs result in higher-capacity batteries. The growing number of EVs has resulted in infrastructure for battery charging that is widespread and easily available. Better energy storage options and easy integration into the grid are driving the need for grid integration. Some companies are focusing on opening new EV battery facilities. Such factors will contribute to the growth of the global vehicle to grid market during the forecast period. is the driving factor this market.

                The Vehicle To Grid market vendors should focus on grabbing business opportunities from the Power electronics segment as it accounted for the largest market share in the base year.