Adventure Tourism Market Analysis Europe, APAC, North America, South America, Middle East and Africa - US, China, India, Germany, Canada, Italy, South Korea, Japan, UK, France - Size and Forecast 2025-2029

Adventure Tourism Market Analysis Europe, APAC, North America, South America, Middle East and Africa - US, China, India, Germany, Canada, Italy, South Korea, Japan, UK, France - Size and Forecast 2025-2029

Published: Jan 2025 198 Pages SKU: IRTNTR44576

Market Overview at a Glance

$6867.9 B
Market Opportunity
43.5%
CAGR
35.8
YoY growth 2024-2025(%)

Adventure Tourism Market Size 2025-2029

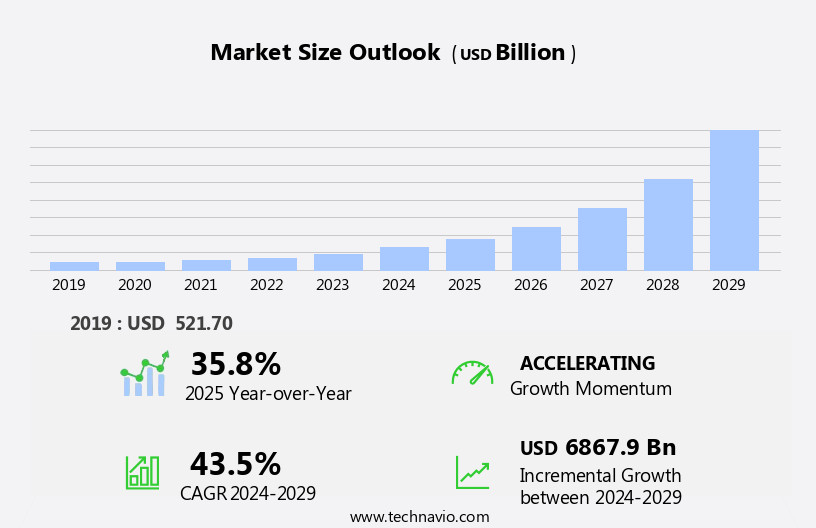
The adventure tourism market size is forecast to increase by USD 6867.9 billion, at a CAGR of 43.5% between 2024 and 2029.

  • The market is experiencing significant growth, driven by increasing disposable incomes and the influence of online reviews on travel decisions. These factors have led to a surge in demand for unique and thrilling experiences, propelling the adventure tourism industry forward. However, the market faces challenges, including the relatively low penetration rate in developing economies. This presents both opportunities and obstacles. On one hand, there is vast untapped potential for growth in these regions. On the other hand, companies must navigate cultural sensitivities, infrastructure limitations, and regulatory complexities to successfully penetrate these markets.
  • To capitalize on the market's momentum, companies should focus on offering innovative, sustainable, and culturally sensitive adventure tourism experiences. By addressing the challenges and embracing the trends, businesses can effectively tap into the growing demand for adventure travel and carve out a competitive position in this dynamic market.

What will be the Size of the Adventure Tourism Market during the forecast period?

Adventure Tourism Market Size

Explore in-depth regional segment analysis with market size data - historical 2019-2023 and forecasts 2025-2029 - in the full report.  
Request Free Sample

Adventure tourism continues to evolve as a dynamic and innovative market, encompassing a wide range of activities and sectors. From hiking and camping to scuba diving and extreme sports, the adventure tourism landscape is characterized by constant growth and change. Outdoor gear plays a crucial role in enabling these experiences, with advancements in technology driving the development of new equipment and apparel. The adventure tourism industry's focus on sustainability is another key trend, with travel insurance and eco-friendly practices becoming increasingly important. Nature photography and wildlife viewing are popular activities that highlight the importance of preserving natural habitats.

Adventure destinations around the world offer unique experiences, each with its own set of regulations and safety considerations. Adventure tourism's economic impact is significant, with infrastructure development and community engagement playing essential roles in its success. Destination management companies, local guides, and adventure travel agencies all contribute to the industry's growth, while adventure resorts and adventure parks provide specialized experiences for visitors. Adventure tourism's future looks bright, with adventure sports equipment and adventure activities continuing to gain popularity. Social media marketing and online booking platforms are essential tools for reaching new audiences and promoting sustainable practices.

Adventure tourism certifications and safety training programs ensure that operators meet the highest standards, providing peace of mind for travelers. The market's continuous evolution reflects the industry's commitment to innovation, development, and sustainability. As new trends emerge and existing ones evolve, adventure tourism remains an exciting and dynamic sector that offers endless opportunities for exploration and adventure.

How is this Adventure Tourism Industry segmented?

The adventure tourism industry research report provides comprehensive data (region-wise segment analysis), with forecasts and estimates in "USD billion" for the period 2025-2029, as well as historical data from 2019-2023 for the following segments.

  • Type
    • Domestic
    • International
  • Source
    • Indirect contribution
    • Direct contribution
    • Induced contribution
  • Geography
    • North America
      • US
      • Canada
    • Europe
      • France
      • Germany
      • Italy
      • UK
    • APAC
      • China
      • India
      • Japan
      • South Korea
    • Rest of World (ROW)

By Type Insights

The domestic segment is estimated to witness significant growth during the forecast period.

The market encompasses various segments, including hiking gear, water sports equipment, camping equipment, guided tours, adventure tourism regulations, emergency response, climbing equipment, online booking platforms, adventure tourism policy, adventure resorts, adventure tourism innovation, adventure tourism development, outdoor gear, scuba diving, travel insurance, nature photography, adventure destinations, adventure tourism trends, adventure tourism future, adventure sports equipment, economic impact, sustainable tourism, social media marketing, mountain biking, adventure tourism research, adventure packages, adventure parks, local guides, community development, social impact, adventure activities, travel gear, tourism infrastructure, destination management companies, adventure tourism certifications, adventure tourism safety, adventure tourism management, wildlife viewing, infrastructure development, adventure travel agencies, adventure tour operators, adventure travel blogs, extreme sports, adventure tourism training, environmental sustainability, and risk management.

Domestic adventure tourism is a significant segment, expected to lead the market during the forecast period. Favorable government regulations, absence of currency exchange rates, and cultural familiarity contribute to its growth. The expansion of this segment is further propelled by the strong economic development in emerging economies. Domestic adventure tourism offers several advantages, including familiarity with tourism policies, government rules, and associated risks, which supports its growth trajectory. The segment is anticipated to experience an accelerating YoY growth rate during the forecast period.

Adventure Tourism Market Size

Request Free Sample

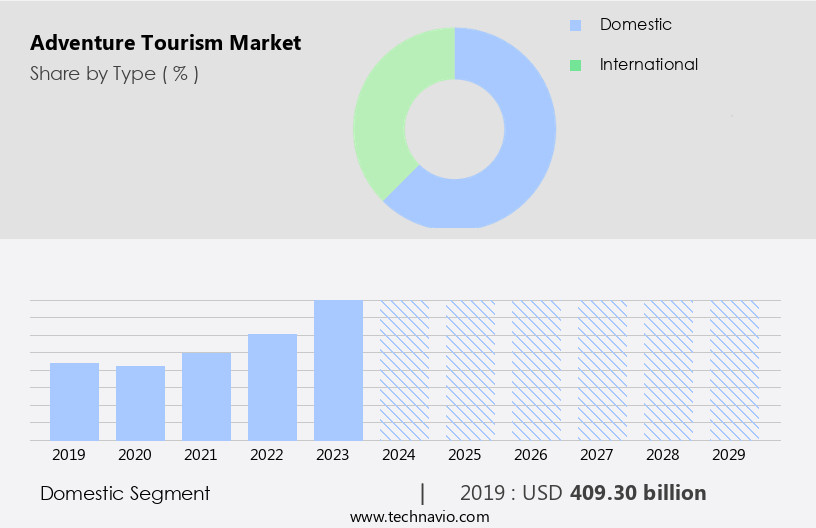
The Domestic segment was valued at USD 409.30 billion in 2019 and showed a gradual increase during the forecast period.

Regional Analysis

Europe is estimated to contribute 30% to the growth of the global market during the forecast period.Technavio's analysts have elaborately explained the regional trends and drivers that shape the market during the forecast period.

Adventure Tourism Market Share by Geography

 Request Free Sample

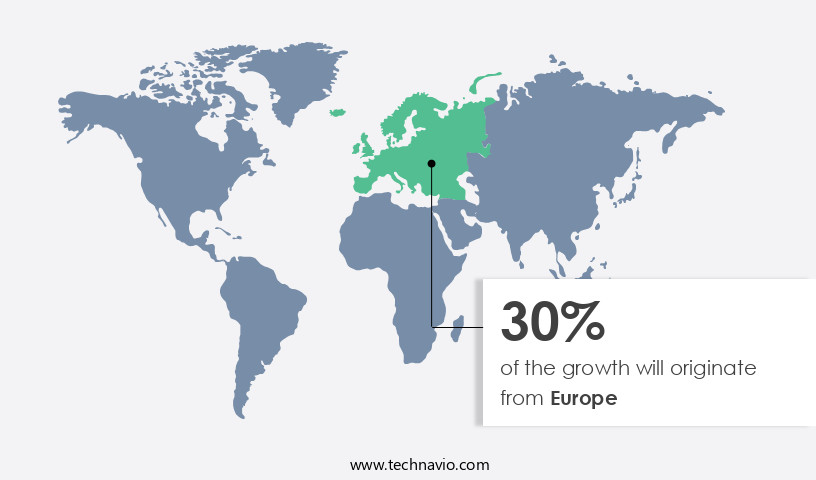
Europe, renowned for its diverse cultures and breathtaking landscapes, leads The market. This growth can be attributed to the rising disposable income and an abundance of exotic destinations. Over the past six decades, Europe's tourism sector has flourished, becoming a significant contributor to socio-economic development. Local governments and tour operators have invested heavily in this industry, fostering its expansion. The European the market encompasses various activities such as hiking, water sports, camping, and guided tours. Regulations ensure safety and environmental sustainability, while emergency response teams are on standby for any unforeseen circumstances. Climbing equipment, scuba diving gear, and adventure sports equipment are essential for these adventures.

Online booking platforms have streamlined the booking process, making it more accessible and convenient for travelers. Adventure tourism policies encourage community development and social impact, creating a harmonious balance between tourism and local populations. Adventure resorts offer immersive experiences, while adventure tour operators provide expert-led tours. Adventure travel agencies curate adventure packages, and adventure parks offer thrilling experiences for visitors. Local guides share their knowledge, enhancing the travel experience. Infrastructure development, including destination management companies and adventure tourism certifications, ensures safety and professionalism. Adventure tourism trends include sustainable tourism practices, social media marketing, and extreme sports. Environmental sustainability and risk management are key considerations.

The future of adventure tourism lies in innovation, with a focus on creating unique, memorable experiences for travelers. Adventure activities, such as mountain biking and wildlife viewing, offer a connection to nature. Travel insurance and adventure tourism training ensure peace of mind for travelers. As the market continues to evolve, it remains a vital contributor to Europe's economy.

Market Dynamics

Our researchers analyzed the data with 2024 as the base year, along with the key drivers, trends, and challenges. A holistic analysis of drivers will help companies refine their marketing strategies to gain a competitive advantage.

What are the key market drivers leading to the rise in the adoption of Adventure Tourism Industry?

  • Disposable income growth serves as the primary catalyst for market expansion. 
  • The global economy witnessed a notable growth in disposable income in 2024. For instance, the US Bureau of Economic Analysis reported a 0.3% increase in both personal income and disposable personal income (DPI) in November 2024. Similarly, personal consumption expenditure (PCE) rose by 0.4% during the same period. The Organization for Economic Co-operation and Development (OECD) reported similar trends in developed and developing countries. Factors such as the rise in dual household income, per capita income, and employment rates have contributed to this increase in disposable income worldwide.
  • These economic improvements have created a significant opportunity for the market, which caters to consumers seeking unique and immersive experiences. Effective risk management strategies are crucial in this market to ensure the safety and satisfaction of adventure tourists. The industry's growth is expected to remain harmonious, driven by the increasing demand for adventure experiences and the rising disposable income of consumers.

What are the market trends shaping the Adventure Tourism Industry?

  • The trend in the travel industry is being shaped by positive online reviews, which are increasingly influential in encouraging potential travelers. Online feedback plays a crucial role in shaping consumer decisions and boosting industry growth within the travel sector.
  • The advent of digital technology and the convenience of online reviews have significantly influenced the travel industry, particularly in the realm of adventure tourism. In 2024, the trend of researching and booking adventure activities online continued to gain traction, with an increasing number of travelers relying on the internet to plan their vacations. This shift has led to a surge in demand for adventure tourism activities, such as hiking, camping, water sports, and guided tours. To cater to this demand, adventure tourism operators have embraced digital platforms, offering online booking systems for hiking gear, water sports equipment, camping equipment, and climbing equipment.
  • This not only makes the booking process more convenient for consumers but also provides them with essential information about the environmental impact of their chosen activities and the availability of emergency response services. Adventure tourism regulations have become increasingly stringent, with a focus on safety and sustainability. As a result, adventure resorts have emerged as popular destinations, offering immersive and harmonious experiences while minimizing the environmental footprint. In conclusion, the trend of planning and booking adventure activities online is here to stay, driven by the ease of access to information and the convenience of digital platforms. Travelers can now make informed decisions about their adventure tourism experiences, ensuring memorable and safe adventures.

What challenges does the Adventure Tourism Industry face during its growth?

  • In developing economies, the low penetration rate poses a significant challenge to the industry's growth trajectory. 
  • The market exhibits significant innovation and development, driven by the increasing popularity of adventure sports and the desire for immersive, harmonious experiences in nature. Adventure tourism encompasses various activities, including scuba diving, nature photography, and the use of adventure sports equipment. Outdoor gear and travel insurance are essential components of this market, ensuring safety and enhancing the overall experience for consumers. Adventure tourism trends indicate a growing emphasis on sustainable practices, as consumers seek to minimize their environmental impact. Despite the market's potential, the low awareness rate among consumers in developing economies about adventure tourism may hinder its growth.
  • companies primarily focus on tier 1 cities, limiting their reach in tier 2 and tier 3 cities. This low penetration rate in developing economies could impede the market's expansion during the forecast period. In conclusion, the market is poised for growth, fueled by consumer interest in unique experiences and the increasing availability of adventure sports equipment and travel services. However, challenges such as low awareness and limited reach in developing economies may present obstacles to market expansion. Sustainable practices and innovative offerings will be key differentiators for market participants.

Exclusive Customer Landscape

The adventure tourism market forecasting report includes the adoption lifecycle of the market, covering from the innovator's stage to the laggard's stage. It focuses on adoption rates in different regions based on penetration. Furthermore, the adventure tourism market report also includes key purchase criteria and drivers of price sensitivity to help companies evaluate and develop their market growth analysis strategies.
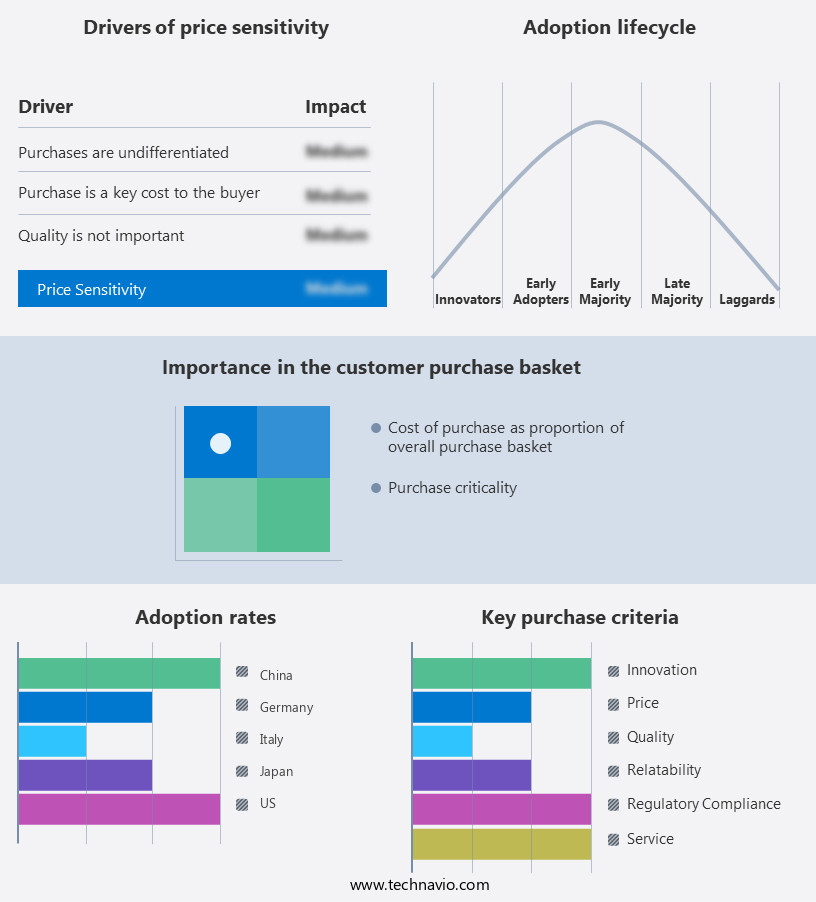
Adventure Tourism Market Share by Geography

 Customer Landscape

Key Companies & Market Insights

Companies are implementing various strategies, such as strategic alliances, adventure tourism market forecast, partnerships, mergers and acquisitions, geographical expansion, and product/service launches, to enhance their presence in the industry.

Abercrombie and Kent USA LLC - Experience the thrill of adventure tourism through our extensive offerings, including African safaris. Immerse yourself in the beauty and wonder of diverse wildlife habitats, guided by expert tour operators. 

The industry research and growth report includes detailed analyses of the competitive landscape of the market and information about key companies, including:

  • Abercrombie and Kent USA LLC
  • Active New Zealand Ltd.
  • BikeHike Adventures Inc.
  • Boundless Journeys
  • Butterfield and Robinson Inc.
  • Discovery Nomads LLC
  • Explore Worldwide Ltd.
  • G Adventures
  • Geographic Expeditions Inc.
  • Intrepid Group Pty Ltd.
  • Kensington Tours Ltd.
  • Lindblad Expeditions Holdings Inc.
  • Mountain Travel Sobek
  • Passages Exotic Expeditions Ltd.
  • Recreational Equipment Inc.
  • ROW Adventures
  • The Walt Disney Co.
  • Trafalgar
  • Travelopia Group
  • TUI AG

Qualitative and quantitative analysis of companies has been conducted to help clients understand the wider business environment as well as the strengths and weaknesses of key industry players. Data is qualitatively analyzed to categorize companies as pure play, category-focused, industry-focused, and diversified; it is quantitatively analyzed to categorize companies as dominant, leading, strong, tentative, and weak.

Recent Development and News in Adventure Tourism Market

  • In March 2024, Intrepid Travel, a leading adventure travel company, announced the launch of their new "Sustainable Travel Pledge," committing to carbon-neutral operations by 2030 and investing in local communities through their "Fair Trade Travel" initiative (Intrepid Travel Press Release, 2024).
  • In June 2024, TripAdvisor, the world's largest travel platform, acquired TourRadar, a European adventure travel marketplace, to expand its offerings and strengthen its position in the adventure travel sector (TripAdvisor Press Release, 2024).
  • In October 2024, the European Union (EU) approved the Adventure Travel Europe Certification Scheme, a new regulatory framework to ensure sustainable and responsible adventure tourism practices across Europe (European Commission Press Release, 2024).
  • In January 2025, Butterfield & Robinson, a luxury adventure travel company, raised USD50 million in a funding round led by BlackRock to invest in technology and expand its global presence (Bloomberg, 2025).

Research Analyst Overview

  • The market is experiencing dynamic shifts, with a growing emphasis on sustainable practices and ethical considerations. Remote destinations continue to attract adventure travel groups, who seek unique experiences off the beaten path. Adventure travel insurance and education are increasingly important, ensuring safety and preparation for the rigors of exploration. Innovations in adventure travel technology and videography enable captivating storytelling, while personalized tours cater to individual preferences.
  • Conservation and sustainability remain key concerns, with a focus on minimizing environmental impact and promoting local communities. Adventure travel writing and photography offer inspiring narratives and visuals, fueling the industry's ongoing growth. Ethics and innovation intertwine, as companies strive to balance adventure with responsible tourism practices.

Dive into Technavio's robust research methodology, blending expert interviews, extensive data synthesis, and validated models for unparalleled Adventure Tourism Market insights. See full methodology.

Market Scope

Report Coverage

Details

Page number

198

Base year

2024

Historic period

2019-2023

Forecast period

2025-2029

Growth momentum & CAGR

Accelerate at a CAGR of 43.5%

Market growth 2025-2029

USD 6867.9 billion

Market structure

Fragmented

YoY growth 2024-2025(%)

35.8

Key countries

US, China, India, Germany, Canada, Italy, South Korea, Japan, UK, and France

Competitive landscape

Leading Companies, Market Positioning of Companies, Competitive Strategies, and Industry Risks

Request Free Sample

What are the Key Data Covered in this Adventure Tourism Market Research and Growth Report?

  • CAGR of the Adventure Tourism industry during the forecast period
  • Detailed information on factors that will drive the growth and forecasting between 2025 and 2029
  • Precise estimation of the size of the market and its contribution of the industry in focus to the parent market
  • Accurate predictions about upcoming growth and trends and changes in consumer behaviour
  • Growth of the market across Europe, APAC, North America, South America, and Middle East and Africa
  • Thorough analysis of the market's competitive landscape and detailed information about companies
  • Comprehensive analysis of factors that will challenge the adventure tourism market growth of industry companies

We can help! Our analysts can customize this adventure tourism market research report to meet your requirements.

Get in touch

1 Executive Summary

  • 1.1 Market overview
    • Executive Summary - Chart on Market Overview
    • Executive Summary - Data Table on Market Overview
    • Executive Summary - Chart on Global Market Characteristics
    • Executive Summary - Chart on Market by Geography
    • Executive Summary - Chart on Market Segmentation by Type
    • Executive Summary - Chart on Market Segmentation by Source
    • Executive Summary - Chart on Incremental Growth
    • Executive Summary - Data Table on Incremental Growth
    • Executive Summary - Chart on Company Market Positioning

2 Technavio Analysis

  • 2.1 Analysis of price sensitivity, lifecycle, customer purchase basket, adoption rates, and purchase criteria
    • Analysis of price sensitivity, lifecycle, customer purchase basket, adoption rates, and purchase criteria
  • 2.2 Criticality of inputs and Factors of differentiation
    • Overview on criticality of inputs and factors of differentiation
  • 2.3 Factors of disruption
    • Overview on factors of disruption
  • 2.4 Impact of drivers and challenges
    • Impact of drivers and challenges in 2024 and 2029

3 Market Landscape

  • 3.1 Market ecosystem
    • Parent Market
    • Data Table on - Parent Market
  • 3.2 Market characteristics
    • Market characteristics analysis
  • 3.3 Value chain analysis
    • Value chain analysis

4 Market Sizing

  • 4.1 Market definition
    • Offerings of companies included in the market definition
  • 4.2 Market segment analysis
    • Market segments
  • 4.3 Market size 2024
    • 4.4 Market outlook: Forecast for 2024-2029
      • Chart on Global - Market size and forecast 2024-2029 ($ billion)
      • Data Table on Global - Market size and forecast 2024-2029 ($ billion)
      • Chart on Global Market: Year-over-year growth 2024-2029 (%)
      • Data Table on Global Market: Year-over-year growth 2024-2029 (%)

    5 Historic Market Size

    • 5.1 Global Adventure Tourism Market 2019 - 2023
      • Historic Market Size - Data Table on Global Adventure Tourism Market 2019 - 2023 ($ billion)
    • 5.2 Type segment analysis 2019 - 2023
      • Historic Market Size - Type Segment 2019 - 2023 ($ billion)
    • 5.3 Source segment analysis 2019 - 2023
      • Historic Market Size - Source Segment 2019 - 2023 ($ billion)
    • 5.4 Geography segment analysis 2019 - 2023
      • Historic Market Size - Geography Segment 2019 - 2023 ($ billion)
    • 5.5 Country segment analysis 2019 - 2023
      • Historic Market Size - Country Segment 2019 - 2023 ($ billion)

    6 Qualitative Analysis

    • 6.1 Impact of AI on the Global Adventure Tourism Market

      7 Five Forces Analysis

      • 7.1 Five forces summary
        • Five forces analysis - Comparison between 2024 and 2029
      • 7.2 Bargaining power of buyers
        • Bargaining power of buyers - Impact of key factors 2024 and 2029
      • 7.3 Bargaining power of suppliers
        • Bargaining power of suppliers - Impact of key factors in 2024 and 2029
      • 7.4 Threat of new entrants
        • Threat of new entrants - Impact of key factors in 2024 and 2029
      • 7.5 Threat of substitutes
        • Threat of substitutes - Impact of key factors in 2024 and 2029
      • 7.6 Threat of rivalry
        • Threat of rivalry - Impact of key factors in 2024 and 2029
      • 7.7 Market condition
        • Chart on Market condition - Five forces 2024 and 2029

      8 Market Segmentation by Type

      • 8.1 Market segments
        • Chart on Type - Market share 2024-2029 (%)
        • Data Table on Type - Market share 2024-2029 (%)
      • 8.2 Comparison by Type
        • Chart on Comparison by Type
        • Data Table on Comparison by Type
      • 8.3 Domestic - Market size and forecast 2024-2029
        • Chart on Domestic - Market size and forecast 2024-2029 ($ billion)
        • Data Table on Domestic - Market size and forecast 2024-2029 ($ billion)
        • Chart on Domestic - Year-over-year growth 2024-2029 (%)
        • Data Table on Domestic - Year-over-year growth 2024-2029 (%)
      • 8.4 International - Market size and forecast 2024-2029
        • Chart on International - Market size and forecast 2024-2029 ($ billion)
        • Data Table on International - Market size and forecast 2024-2029 ($ billion)
        • Chart on International - Year-over-year growth 2024-2029 (%)
        • Data Table on International - Year-over-year growth 2024-2029 (%)
      • 8.5 Market opportunity by Type
        • Market opportunity by Type ($ billion)
        • Data Table on Market opportunity by Type ($ billion)

      9 Market Segmentation by Source

      • 9.1 Market segments
        • Chart on Source - Market share 2024-2029 (%)
        • Data Table on Source - Market share 2024-2029 (%)
      • 9.2 Comparison by Source
        • Chart on Comparison by Source
        • Data Table on Comparison by Source
      • 9.3 Indirect contribution - Market size and forecast 2024-2029
        • Chart on Indirect contribution - Market size and forecast 2024-2029 ($ billion)
        • Data Table on Indirect contribution - Market size and forecast 2024-2029 ($ billion)
        • Chart on Indirect contribution - Year-over-year growth 2024-2029 (%)
        • Data Table on Indirect contribution - Year-over-year growth 2024-2029 (%)
      • 9.4 Direct contribution - Market size and forecast 2024-2029
        • Chart on Direct contribution - Market size and forecast 2024-2029 ($ billion)
        • Data Table on Direct contribution - Market size and forecast 2024-2029 ($ billion)
        • Chart on Direct contribution - Year-over-year growth 2024-2029 (%)
        • Data Table on Direct contribution - Year-over-year growth 2024-2029 (%)
      • 9.5 Induced contribution - Market size and forecast 2024-2029
        • Chart on Induced contribution - Market size and forecast 2024-2029 ($ billion)
        • Data Table on Induced contribution - Market size and forecast 2024-2029 ($ billion)
        • Chart on Induced contribution - Year-over-year growth 2024-2029 (%)
        • Data Table on Induced contribution - Year-over-year growth 2024-2029 (%)
      • 9.6 Market opportunity by Source
        • Market opportunity by Source ($ billion)
        • Data Table on Market opportunity by Source ($ billion)

      10 Customer Landscape

      • 10.1 Customer landscape overview
        • Analysis of price sensitivity, lifecycle, customer purchase basket, adoption rates, and purchase criteria

      11 Geographic Landscape

      • 11.1 Geographic segmentation
        • Chart on Market share by geography 2024-2029 (%)
        • Data Table on Market share by geography 2024-2029 (%)
      • 11.2 Geographic comparison
        • Chart on Geographic comparison
        • Data Table on Geographic comparison
      • 11.3 Europe - Market size and forecast 2024-2029
        • Chart on Europe - Market size and forecast 2024-2029 ($ billion)
        • Data Table on Europe - Market size and forecast 2024-2029 ($ billion)
        • Chart on Europe - Year-over-year growth 2024-2029 (%)
        • Data Table on Europe - Year-over-year growth 2024-2029 (%)
      • 11.4 APAC - Market size and forecast 2024-2029
        • Chart on APAC - Market size and forecast 2024-2029 ($ billion)
        • Data Table on APAC - Market size and forecast 2024-2029 ($ billion)
        • Chart on APAC - Year-over-year growth 2024-2029 (%)
        • Data Table on APAC - Year-over-year growth 2024-2029 (%)
      • 11.5 North America - Market size and forecast 2024-2029
        • Chart on North America - Market size and forecast 2024-2029 ($ billion)
        • Data Table on North America - Market size and forecast 2024-2029 ($ billion)
        • Chart on North America - Year-over-year growth 2024-2029 (%)
        • Data Table on North America - Year-over-year growth 2024-2029 (%)
      • 11.6 South America - Market size and forecast 2024-2029
        • Chart on South America - Market size and forecast 2024-2029 ($ billion)
        • Data Table on South America - Market size and forecast 2024-2029 ($ billion)
        • Chart on South America - Year-over-year growth 2024-2029 (%)
        • Data Table on South America - Year-over-year growth 2024-2029 (%)
      • 11.7 Middle East and Africa - Market size and forecast 2024-2029
        • Chart on Middle East and Africa - Market size and forecast 2024-2029 ($ billion)
        • Data Table on Middle East and Africa - Market size and forecast 2024-2029 ($ billion)
        • Chart on Middle East and Africa - Year-over-year growth 2024-2029 (%)
        • Data Table on Middle East and Africa - Year-over-year growth 2024-2029 (%)
      • 11.8 US - Market size and forecast 2024-2029
        • Chart on US - Market size and forecast 2024-2029 ($ billion)
        • Data Table on US - Market size and forecast 2024-2029 ($ billion)
        • Chart on US - Year-over-year growth 2024-2029 (%)
        • Data Table on US - Year-over-year growth 2024-2029 (%)
      • 11.9 China - Market size and forecast 2024-2029
        • Chart on China - Market size and forecast 2024-2029 ($ billion)
        • Data Table on China - Market size and forecast 2024-2029 ($ billion)
        • Chart on China - Year-over-year growth 2024-2029 (%)
        • Data Table on China - Year-over-year growth 2024-2029 (%)
      • 11.10 India - Market size and forecast 2024-2029
        • Chart on India - Market size and forecast 2024-2029 ($ billion)
        • Data Table on India - Market size and forecast 2024-2029 ($ billion)
        • Chart on India - Year-over-year growth 2024-2029 (%)
        • Data Table on India - Year-over-year growth 2024-2029 (%)
      • 11.11 Germany - Market size and forecast 2024-2029
        • Chart on Germany - Market size and forecast 2024-2029 ($ billion)
        • Data Table on Germany - Market size and forecast 2024-2029 ($ billion)
        • Chart on Germany - Year-over-year growth 2024-2029 (%)
        • Data Table on Germany - Year-over-year growth 2024-2029 (%)
      • 11.12 Canada - Market size and forecast 2024-2029
        • Chart on Canada - Market size and forecast 2024-2029 ($ billion)
        • Data Table on Canada - Market size and forecast 2024-2029 ($ billion)
        • Chart on Canada - Year-over-year growth 2024-2029 (%)
        • Data Table on Canada - Year-over-year growth 2024-2029 (%)
      • 11.13 South Korea - Market size and forecast 2024-2029
        • Chart on South Korea - Market size and forecast 2024-2029 ($ billion)
        • Data Table on South Korea - Market size and forecast 2024-2029 ($ billion)
        • Chart on South Korea - Year-over-year growth 2024-2029 (%)
        • Data Table on South Korea - Year-over-year growth 2024-2029 (%)
      • 11.14 Italy - Market size and forecast 2024-2029
        • Chart on Italy - Market size and forecast 2024-2029 ($ billion)
        • Data Table on Italy - Market size and forecast 2024-2029 ($ billion)
        • Chart on Italy - Year-over-year growth 2024-2029 (%)
        • Data Table on Italy - Year-over-year growth 2024-2029 (%)
      • 11.15 Japan - Market size and forecast 2024-2029
        • Chart on Japan - Market size and forecast 2024-2029 ($ billion)
        • Data Table on Japan - Market size and forecast 2024-2029 ($ billion)
        • Chart on Japan - Year-over-year growth 2024-2029 (%)
        • Data Table on Japan - Year-over-year growth 2024-2029 (%)
      • 11.16 UK - Market size and forecast 2024-2029
        • Chart on UK - Market size and forecast 2024-2029 ($ billion)
        • Data Table on UK - Market size and forecast 2024-2029 ($ billion)
        • Chart on UK - Year-over-year growth 2024-2029 (%)
        • Data Table on UK - Year-over-year growth 2024-2029 (%)
      • 11.17 France - Market size and forecast 2024-2029
        • Chart on France - Market size and forecast 2024-2029 ($ billion)
        • Data Table on France - Market size and forecast 2024-2029 ($ billion)
        • Chart on France - Year-over-year growth 2024-2029 (%)
        • Data Table on France - Year-over-year growth 2024-2029 (%)
      • 11.18 Market opportunity by geography
        • Market opportunity by geography ($ billion)
        • Data Tables on Market opportunity by geography ($ billion)

      12 Drivers, Challenges, and Opportunity/Restraints

      • 12.1 Market drivers
        • 12.2 Market challenges
          • 12.3 Impact of drivers and challenges
            • Impact of drivers and challenges in 2024 and 2029
          • 12.4 Market opportunities/restraints

            13 Competitive Landscape

            • 13.1 Overview
              • 13.2 Competitive Landscape
                • Overview on criticality of inputs and factors of differentiation
              • 13.3 Landscape disruption
                • Overview on factors of disruption
              • 13.4 Industry risks
                • Impact of key risks on business

              14 Competitive Analysis

              • 14.1 Companies profiled
                • Companies covered
              • 14.2 Company ranking index
                • Company ranking index
              • 14.3 Market positioning of companies
                • Matrix on companies position and classification
              • 14.4 Abercrombie and Kent USA LLC
                • Abercrombie and Kent USA LLC - Overview
                • Abercrombie and Kent USA LLC - Product / Service
                • Abercrombie and Kent USA LLC - Key offerings
                • SWOT
              • 14.5 Active New Zealand Ltd.
                • Active New Zealand Ltd. - Overview
                • Active New Zealand Ltd. - Product / Service
                • Active New Zealand Ltd. - Key news
                • Active New Zealand Ltd. - Key offerings
                • SWOT
              • 14.6 BikeHike Adventures Inc.
                • BikeHike Adventures Inc. - Overview
                • BikeHike Adventures Inc. - Product / Service
                • BikeHike Adventures Inc. - Key offerings
                • SWOT
              • 14.7 Boundless Journeys
                • Boundless Journeys - Overview
                • Boundless Journeys - Product / Service
                • Boundless Journeys - Key offerings
                • SWOT
              • 14.8 Butterfield and Robinson Inc.
                • Butterfield and Robinson Inc. - Overview
                • Butterfield and Robinson Inc. - Product / Service
                • Butterfield and Robinson Inc. - Key news
                • Butterfield and Robinson Inc. - Key offerings
                • SWOT
              • 14.9 Explore Worldwide Ltd.
                • Explore Worldwide Ltd. - Overview
                • Explore Worldwide Ltd. - Product / Service
                • Explore Worldwide Ltd. - Key offerings
                • SWOT
              • 14.10 G Adventures
                • G Adventures - Overview
                • G Adventures - Product / Service
                • G Adventures - Key offerings
                • SWOT
              • 14.11 Intrepid Group Pty Ltd.
                • Intrepid Group Pty Ltd. - Overview
                • Intrepid Group Pty Ltd. - Product / Service
                • Intrepid Group Pty Ltd. - Key offerings
                • SWOT
              • 14.12 Lindblad Expeditions Holdings Inc.
                • Lindblad Expeditions Holdings Inc. - Overview
                • Lindblad Expeditions Holdings Inc. - Business segments
                • Lindblad Expeditions Holdings Inc. - Key offerings
                • Lindblad Expeditions Holdings Inc. - Segment focus
                • SWOT
              • 14.13 Mountain Travel Sobek
                • Mountain Travel Sobek - Overview
                • Mountain Travel Sobek - Product / Service
                • Mountain Travel Sobek - Key offerings
                • SWOT
              • 14.14 Passages Exotic Expeditions Ltd.
                • Passages Exotic Expeditions Ltd. - Overview
                • Passages Exotic Expeditions Ltd. - Product / Service
                • Passages Exotic Expeditions Ltd. - Key offerings
                • SWOT
              • 14.15 Recreational Equipment Inc.
                • Recreational Equipment Inc. - Overview
                • Recreational Equipment Inc. - Product / Service
                • Recreational Equipment Inc. - Key offerings
                • SWOT
              • 14.16 The Walt Disney Co.
                • The Walt Disney Co. - Overview
                • The Walt Disney Co. - Business segments
                • The Walt Disney Co. - Key news
                • The Walt Disney Co. - Key offerings
                • The Walt Disney Co. - Segment focus
                • SWOT
              • 14.17 Travelopia Group
                • Travelopia Group - Overview
                • Travelopia Group - Product / Service
                • Travelopia Group - Key offerings
                • SWOT
              • 14.18 TUI AG
                • TUI AG - Overview
                • TUI AG - Business segments
                • TUI AG - Key offerings
                • TUI AG - Segment focus
                • SWOT

              15 Appendix

              • 15.1 Scope of the report
                • 15.2 Inclusions and exclusions checklist
                  • Inclusions checklist
                  • Exclusions checklist
                • 15.3 Currency conversion rates for US$
                  • Currency conversion rates for US$
                • 15.4 Research methodology
                  • Research methodology
                • 15.5 Data procurement
                  • Information sources
                • 15.6 Data validation
                  • Data validation
                • 15.7 Validation techniques employed for market sizing
                  • Validation techniques employed for market sizing
                • 15.8 Data synthesis
                  • Data synthesis
                • 15.9 360 degree market analysis
                  • 360 degree market analysis
                • 15.10 List of abbreviations
                  • List of abbreviations

                Research Methodology

                Technavio presents a detailed picture of the market by way of study, synthesis, and summation of data from multiple sources. The analysts have presented the various facets of the market with a particular focus on identifying the key industry influencers. The data thus presented is comprehensive, reliable, and the result of extensive research, both primary and secondary.

                INFORMATION SOURCES

                Primary sources

                • Manufacturers and suppliers
                • Channel partners
                • Industry experts
                • Strategic decision makers

                Secondary sources

                • Industry journals and periodicals
                • Government data
                • Financial reports of key industry players
                • Historical data
                • Press releases

                DATA ANALYSIS

                Data Synthesis

                • Collation of data
                • Estimation of key figures
                • Analysis of derived insights

                Data Validation

                • Triangulation with data models
                • Reference against proprietary databases
                • Corroboration with industry experts

                REPORT WRITING

                Qualitative

                • Market drivers
                • Market challenges
                • Market trends
                • Five forces analysis

                Quantitative

                • Market size and forecast
                • Market segmentation
                • Geographical insights
                • Competitive landscape

                Interested in this report?

                Get your sample now to see our research methodology and insights!

                Download Now

                Frequently Asked Questions

                Adventure Tourism market growth will increase by $ 6867.9 bn during 2025-2029 .

                The Adventure Tourism market is expected to grow at a CAGR of 43.5% during 2025-2029 .

                Adventure Tourism market is segmented by Type( Domestic, International) Source( Indirect contribution, Direct contribution, Induced contribution, South America, Middle East and Africa)

                Abercrombie and Kent USA LLC, Active New Zealand Ltd., BikeHike Adventures Inc., Boundless Journeys, Butterfield and Robinson Inc., Discovery Nomads LLC, Explore Worldwide Ltd., G Adventures, Geographic Expeditions Inc., Intrepid Group Pty Ltd., Kensington Tours Ltd., Lindblad Expeditions Holdings Inc., Mountain Travel Sobek, Passages Exotic Expeditions Ltd., Recreational Equipment Inc., ROW Adventures, The Walt Disney Co., Trafalgar, Travelopia Group, TUI AG are a few of the key vendors in the Adventure Tourism market.

                Europe will register the highest growth rate of 30% among the other regions. Therefore, the Adventure Tourism market in Europe is expected to garner significant business opportunities for the vendors during the forecast period.

                US, China, India, Germany, Canada, Italy, South Korea, Japan, UK, France

                • Increasing disposable incomesIn 2024 is the driving factor this market.
                • the disposable income of people continued to rise significantly globally. For instance is the driving factor this market.
                • the Bureau of Economic Analysis reports that the disposable personal income (DPI) of the US increased by 0.3% in November 2024. According to projections on personal earnings and expenditures released by the Bureau of Economic Analysis in December 2024 is the driving factor this market.
                • personal income rose by 0.3% in November is the driving factor this market.
                • while the DPI increased by 0.3%. Personal consumption expenditure (PCE) increased by 0.4% in November 2024.The Organization for Economic Co-operation and Development (OECD) reported that household disposable income increased in all developed and developing countries in 2024. Factors such as the rise in dual household income is the driving factor this market.
                • per capita income is the driving factor this market.
                • and rapid growth in employment rates have driven the increase in disposable incomes worldwide. The boom in the tourism industry has also encouraged consumers to spend on travel and leisure activities is the driving factor this market.
                • with access to exotic holiday experiences. According to the data published by the Department of Commerce is the driving factor this market.
                • the US is projected to welcome 77.7 million international visitors annually by 2024. Therefore is the driving factor this market.
                • the increasing disposable income will boost the demand for luxurious travel to different destinations across the world is the driving factor this market.
                • fostering the growth of the global adventure tourism market during the forecast period. is the driving factor this market.

                The Adventure Tourism market vendors should focus on grabbing business opportunities from the Domestic segment as it accounted for the largest market share in the base year.