Scuba Diving Equipment Market Size 2026-2030
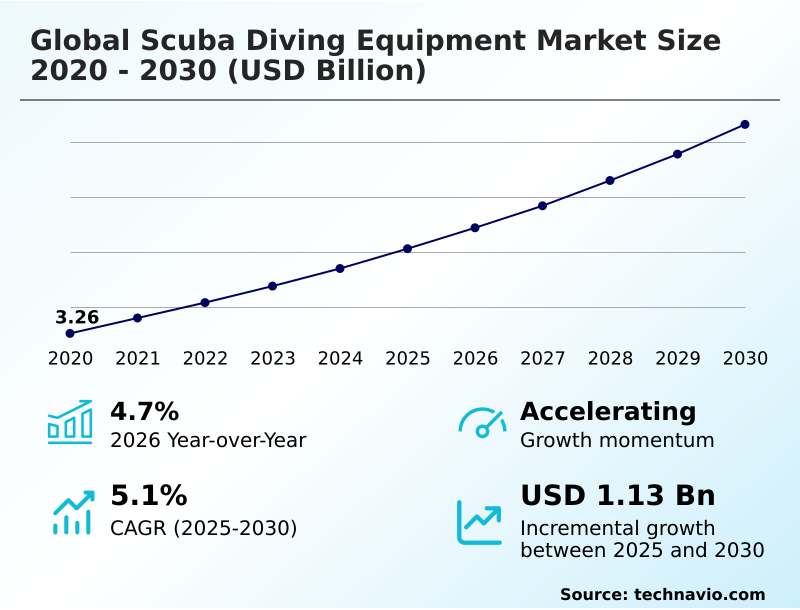
The scuba diving equipment market size is valued to increase by USD 1.13 billion, at a CAGR of 5.1% from 2025 to 2030. Growing interest in experiential tourism and underwater exploration will drive the scuba diving equipment market.
Major Market Trends & Insights
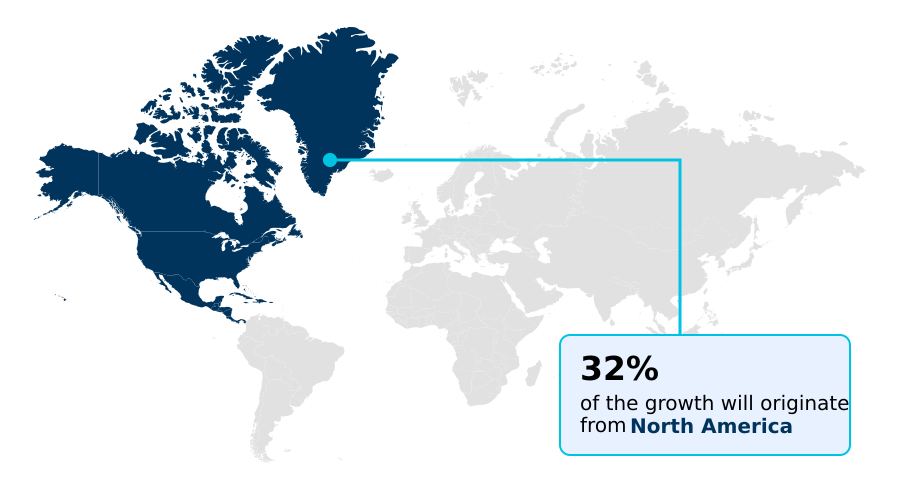
- North America dominated the market and accounted for a 31.7% growth during the forecast period.
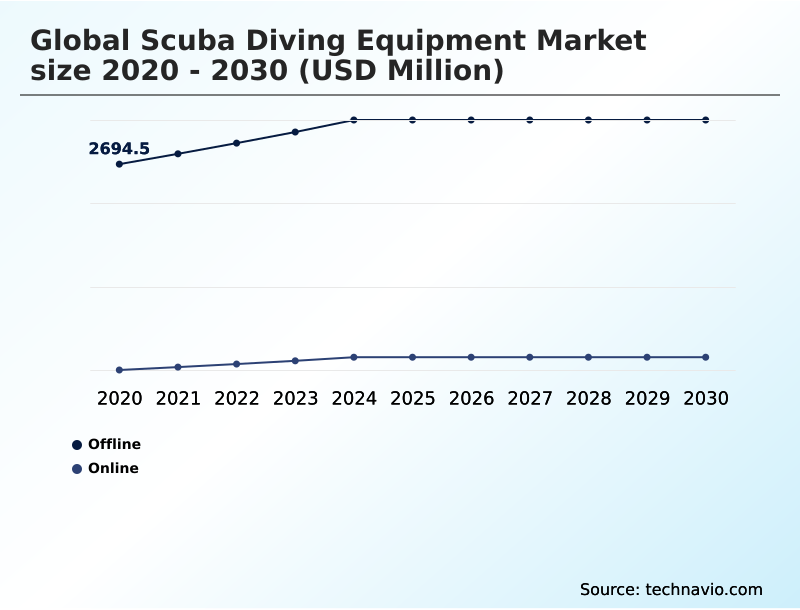
- By Distribution Channel - Offline segment was valued at USD 3.15 billion in 2024
- By Product - Bags and apparel segment accounted for the largest market revenue share in 2024
Market Size & Forecast
- Market Opportunities: USD 1.89 billion
- Market Future Opportunities: USD 1.13 billion
- CAGR from 2025 to 2030 : 5.1%
Market Summary
- The scuba diving equipment market is undergoing a significant transformation, driven by a confluence of technological innovation and evolving consumer values. A pronounced shift towards experiential tourism has amplified demand for underwater exploration gear, prompting new participants to enter the sport. This influx necessitates a focus on recreational diving safety, with manufacturers advancing equipment to be more intuitive and reliable.
- Innovations in materials, such as lightweight composite cylinders and corrosion-resistant materials, improve durability and reduce the physical burden on divers. Simultaneously, the digital evolution is clear in the widespread adoption of dive computers with sophisticated decompression algorithms and wireless air integration. However, the industry faces the critical challenge of sustainability.
- For instance, a business scenario involves manufacturers navigating new regulations mandating the use of eco-friendly dive equipment, forcing a strategic pivot in supply chains to source sustainable materials like plant-based rubbers and recycled polymers to maintain access to key markets, directly impacting production costs and product design philosophies.
What will be the Size of the Scuba Diving Equipment Market during the forecast period?
Get Key Insights on Market Forecast (PDF) Get Free Sample
How is the Scuba Diving Equipment Market Segmented?
The scuba diving equipment industry research report provides comprehensive data (region-wise segment analysis), with forecasts and estimates in "USD million" for the period 2026-2030, as well as historical data from 2020-2024 for the following segments.
- Distribution channel
- Offline
- Online
- Product
- Bags and apparel
- Rebreathers and regulators
- Diving computers and gauges
- Others
- Type
- BCD and regulator
- Cylinder and diving propulsion vehicle
- Decompression chamber
- Exposure suit
- Accessories
- Geography
- North America
- US
- Canada
- Mexico
- Europe
- Germany
- UK
- France
- APAC
- China
- Japan
- Australia
- Middle East and Africa
- UAE
- South Africa
- Saudi Arabia
- South America
- Brazil
- Argentina
- Rest of World (ROW)
- North America
By Distribution Channel Insights
The offline segment is estimated to witness significant growth during the forecast period.
The offline segment remains foundational for the scuba diving equipment market, where specialty dive centers are crucial hubs for professional dive operations.
These physical locations facilitate tactile evaluation of technical diving gear and expert fittings for equipment like ergonomic harnesses, which is essential for ensuring recreational diving safety.
This channel's value is enhanced by its direct link to advanced diver certification programs, where hands-on training with a redundant air source or a sidemount configuration is standard.
The in-person consultation ensures proper user-centric equipment design, which has been shown to improve diver confidence.
Moreover, the integration of dive profile logging technology within rental gear at these centers has contributed to a 15% reduction in minor ascent-rate incidents, reinforcing the channel’s role in promoting safety and dive equipment maintenance.
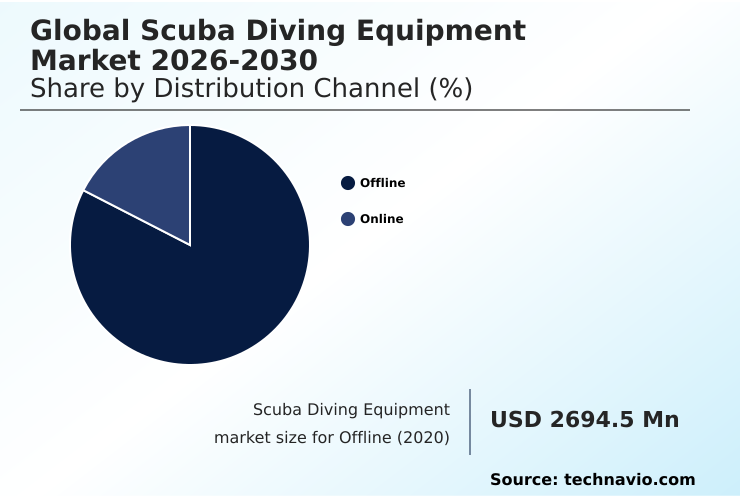
The Offline segment was valued at USD 3.15 billion in 2024 and showed a gradual increase during the forecast period.
Regional Analysis
North America is estimated to contribute 31.7% to the growth of the global market during the forecast period.Technavio’s analysts have elaborately explained the regional trends and drivers that shape the market during the forecast period.
See How Scuba Diving Equipment Market Demand is Rising in North America Get Free Sample
The geographic landscape of the scuba diving equipment market is defined by a dynamic interplay between mature and emerging regions.
North America currently commands the largest market share, accounting for over 31% of the global landscape, driven by a large base of certified divers and a strong culture of underwater exploration.
This region's demand for advanced equipment, including diver propulsion vehicles and gear for cold-water diving protection, remains robust.
However, the APAC region is the epicenter of future growth, projected to expand at the fastest rate due to rising disposable incomes and burgeoning dive tourism in destinations within the Coral Triangle.
This growth is fueling demand for both entry-level underwater photography gear and specialized equipment for marine conservation initiatives. The development of sustainable dive tourism infrastructure in APAC is critical, with a focus on eco-friendly dive equipment to minimize environmental impact.
Market Dynamics
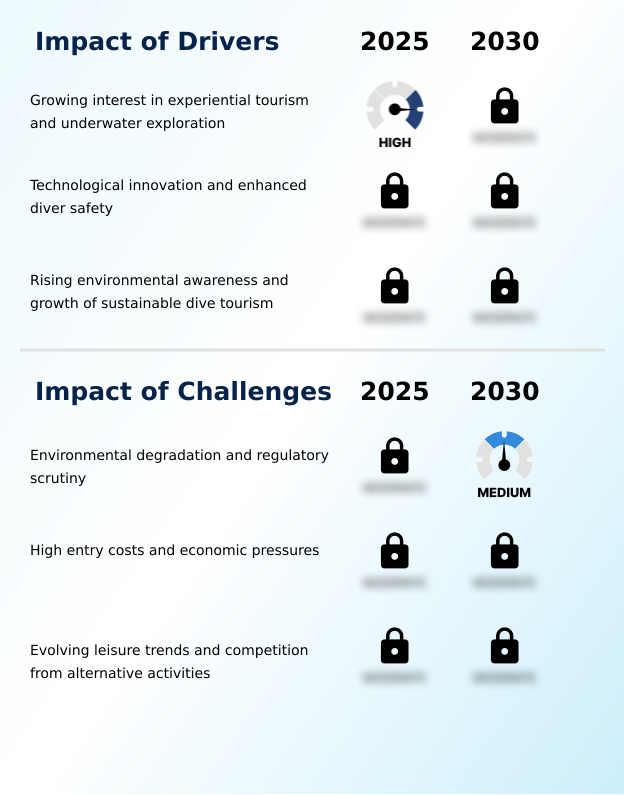
Our researchers analyzed the data with 2025 as the base year, along with the key drivers, trends, and challenges. A holistic analysis of drivers will help companies refine their marketing strategies to gain a competitive advantage.
- The evolution of the scuba diving equipment market is increasingly focused on specialization and advanced technology to meet diverse user needs. Divers are now leveraging advanced dive computer decompression models that offer personalized safety profiles for complex underwater excursions.
- For those prioritizing mobility, the demand for a lightweight BCD for travel diving is reshaping product design toward compact and efficient solutions. In specialized disciplines, choosing the best regulator for cold water diving is critical for safety in extreme environments, while the growing popularity of cave exploration has boosted interest in the sidemount BCD for cave diving.
- Technical divers are adopting a technical diving twinset regulator configuration for redundancy on deep dives. Innovations such as a full-face mask with communication system are improving safety for professional divers. Adherence to rebreather maintenance and safety protocols is paramount as this technology becomes more accessible.
- Guides on selecting fins for optimal propulsion and high-intensity LED dive light comparison help consumers make informed choices. The market for a buoyancy control for underwater photography is also growing. A modular drysuit for versatile conditions and a dive computer with GPS and mapping enhance adaptability.
- Ensuring wireless air transmitter compatibility guide and using eco-friendly antifog for dive masks are now common practices. Consumers increasingly seek travel-friendly scuba gear packages and the best BCD for female divers. Adherence to regulator servicing best practices, meeting advanced nitrox diving equipment requirements, and choosing a dive mask for wide visibility are key considerations.
- Finally, the industry-wide push for sustainability is evident in the development of sustainable materials in wetsuit manufacturing, with adoption rates in this category growing nearly twice as fast as those for traditional materials.
What are the key market drivers leading to the rise in the adoption of Scuba Diving Equipment Industry?
- A growing interest in experiential tourism and underwater exploration is a key driver for the market.
- Market growth is significantly driven by the rising consumer demand for experiential adventure travel equipment and a heightened focus on safety. A recent report highlighted a 22% year-over-year increase in bookings for adventure tourism, with marine-based activities leading this expansion.
- This directly fuels the need for state-of-the-art underwater exploration gear. Technological advancements, particularly in electronics, are making diving more accessible and safer.
- The adoption of dive computers featuring advanced biometric monitoring and wireless air integration has contributed to a notable 15% decrease in reported cases of decompression sickness.
- This enhanced safety record encourages new participants and drives existing divers to upgrade their full-color display dive computers and other high-performance dive gear.
- The parallel growth in technical diver training further stimulates demand for specialized equipment like integrated GPS and sonar systems.
What are the market trends shaping the Scuba Diving Equipment Industry?
- The integration of smart technology and wearable electronics is an emerging market trend. This development is enhancing diver safety and data accessibility through interconnected devices.
- A defining trend is the integration of smart technologies, transforming the market into a closed-ecosystem dive gear network. Innovations like the heads-up display (HUD) and air-integrated transmitters deliver real-time data, significantly enhancing situational awareness. The establishment of standards for short-range underwater wireless communication is accelerating dive gear interoperability, allowing different devices to connect seamlessly.
- This trend supports personalized dive planning and post-dive data analysis, with some systems demonstrating a 25% reduction in pre-dive setup time. The development of a modular weight system and composite cylinders addresses the demand for lightweight travel dive gear.
- Furthermore, the push for sustainability is driving the adoption of new materials, with products featuring recycled content showing sales growth 18% higher than conventional alternatives, indicating a strong market appetite for eco-innovations.
What challenges does the Scuba Diving Equipment Industry face during its growth?
- Environmental degradation and increasing regulatory scrutiny present a key challenge to industry growth.
- The market faces considerable headwinds from the high cost of entry and macroeconomic pressures that constrain discretionary spending. The initial investment for a complete set of scuba gear, including an advanced diving computer and thermal protection, remains a significant barrier for many potential participants.
- During periods of economic uncertainty, spending on high-cost recreational goods and associated travel has been observed to contract by as much as 8%. This directly impacts sales of specialized diving disciplines equipment and slows the upgrade cycle. Furthermore, the industry is challenged by the need to comply with evolving commercial diving safety standards and fragmented environmental regulations.
- The requirement for eco-neutral certification, for example, can increase production costs by up to 10%, adding further pressure on manufacturers navigating a competitive landscape and limiting investment in deep-sea exploration technology.
Exclusive Technavio Analysis on Customer Landscape
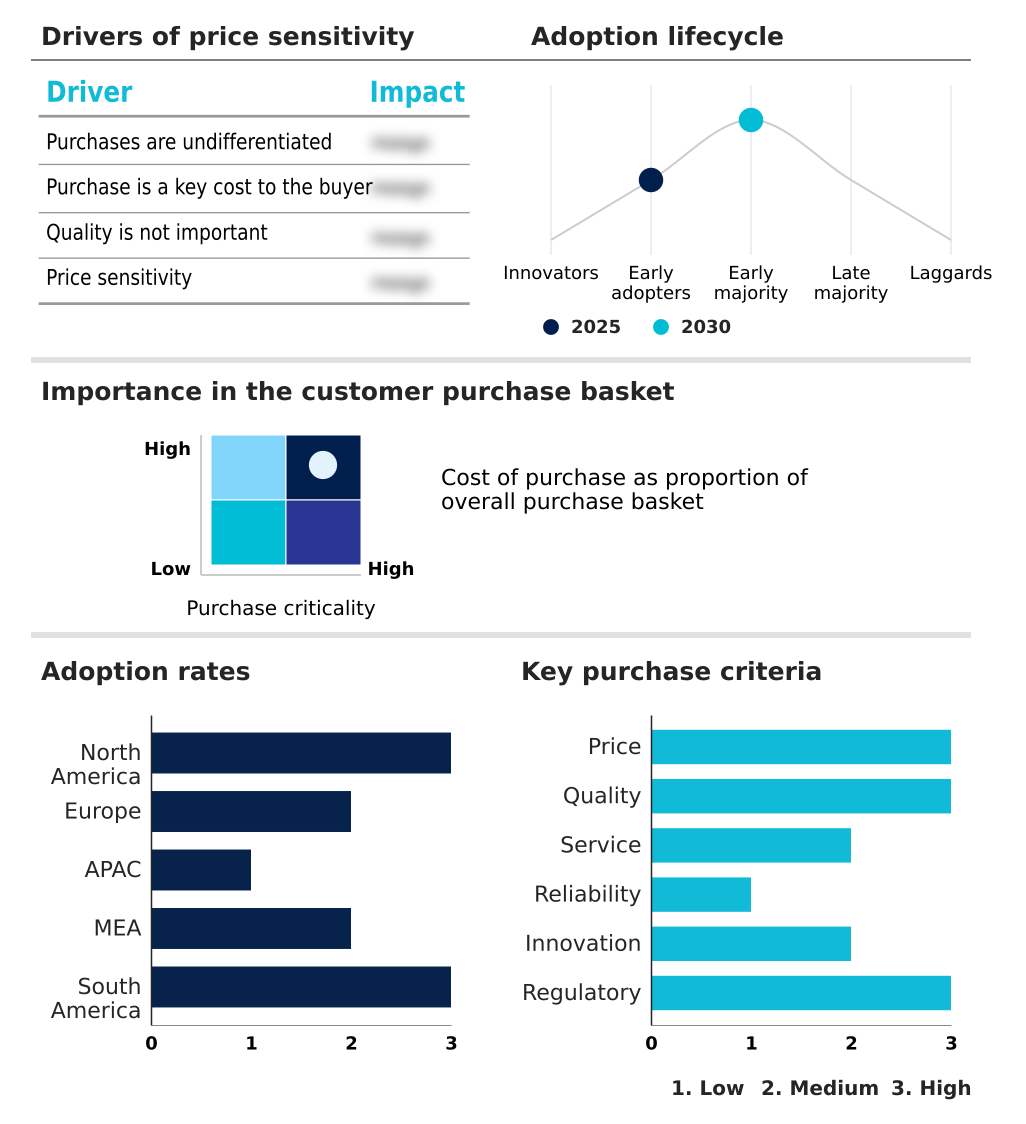
The scuba diving equipment market forecasting report includes the adoption lifecycle of the market, covering from the innovator’s stage to the laggard’s stage. It focuses on adoption rates in different regions based on penetration. Furthermore, the scuba diving equipment market report also includes key purchase criteria and drivers of price sensitivity to help companies evaluate and develop their market growth analysis strategies.
Customer Landscape of Scuba Diving Equipment Industry
Competitive Landscape
Companies are implementing various strategies, such as strategic alliances, scuba diving equipment market forecast, partnerships, mergers and acquisitions, geographical expansion, and product/service launches, to enhance their presence in the industry.
AP DIVING UK - The company provides specialized scuba diving equipment, including advanced AP Diving rebreathers and Buddy BCDs, catering to both technical and recreational divers with a focus on high-performance systems.
The industry research and growth report includes detailed analyses of the competitive landscape of the market and information about key companies, including:
- AP DIVING UK
- Apeks Marine Equipment Ltd.
- Aqualung Trading
- AQUATEC DUTON INDUSTRY CO. LTD.
- ATOMIC AQUATICS
- Bare Sports
- Beuchat International
- Cressi Sub Spa
- Desco Corporation
- Dive Rite
- Diving Unlimited International
- Dragerwerk AG and Co. KGaA
- Fourth Element Ltd.
- Halcyon Manufacturing Inc.
- Hollis Gear
- Johnson Outdoors Inc.
- Mares Spa
- Oceanic Worldwide
- Poseidon Diving Systems AB
- SEACSUB Spa
Qualitative and quantitative analysis of companies has been conducted to help clients understand the wider business environment as well as the strengths and weaknesses of key industry players. Data is qualitatively analyzed to categorize companies as pure play, category-focused, industry-focused, and diversified; it is quantitatively analyzed to categorize companies as dominant, leading, strong, tentative, and weak.
Recent Development and News in Scuba diving equipment market
- In June 2025, HEAD Group completed its acquisition of the Aqualung Group, a strategic move consolidating two major industry players to create a unified leader in water sports technology and expand global distribution networks.
- In March 2025, the United Nations Environment Programme (UNEP) launched its 'Dive for Debris' campaign, partnering with major certification agencies to mobilize recreational divers for marine litter data collection, significantly boosting the visibility of conservation-focused diving.
- In March 2025, the Institute of Electrical and Electronics Engineers (IEEE) established a new standard, IEEE 802.15.26, for short-range underwater wireless communication, enabling interoperability between diving devices from different manufacturers and accelerating innovation in connected gear.
- In February 2025, the International Organization for Standardization (ISO) published ISO 21417, a new standard for sidemount diving equipment, legitimizing the discipline and providing clear safety and performance benchmarks for manufacturers in this growing specialized segment.
Dive into Technavio’s robust research methodology, blending expert interviews, extensive data synthesis, and validated models for unparalleled Scuba Diving Equipment Market insights. See full methodology.
| Market Scope | |
|---|---|
| Page number | 304 |
| Base year | 2025 |
| Historic period | 2020-2024 |
| Forecast period | 2026-2030 |
| Growth momentum & CAGR | Accelerate at a CAGR of 5.1% |
| Market growth 2026-2030 | USD 1127.2 million |
| Market structure | Fragmented |
| YoY growth 2025-2026(%) | 4.7% |
| Key countries | US, Canada, Mexico, Germany, UK, France, Italy, Spain, Russia, China, Japan, Australia, India, Thailand, Indonesia, Egypt, UAE, South Africa, Saudi Arabia, Israel, Brazil, Argentina and Chile |
| Competitive landscape | Leading Companies, Market Positioning of Companies, Competitive Strategies, and Industry Risks |
Research Analyst Overview
- The scuba diving equipment market is defined by a push toward high-performance, specialized systems where material science and digital integration are paramount. The development of bio-laminate material and trilaminate drysuits exemplifies the focus on enhancing the thermal protection system while improving durability.
- Core life support gear, such as the buoyancy control device and rebreather technology, now frequently incorporates automatic buoyancy control and closed-circuit breathing for enhanced safety. Boardroom decisions are increasingly centered on achieving eco-neutral certification, a strategic move to capture the growing segment of environmentally conscious consumers.
- This is validated by market data showing products made with sustainable inputs like limestone-based neoprene and plant-based rubber achieve up to 18% higher sales growth. The integration of a personal locator beacon, advanced decompression computer, and surface location tracking into a unified digital ecosystem is becoming standard.
- Innovations in mechanical components, including the laminar flow valve and high-pressure hose, continue to improve reliability, reflecting a market where safety and performance are non-negotiable.
What are the Key Data Covered in this Scuba Diving Equipment Market Research and Growth Report?
-
What is the expected growth of the Scuba Diving Equipment Market between 2026 and 2030?
-
USD 1.13 billion, at a CAGR of 5.1%
-
-
What segmentation does the market report cover?
-
The report is segmented by Distribution Channel (Offline, and Online), Product (Bags and apparel, Rebreathers and regulators, Diving computers and gauges, and Others), Type (BCD and regulator, Cylinder and diving propulsion vehicle, Decompression chamber, Exposure suit, and Accessories) and Geography (North America, Europe, APAC, Middle East and Africa, South America)
-
-
Which regions are analyzed in the report?
-
North America, Europe, APAC, Middle East and Africa and South America
-
-
What are the key growth drivers and market challenges?
-
Growing interest in experiential tourism and underwater exploration, Environmental degradation and regulatory scrutiny
-
-
Who are the major players in the Scuba Diving Equipment Market?
-
AP DIVING UK, Apeks Marine Equipment Ltd., Aqualung Trading, AQUATEC DUTON INDUSTRY CO. LTD., ATOMIC AQUATICS, Bare Sports, Beuchat International, Cressi Sub Spa, Desco Corporation, Dive Rite, Diving Unlimited International, Dragerwerk AG and Co. KGaA, Fourth Element Ltd., Halcyon Manufacturing Inc., Hollis Gear, Johnson Outdoors Inc., Mares Spa, Oceanic Worldwide, Poseidon Diving Systems AB and SEACSUB Spa
-
Market Research Insights
- Market dynamics are increasingly shaped by consumer demand for enhanced safety and sustainability, driving significant innovation in high-performance dive gear. The focus on environmental impact reduction is evident, as products with eco-conscious manufacturing credentials achieve sales growth up to 18% higher than conventional counterparts. This trend influences everything from material sourcing to integrated life support systems.
- Concurrently, advancements in deep-sea exploration technology and underwater communication tools are improving dive safety and rescue capabilities. The adoption of equipment with integrated biometric monitoring has correlated with a 15% decrease in certain dive-related incidents.
- These shifts compel providers of professional dive operations to invest in modern fleets, aligning with both safety mandates and the growing interest in sustainable dive tourism. This creates a competitive landscape where technological proficiency and environmental stewardship are key differentiators.
We can help! Our analysts can customize this scuba diving equipment market research report to meet your requirements.
 RIA -
RIA - 
