Basalt Fiber Market Analysis, Size, and Forecast 2025-2029: APAC (China, Japan, and India), North America (US, Canada, and Mexico), Europe (Germany, France, and UK), South America (Brazil, Argentina, and Colombia), Middle East and Africa (Saudi Arabia, UAE, and South Africa), and Rest of World (ROW)

Basalt Fiber Market Analysis, Size, and Forecast 2025-2029:
APAC (China, Japan, and India), North America (US, Canada, and Mexico), Europe (Germany, France, and UK), South America (Brazil, Argentina, and Colombia), Middle East and Africa (Saudi Arabia, UAE, and South Africa), and Rest of World (ROW)

Published: Dec 2025 289 Pages SKU: IRTNTR74563

Market Overview at a Glance

$336.6 Mn
Market Opportunity
13.4%
CAGR 2024 - 2029
45.5%
APAC Growth
$243.1 Mn
Composites segment 2023

Basalt Fiber Market Size 2025-2029

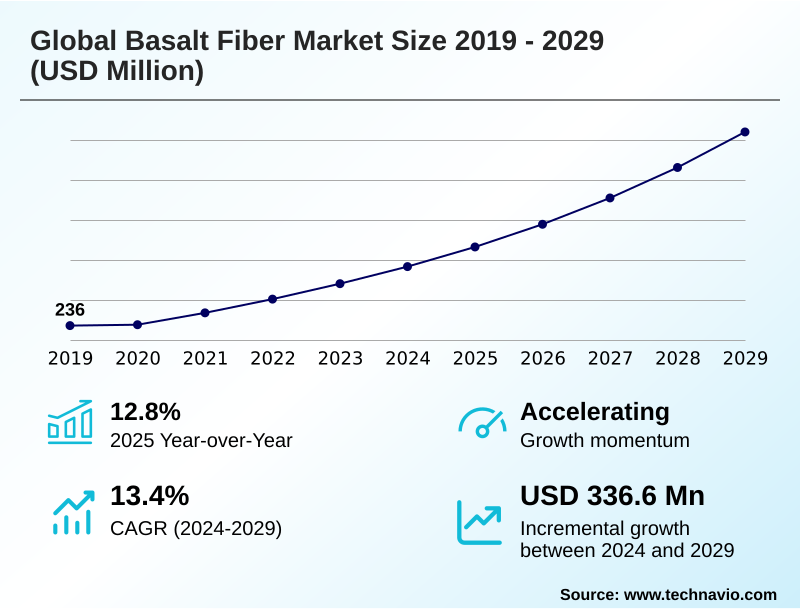
The basalt fiber market size is valued to increase by USD 336.6 million, at a CAGR of 13.4% from 2024 to 2029. Increase in renewable energy projects will drive the basalt fiber market.

Major Market Trends & Insights

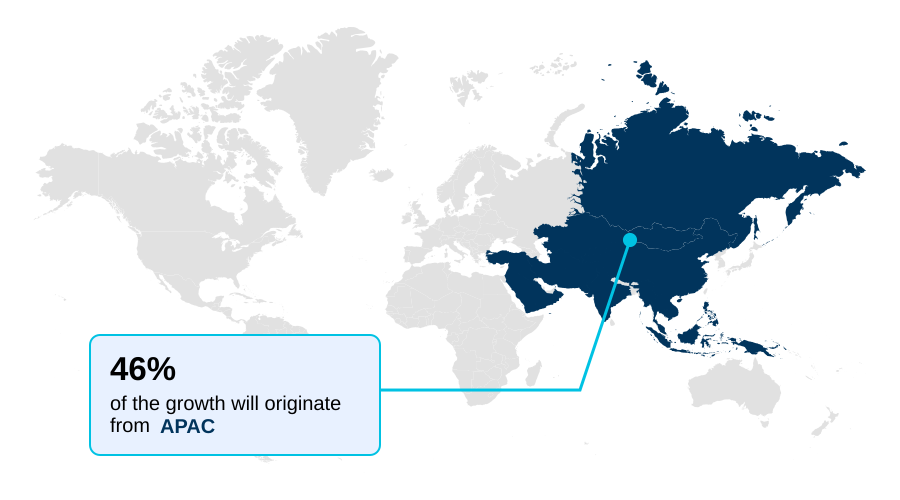
  • APAC dominated the market and accounted for a 45.5% growth during the forecast period.
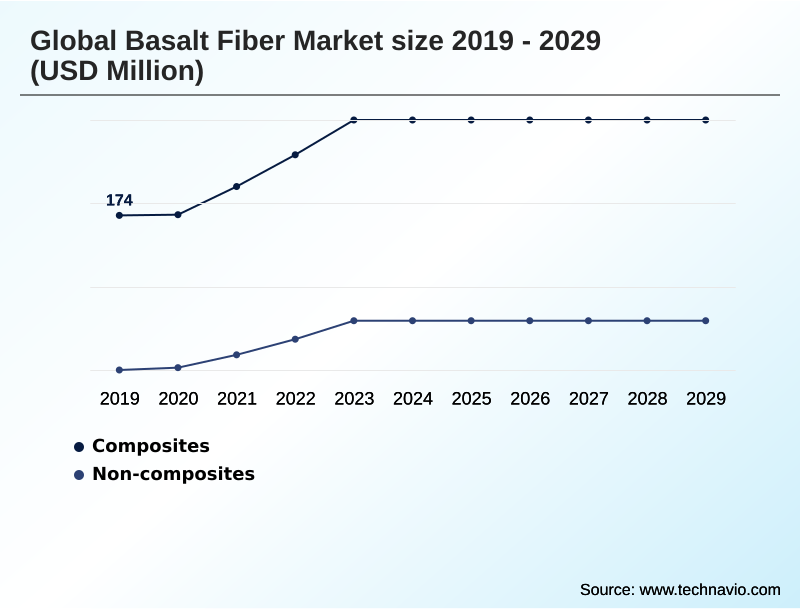
  • By Application - Composites segment was valued at USD 243.1 million in 2023
  • By End-user - Construction and infrastructure segment accounted for the largest market revenue share in 2023

Market Size & Forecast

  • Market Opportunities: USD 484.1 million
  • Market Future Opportunities: USD 336.6 million
  • CAGR from 2024 to 2029 : 13.4%

Market Summary

  • The Basalt Fiber Market is defined by the increasing adoption of this high-performance material across construction, automotive, and renewable energy sectors. Characterized by exceptional high tensile strength, inherent corrosion resistance, and thermal stability, basalt fiber offers a superior alternative to traditional materials.
  • A key driver is the global push for sustainable construction materials and automotive lightweighting, where basalt fiber composites contribute to energy efficiency and structural longevity. For instance, an infrastructure asset manager evaluating materials for a coastal bridge project may select basalt fiber rebar over conventional steel.
  • This decision would be based on lifecycle cost analysis showing a significant reduction in future maintenance expenses due to the material's immunity to corrosion. The market is also propelled by innovations in basalt fiber manufacturing, which are making products like basalt roving and chopped strands more cost-competitive.
  • However, challenges related to the intricate melt-spinning process and ensuring consistent quality from variable raw basalt rock sources can temper growth. The trend toward using this eco-friendly material for structural reinforcement in demanding environments continues to create new opportunities for the basalt fiber market.

What will be the Size of the Basalt Fiber Market during the forecast period?

Get Key Insights on Market Forecast (PDF) Request Free Sample

How is the Basalt Fiber Market Segmented?

The basalt fiber industry research report provides comprehensive data (region-wise segment analysis), with forecasts and estimates in "USD million" for the period 2025-2029, as well as historical data from 2019-2023 for the following segments.

  • Application
    • Composites
    • Non-composites
  • End-user
    • Construction and infrastructure
    • Automotive and transportation
    • Wind energy
    • Others
  • Form factor
    • Continuous basalt fiber
    • Discrete basalt fiber
  • Geography
    • APAC
      • China
      • Japan
      • India
    • North America
      • US
      • Canada
      • Mexico
    • Europe
      • Germany
      • France
      • UK
    • South America
      • Brazil
      • Argentina
      • Colombia
    • Middle East and Africa
      • Saudi Arabia
      • UAE
      • South Africa
    • Rest of World (ROW)

By Application Insights

The composites segment is estimated to witness significant growth during the forecast period.

The composites segment is pivotal, driven by demand for advanced materials in demanding applications. The use of basalt fiber composites, which incorporate materials from thermoplastic resins to cementitious matrices, is expanding.

These composites offer superior structural reinforcement in applications from automotive components to construction. The adoption of chopped strands as an additive and basalt fiber mesh for roadway reinforcement showcases the material's versatility.

Advances in furnace technology are improving production efficiency for these lightweight composite materials.

As industries prioritize sustainable construction materials and infrastructure durability, basalt fiber's role is growing, although its use in construction remains about one-third that of glass and steel fibers, indicating significant potential for market penetration in areas like pultruded products and basalt fiber concrete reinforcement.

Request Free Sample

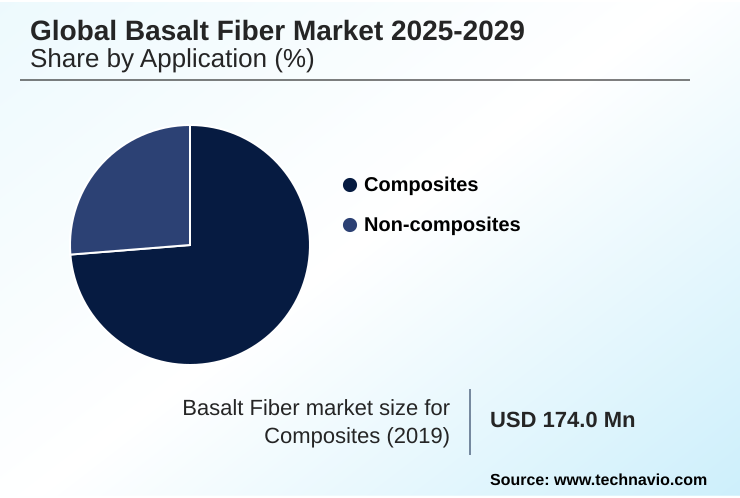
The Composites segment was valued at USD 243.1 million in 2023 and showed a gradual increase during the forecast period.

Request Free Sample

Regional Analysis

APAC is estimated to contribute 45.5% to the growth of the global market during the forecast period.Technavio’s analysts have elaborately explained the regional trends and drivers that shape the market during the forecast period.

See How Basalt Fiber Market Demand is Rising in APAC Request Free Sample

Geographically, APAC leads market expansion, contributing over 45% of incremental growth, fueled by vast infrastructure projects utilizing products like geogrids for roadway reinforcement.

The region's market is expanding at a rate of 14.2%, driven by demand for materials with high alkali resistance in concrete. North America, representing about 22.5% of growth, focuses on high-value applications where dielectric properties are critical for electrical insulation.

Europe prioritizes materials that are non-combustible for fire-resistant textiles and high-temperature insulation in regulated industries. The material's vibration damping qualities are also driving adoption in sports equipment composites, with some applications achieving a 20% improvement in user comfort.

Market Dynamics

Our researchers analyzed the data with 2024 as the base year, along with the key drivers, trends, and challenges. A holistic analysis of drivers will help companies refine their marketing strategies to gain a competitive advantage.

  • The strategic value of the basalt fiber market is increasingly evident in specific, high-performance use cases. For instance, the practice of using basalt fiber for concrete reinforcement is becoming standard in critical infrastructure to enhance durability. Decision-makers weighing basalt fiber rebar vs steel rebar cost are now factoring in lifecycle savings, which often favor basalt in corrosive environments.
  • The benefits of basalt fiber in automotive parts extend beyond simple lightweighting vehicles with basalt fiber composites to include improved vibration damping and thermal management. Understanding the manufacturing process of continuous basalt fiber is crucial for appreciating its quality and consistency, which is superior for applications like basalt fiber in wind turbine blade construction.
  • The excellent thermal insulation properties of basalt fiber make it ideal for basalt fiber for high-temperature insulation applications. Moreover, the diverse applications of chopped basalt fiber strands are expanding, from concrete admixtures to using basalt fiber in 3D printing. Basalt fiber composites in the aerospace industry are valued for their strength-to-weight ratio.
  • The environmental impact of basalt fiber production is relatively low, positioning it as a preferred basalt fiber as a sustainable building material. Its superior mechanical properties of basalt fiber roving, excellent corrosion resistance of basalt fiber in marine environments, and its role in improving concrete durability with basalt fiber are well-documented.
  • The material’s cost-effectiveness of basalt fiber materials is improving, expanding its use in basalt fiber applications in civil engineering and as part of a role of basalt fiber in fire protection strategy. Finally, its use for basalt fiber for reinforcing thermoplastic polymers is opening new industrial opportunities.
  • In terms of business operations, supply chains for projects incorporating these lightweight components can achieve transportation cost reductions of up to 15% compared to sourcing heavier, traditional materials.

What are the key market drivers leading to the rise in the adoption of Basalt Fiber Industry?

  • The global expansion of renewable energy projects, particularly in the wind and solar power sectors, serves as a key market driver.

  • Key market drivers are centered on the superior performance characteristics of basalt fiber in critical sectors.
  • The material's inherent high tensile strength and exceptional corrosion resistance make basalt fiber rebar a compelling alternative to steel, capable of extending infrastructure service life by over 25%.
  • In the renewable energy sector, basalt roving is crucial for manufacturing stronger and lighter wind turbine blades via filament winding. As an eco-friendly material with excellent thermal stability, it is also gaining traction in aerospace components.
  • Broadly, the demand across diverse basalt fiber applications, from marine applications to geotechnical applications, is fueled by its standing as one of the most reliable high-performance fibers available.

What are the market trends shaping the Basalt Fiber Industry?

  • A prominent market trend is the increasing demand for sustainable building and construction materials. This shift is driving the adoption of eco-friendly alternatives that improve structural durability and performance.

  • Market trends are shaped by innovations in basalt fiber manufacturing and a growing focus on automotive lightweighting. Advances in the melt-spinning process and bushing design have enhanced basalt fiber properties, leading to a 15% improvement in tensile strength consistency. This allows for more reliable applications of continuous basalt fiber products like basalt fiber tape and basalt twisted yarn.
  • Enhanced fiber sizing and surface treatment techniques improve chemical resistance, making basalt an ideal non-corrosive reinforcement for structural retrofitting, where its adoption has grown by 40% in specialized projects. These material improvements directly address industry needs for high-performance, durable solutions.

What challenges does the Basalt Fiber Industry face during its growth?

  • The inconsistent availability of high-quality basalt rock suitable for fiber production poses a significant challenge to consistent market growth and supply chain stability.

  • Market challenges persist despite basalt fiber's advantages, primarily stemming from manufacturing complexities and cost comparisons. The production of specialized products like gun roving for spray-up applications and composite macrofibre for concrete admixtures requires precise process control, where inconsistencies can lead to a 10% variation in performance.
  • In the basalt fiber vs carbon fiber debate, basalt offers a cost advantage but can be 25% more energy-intensive to produce than fiberglass. Scaling production for items like basalt fiber panels and pultrusion profiles using direct roving or assembled roving remains a hurdle.
  • These factors impact its adoption in price-sensitive areas such as friction materials and emerging fields like 3D printing filaments.

Exclusive Technavio Analysis on Customer Landscape

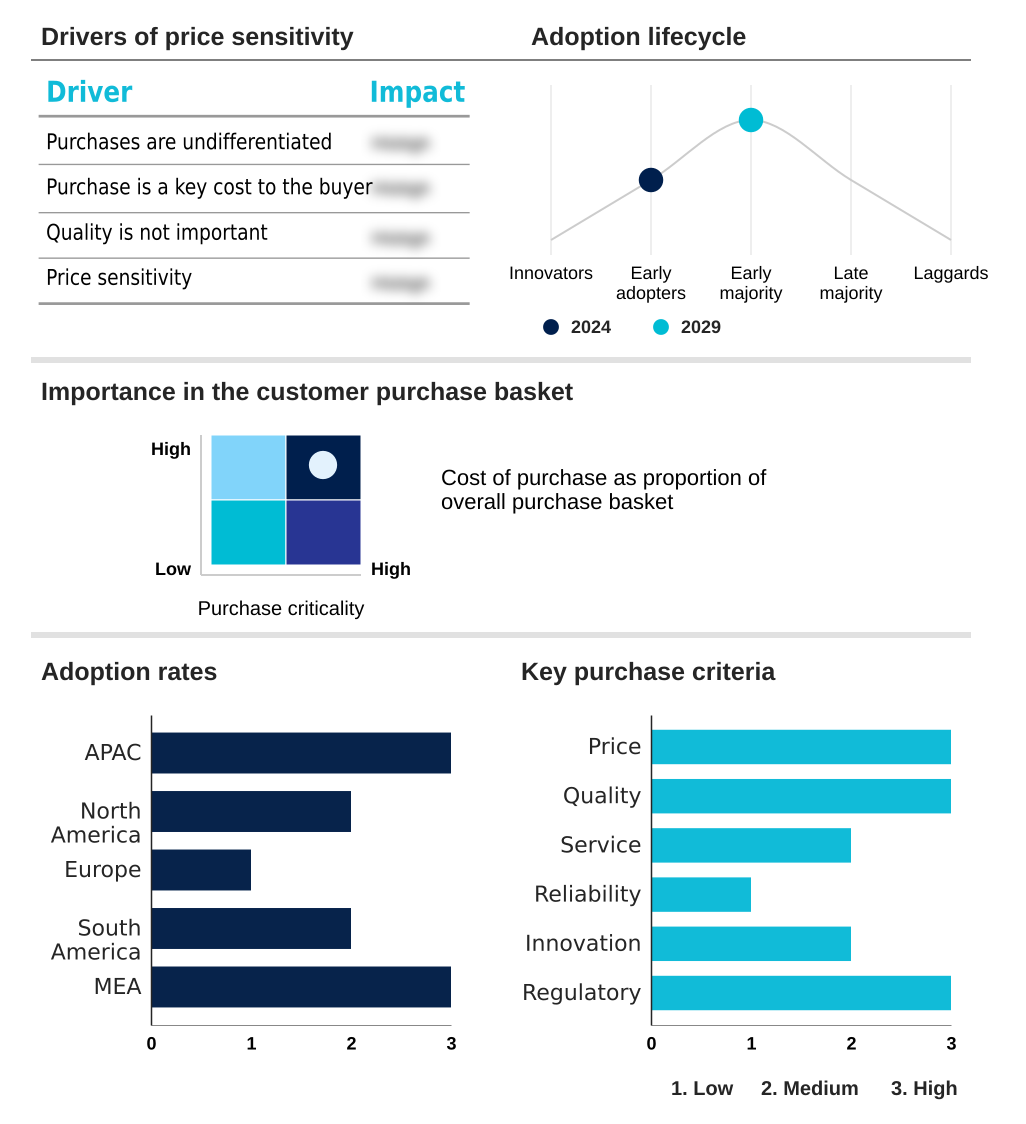
The basalt fiber market forecasting report includes the adoption lifecycle of the market, covering from the innovator’s stage to the laggard’s stage. It focuses on adoption rates in different regions based on penetration. Furthermore, the basalt fiber market report also includes key purchase criteria and drivers of price sensitivity to help companies evaluate and develop their market growth analysis strategies.

Customer Landscape of Basalt Fiber Industry

Competitive Landscape

Companies are implementing various strategies, such as strategic alliances, basalt fiber market forecast, partnerships, mergers and acquisitions, geographical expansion, and product/service launches, to enhance their presence in the industry.

Basalt Engineering LLC - Engineered basalt fiber products, including rovings and chopped strands, provide high-performance solutions for demanding industrial, structural, and composite applications.

The industry research and growth report includes detailed analyses of the competitive landscape of the market and information about key companies, including:

  • Basalt Engineering LLC
  • Basalt Fiber Tech
  • BFMTD Co. Ltd.
  • Deutsche Basalt Faser GmbH
  • Fiberbas Construction and Building Tech
  • Final Advanced Materials Sarl
  • Funique Composites Pvt. Ltd.
  • Galen LLC
  • HG GBF Basalt Fiber Co. Ltd.
  • Jianfeng Chemical Co. Ltd.
  • Jumeisheng Co. Ltd.
  • Kamenny Vek
  • Kodiak Fiberglass Rebar
  • Lavaintel
  • Sudaglass Fiber Technology Inc.
  • SWICOFIL AG
  • Technobasalt LLC
  • TLCBF High tech Co. Ltd.

Qualitative and quantitative analysis of companies has been conducted to help clients understand the wider business environment as well as the strengths and weaknesses of key industry players. Data is qualitatively analyzed to categorize companies as pure play, category-focused, industry-focused, and diversified; it is quantitatively analyzed to categorize companies as dominant, leading, strong, tentative, and weak.

Recent Development and News in Basalt fiber market

  • In October 2024, Kamenny Vek announced the launch of a new grade of high-modulus basalt fiber roving, specifically designed for filament winding of high-pressure vessels, enhancing burst strength by 15%.
  • In December 2024, Basalt Fiber Tech revealed a strategic partnership with a leading European automotive manufacturer to co-develop lightweight basalt fiber composite battery enclosures for their next-generation electric vehicle platform, as per their latest press release.
  • In February 2025, HG GBF Basalt Fiber Co. Ltd. confirmed the completion of its new production facility in China, increasing its annual continuous basalt fiber capacity by 20,000 metric tons to meet growing demand from the wind energy and construction sectors, reported by industry sources.
  • In April 2025, the US Department of Transportation officially approved the use of basalt fiber rebar as a primary reinforcement material in federally funded bridge construction projects in coastal regions, citing its superior corrosion resistance and lifecycle benefits.

Dive into Technavio’s robust research methodology, blending expert interviews, extensive data synthesis, and validated models for unparalleled Basalt Fiber Market insights. See full methodology.

Market Scope
Page number 289
Base year 2024
Historic period 2019-2023
Forecast period 2025-2029
Growth momentum & CAGR Accelerate at a CAGR of 13.4%
Market growth 2025-2029 USD 336.6 million
Market structure Fragmented
YoY growth 2024-2025(%) 12.8%
Key countries China, Japan, India, South Korea, Australia, Indonesia, US, Canada, Mexico, Germany, France, UK, Italy, The Netherlands, Spain, Brazil, Argentina, Colombia, Saudi Arabia, UAE, South Africa, Israel and Turkey
Competitive landscape Leading Companies, Market Positioning of Companies, Competitive Strategies, and Industry Risks

Request Free Sample

Research Analyst Overview

  • The market is characterized by a shift toward high-performance, sustainable materials, with basalt fiber composites at the forefront. The adoption of continuous basalt fiber and basalt roving is driven by their high tensile strength and corrosion resistance, which are critical for long-term structural integrity.
  • Innovations in furnace technology and the melt-spinning process are key, as they directly impact the quality of direct roving and assembled roving. Boardroom-level decisions are increasingly influenced by ESG goals, making this eco-friendly material a strategic choice for green initiatives. For example, recent process enhancements have yielded a 10% reduction in energy consumption during manufacturing.
  • This strengthens the material's value proposition for applications ranging from basalt fiber rebar in construction to filament winding in composites. The versatility extends to chopped strands for thermoplastic resins, basalt fiber tape for repairs, and fabrics offering high-temperature insulation. The material's excellent dielectric properties and alkali resistance further expand its utility in specialized industrial applications.

What are the Key Data Covered in this Basalt Fiber Market Research and Growth Report?

  • What is the expected growth of the Basalt Fiber Market between 2025 and 2029?

    • USD 336.6 million, at a CAGR of 13.4%

  • What segmentation does the market report cover?

    • The report is segmented by Application (Composites, and Non-composites), End-user (Construction and infrastructure, Automotive and transportation, Wind energy, and Others), Form Factor (Continuous basalt fiber, and Discrete basalt fiber) and Geography (APAC, North America, Europe, South America, Middle East and Africa)

  • Which regions are analyzed in the report?

    • APAC, North America, Europe, South America and Middle East and Africa

  • What are the key growth drivers and market challenges?

    • Increase in renewable energy projects, Poor availability of raw materials

  • Who are the major players in the Basalt Fiber Market?

    • Basalt Engineering LLC, Basalt Fiber Tech, BFMTD Co. Ltd., Deutsche Basalt Faser GmbH, Fiberbas Construction and Building Tech, Final Advanced Materials Sarl, Funique Composites Pvt. Ltd., Galen LLC, HG GBF Basalt Fiber Co. Ltd., Jianfeng Chemical Co. Ltd., Jumeisheng Co. Ltd., Kamenny Vek, Kodiak Fiberglass Rebar, Lavaintel, Sudaglass Fiber Technology Inc., SWICOFIL AG, Technobasalt LLC and TLCBF High tech Co. Ltd.

Market Research Insights

  • The market dynamics are heavily influenced by the pursuit of high-performance, sustainable materials across key industries. The adoption of lightweight composite materials in automotive lightweighting strategies has resulted in components that are up to 40% lighter than their steel counterparts, directly enhancing fuel efficiency.
  • In construction, the use of non-corrosive reinforcement like basalt fiber for infrastructure durability projects is projected to reduce long-term maintenance costs by over 25% compared to traditional methods. High-performance fibers are also critical for manufacturing advanced aerospace components and more efficient wind turbine blades.
  • The material's unique properties are expanding its use in niche marine applications and specialized geotechnical applications, where its resilience to harsh environments is a primary advantage.

We can help! Our analysts can customize this basalt fiber market research report to meet your requirements.

Get in touch

1. Executive Summary

1.1 Market overview

Executive Summary - Chart on Market Overview
Executive Summary - Data Table on Market Overview
Executive Summary - Chart on Global Market Characteristics
Executive Summary - Chart on Market by Geography
Executive Summary - Chart on Market Segmentation by Application
Executive Summary - Chart on Market Segmentation by End-user
Executive Summary - Chart on Market Segmentation by Form Factor
Executive Summary - Chart on Incremental Growth
Executive Summary - Data Table on Incremental Growth
Executive Summary - Chart on Company Market Positioning

2. Technavio Analysis

2.1 Analysis of price sensitivity, lifecycle, customer purchase basket, adoption rates, and purchase criteria

2.2 Criticality of inputs and Factors of differentiation

Chart on Overview on criticality of inputs and factors of differentiation

2.3 Factors of disruption

Chart on Overview on factors of disruption

2.4 Impact of drivers and challenges

Chart on Impact of drivers and challenges in 2024 and 2029

3. Market Landscape

3.1 Market ecosystem

Chart on Parent Market
Data Table on - Parent Market

3.2 Market characteristics

Chart on Market characteristics analysis

3.3 Value chain analysis

Chart on Value chain analysis

4. Market Sizing

4.1 Market definition

Data Table on Offerings of companies included in the market definition

4.2 Market segment analysis

Market segments

4.3 Market size 2024

4.4 Market outlook: Forecast for 2024-2029

Chart on Global - Market size and forecast 2024-2029 ($ million)
Data Table on Global - Market size and forecast 2024-2029 ($ million)
Chart on Global Market: Year-over-year growth 2024-2029 (%)
Data Table on Global Market: Year-over-year growth 2024-2029 (%)

5. Historic Market Size

5.1 Global Basalt Fiber Market 2019 - 2023

Historic Market Size - Data Table on Global Basalt Fiber Market 2019 - 2023 ($ million)

5.2 Application segment analysis 2019 - 2023

Historic Market Size - Application Segment 2019 - 2023 ($ million)

5.3 End-user segment analysis 2019 - 2023

Historic Market Size - End-user Segment 2019 - 2023 ($ million)

5.4 Form Factor segment analysis 2019 - 2023

Historic Market Size - Form Factor Segment 2019 - 2023 ($ million)

5.5 Geography segment analysis 2019 - 2023

Historic Market Size - Geography Segment 2019 - 2023 ($ million)

5.6 Country segment analysis 2019 - 2023

Historic Market Size - Country Segment 2019 - 2023 ($ million)

6. Qualitative Analysis

6.1 Impact of AI in the global basalt fiber market

7. Five Forces Analysis

7.1 Five forces summary

Five forces analysis - Comparison between 2024 and 2029

7.2 Bargaining power of buyers

Bargaining power of buyers - Impact of key factors 2024 and 2029

7.3 Bargaining power of suppliers

Bargaining power of suppliers - Impact of key factors in 2024 and 2029

7.4 Threat of new entrants

Threat of new entrants - Impact of key factors in 2024 and 2029

7.5 Threat of substitutes

Threat of substitutes - Impact of key factors in 2024 and 2029

7.6 Threat of rivalry

Threat of rivalry - Impact of key factors in 2024 and 2029

7.7 Market condition

Chart on Market condition - Five forces 2024 and 2029

8. Market Segmentation by Application

8.1 Market segments

Chart on Application - Market share 2024-2029 (%)
Data Table on Application - Market share 2024-2029 (%)

8.2 Comparison by Application

Chart on Comparison by Application
Data Table on Comparison by Application

8.3 Composites - Market size and forecast 2024-2029

Chart on Composites - Market size and forecast 2024-2029 ($ million)
Data Table on Composites - Market size and forecast 2024-2029 ($ million)
Chart on Composites - Year-over-year growth 2024-2029 (%)
Data Table on Composites - Year-over-year growth 2024-2029 (%)

8.4 Non-composites - Market size and forecast 2024-2029

Chart on Non-composites - Market size and forecast 2024-2029 ($ million)
Data Table on Non-composites - Market size and forecast 2024-2029 ($ million)
Chart on Non-composites - Year-over-year growth 2024-2029 (%)
Data Table on Non-composites - Year-over-year growth 2024-2029 (%)

8.5 Market opportunity by Application

Market opportunity by Application ($ million)
Data Table on Market opportunity by Application ($ million)

9. Market Segmentation by End-user

9.1 Market segments

Chart on End-user - Market share 2024-2029 (%)
Data Table on End-user - Market share 2024-2029 (%)

9.2 Comparison by End-user

Chart on Comparison by End-user
Data Table on Comparison by End-user

9.3 Construction and infrastructure - Market size and forecast 2024-2029

Chart on Construction and infrastructure - Market size and forecast 2024-2029 ($ million)
Data Table on Construction and infrastructure - Market size and forecast 2024-2029 ($ million)
Chart on Construction and infrastructure - Year-over-year growth 2024-2029 (%)
Data Table on Construction and infrastructure - Year-over-year growth 2024-2029 (%)

9.4 Automotive and transportation - Market size and forecast 2024-2029

Chart on Automotive and transportation - Market size and forecast 2024-2029 ($ million)
Data Table on Automotive and transportation - Market size and forecast 2024-2029 ($ million)
Chart on Automotive and transportation - Year-over-year growth 2024-2029 (%)
Data Table on Automotive and transportation - Year-over-year growth 2024-2029 (%)

9.5 Wind energy - Market size and forecast 2024-2029

Chart on Wind energy - Market size and forecast 2024-2029 ($ million)
Data Table on Wind energy - Market size and forecast 2024-2029 ($ million)
Chart on Wind energy - Year-over-year growth 2024-2029 (%)
Data Table on Wind energy - Year-over-year growth 2024-2029 (%)

9.6 Others - Market size and forecast 2024-2029

Chart on Others - Market size and forecast 2024-2029 ($ million)
Data Table on Others - Market size and forecast 2024-2029 ($ million)
Chart on Others - Year-over-year growth 2024-2029 (%)
Data Table on Others - Year-over-year growth 2024-2029 (%)

9.7 Market opportunity by End-user

Market opportunity by End-user ($ million)
Data Table on Market opportunity by End-user ($ million)

10. Market Segmentation by Form Factor

10.1 Market segments

Chart on Form Factor - Market share 2024-2029 (%)
Data Table on Form Factor - Market share 2024-2029 (%)

10.2 Comparison by Form Factor

Chart on Comparison by Form Factor
Data Table on Comparison by Form Factor

10.3 Continuous basalt fiber - Market size and forecast 2024-2029

Chart on Continuous basalt fiber - Market size and forecast 2024-2029 ($ million)
Data Table on Continuous basalt fiber - Market size and forecast 2024-2029 ($ million)
Chart on Continuous basalt fiber - Year-over-year growth 2024-2029 (%)
Data Table on Continuous basalt fiber - Year-over-year growth 2024-2029 (%)

10.4 Discrete basalt fiber - Market size and forecast 2024-2029

Chart on Discrete basalt fiber - Market size and forecast 2024-2029 ($ million)
Data Table on Discrete basalt fiber - Market size and forecast 2024-2029 ($ million)
Chart on Discrete basalt fiber - Year-over-year growth 2024-2029 (%)
Data Table on Discrete basalt fiber - Year-over-year growth 2024-2029 (%)

10.5 Market opportunity by Form Factor

Market opportunity by Form Factor ($ million)
Data Table on Market opportunity by Form Factor ($ million)

11. Customer Landscape

11.1 Customer landscape overview

Analysis of price sensitivity, lifecycle, customer purchase basket, adoption rates, and purchase criteria

12. Geographic Landscape

12.1 Geographic segmentation

Chart on Market share by geography 2024-2029 (%)
Data Table on Market share by geography 2024-2029 (%)

12.2 Geographic comparison

Chart on Geographic comparison
Data Table on Geographic comparison

12.3 APAC - Market size and forecast 2024-2029

Chart on APAC - Market size and forecast 2024-2029 ($ million)
Data Table on APAC - Market size and forecast 2024-2029 ($ million)
Chart on APAC - Year-over-year growth 2024-2029 (%)
Data Table on APAC - Year-over-year growth 2024-2029 (%)
Chart on Regional Comparison - APAC
Data Table on Regional Comparison - APAC

12.3.1 China - Market size and forecast 2024-2029

Chart on China - Market size and forecast 2024-2029 ($ million)
Data Table on China - Market size and forecast 2024-2029 ($ million)
Chart on China - Year-over-year growth 2024-2029 (%)
Data Table on China - Year-over-year growth 2024-2029 (%)

12.3.2 Japan - Market size and forecast 2024-2029

Chart on Japan - Market size and forecast 2024-2029 ($ million)
Data Table on Japan - Market size and forecast 2024-2029 ($ million)
Chart on Japan - Year-over-year growth 2024-2029 (%)
Data Table on Japan - Year-over-year growth 2024-2029 (%)

12.3.3 India - Market size and forecast 2024-2029

Chart on India - Market size and forecast 2024-2029 ($ million)
Data Table on India - Market size and forecast 2024-2029 ($ million)
Chart on India - Year-over-year growth 2024-2029 (%)
Data Table on India - Year-over-year growth 2024-2029 (%)

12.3.4 South Korea - Market size and forecast 2024-2029

Chart on South Korea - Market size and forecast 2024-2029 ($ million)
Data Table on South Korea - Market size and forecast 2024-2029 ($ million)
Chart on South Korea - Year-over-year growth 2024-2029 (%)
Data Table on South Korea - Year-over-year growth 2024-2029 (%)

12.3.5 Australia - Market size and forecast 2024-2029

Chart on Australia - Market size and forecast 2024-2029 ($ million)
Data Table on Australia - Market size and forecast 2024-2029 ($ million)
Chart on Australia - Year-over-year growth 2024-2029 (%)
Data Table on Australia - Year-over-year growth 2024-2029 (%)

12.3.6 Indonesia - Market size and forecast 2024-2029

Chart on Indonesia - Market size and forecast 2024-2029 ($ million)
Data Table on Indonesia - Market size and forecast 2024-2029 ($ million)
Chart on Indonesia - Year-over-year growth 2024-2029 (%)
Data Table on Indonesia - Year-over-year growth 2024-2029 (%)

12.4 North America - Market size and forecast 2024-2029

Chart on North America - Market size and forecast 2024-2029 ($ million)
Data Table on North America - Market size and forecast 2024-2029 ($ million)
Chart on North America - Year-over-year growth 2024-2029 (%)
Data Table on North America - Year-over-year growth 2024-2029 (%)
Chart on Regional Comparison - North America
Data Table on Regional Comparison - North America

12.4.1 US - Market size and forecast 2024-2029

Chart on US - Market size and forecast 2024-2029 ($ million)
Data Table on US - Market size and forecast 2024-2029 ($ million)
Chart on US - Year-over-year growth 2024-2029 (%)
Data Table on US - Year-over-year growth 2024-2029 (%)

12.4.2 Canada - Market size and forecast 2024-2029

Chart on Canada - Market size and forecast 2024-2029 ($ million)
Data Table on Canada - Market size and forecast 2024-2029 ($ million)
Chart on Canada - Year-over-year growth 2024-2029 (%)
Data Table on Canada - Year-over-year growth 2024-2029 (%)

12.4.3 Mexico - Market size and forecast 2024-2029

Chart on Mexico - Market size and forecast 2024-2029 ($ million)
Data Table on Mexico - Market size and forecast 2024-2029 ($ million)
Chart on Mexico - Year-over-year growth 2024-2029 (%)
Data Table on Mexico - Year-over-year growth 2024-2029 (%)

12.5 Europe - Market size and forecast 2024-2029

Chart on Europe - Market size and forecast 2024-2029 ($ million)
Data Table on Europe - Market size and forecast 2024-2029 ($ million)
Chart on Europe - Year-over-year growth 2024-2029 (%)
Data Table on Europe - Year-over-year growth 2024-2029 (%)
Chart on Regional Comparison - Europe
Data Table on Regional Comparison - Europe

12.5.1 Germany - Market size and forecast 2024-2029

Chart on Germany - Market size and forecast 2024-2029 ($ million)
Data Table on Germany - Market size and forecast 2024-2029 ($ million)
Chart on Germany - Year-over-year growth 2024-2029 (%)
Data Table on Germany - Year-over-year growth 2024-2029 (%)

12.5.2 France - Market size and forecast 2024-2029

Chart on France - Market size and forecast 2024-2029 ($ million)
Data Table on France - Market size and forecast 2024-2029 ($ million)
Chart on France - Year-over-year growth 2024-2029 (%)
Data Table on France - Year-over-year growth 2024-2029 (%)

12.5.3 UK - Market size and forecast 2024-2029

Chart on UK - Market size and forecast 2024-2029 ($ million)
Data Table on UK - Market size and forecast 2024-2029 ($ million)
Chart on UK - Year-over-year growth 2024-2029 (%)
Data Table on UK - Year-over-year growth 2024-2029 (%)

12.5.4 Italy - Market size and forecast 2024-2029

Chart on Italy - Market size and forecast 2024-2029 ($ million)
Data Table on Italy - Market size and forecast 2024-2029 ($ million)
Chart on Italy - Year-over-year growth 2024-2029 (%)
Data Table on Italy - Year-over-year growth 2024-2029 (%)

12.5.5 The Netherlands - Market size and forecast 2024-2029

Chart on The Netherlands - Market size and forecast 2024-2029 ($ million)
Data Table on The Netherlands - Market size and forecast 2024-2029 ($ million)
Chart on The Netherlands - Year-over-year growth 2024-2029 (%)
Data Table on The Netherlands - Year-over-year growth 2024-2029 (%)

12.5.6 Spain - Market size and forecast 2024-2029

Chart on Spain - Market size and forecast 2024-2029 ($ million)
Data Table on Spain - Market size and forecast 2024-2029 ($ million)
Chart on Spain - Year-over-year growth 2024-2029 (%)
Data Table on Spain - Year-over-year growth 2024-2029 (%)

12.6 South America - Market size and forecast 2024-2029

Chart on South America - Market size and forecast 2024-2029 ($ million)
Data Table on South America - Market size and forecast 2024-2029 ($ million)
Chart on South America - Year-over-year growth 2024-2029 (%)
Data Table on South America - Year-over-year growth 2024-2029 (%)
Chart on Regional Comparison - South America
Data Table on Regional Comparison - South America

12.6.1 Brazil - Market size and forecast 2024-2029

Chart on Brazil - Market size and forecast 2024-2029 ($ million)
Data Table on Brazil - Market size and forecast 2024-2029 ($ million)
Chart on Brazil - Year-over-year growth 2024-2029 (%)
Data Table on Brazil - Year-over-year growth 2024-2029 (%)

12.6.2 Argentina - Market size and forecast 2024-2029

Chart on Argentina - Market size and forecast 2024-2029 ($ million)
Data Table on Argentina - Market size and forecast 2024-2029 ($ million)
Chart on Argentina - Year-over-year growth 2024-2029 (%)
Data Table on Argentina - Year-over-year growth 2024-2029 (%)

12.6.3 Colombia - Market size and forecast 2024-2029

Chart on Colombia - Market size and forecast 2024-2029 ($ million)
Data Table on Colombia - Market size and forecast 2024-2029 ($ million)
Chart on Colombia - Year-over-year growth 2024-2029 (%)
Data Table on Colombia - Year-over-year growth 2024-2029 (%)

12.7 Middle East and Africa - Market size and forecast 2024-2029

Chart on Middle East and Africa - Market size and forecast 2024-2029 ($ million)
Data Table on Middle East and Africa - Market size and forecast 2024-2029 ($ million)
Chart on Middle East and Africa - Year-over-year growth 2024-2029 (%)
Data Table on Middle East and Africa - Year-over-year growth 2024-2029 (%)
Chart on Regional Comparison - Middle East and Africa
Data Table on Regional Comparison - Middle East and Africa

12.7.1 Saudi Arabia - Market size and forecast 2024-2029

Chart on Saudi Arabia - Market size and forecast 2024-2029 ($ million)
Data Table on Saudi Arabia - Market size and forecast 2024-2029 ($ million)
Chart on Saudi Arabia - Year-over-year growth 2024-2029 (%)
Data Table on Saudi Arabia - Year-over-year growth 2024-2029 (%)

12.7.2 UAE - Market size and forecast 2024-2029

Chart on UAE - Market size and forecast 2024-2029 ($ million)
Data Table on UAE - Market size and forecast 2024-2029 ($ million)
Chart on UAE - Year-over-year growth 2024-2029 (%)
Data Table on UAE - Year-over-year growth 2024-2029 (%)

12.7.3 South Africa - Market size and forecast 2024-2029

Chart on South Africa - Market size and forecast 2024-2029 ($ million)
Data Table on South Africa - Market size and forecast 2024-2029 ($ million)
Chart on South Africa - Year-over-year growth 2024-2029 (%)
Data Table on South Africa - Year-over-year growth 2024-2029 (%)

12.7.4 Israel - Market size and forecast 2024-2029

Chart on Israel - Market size and forecast 2024-2029 ($ million)
Data Table on Israel - Market size and forecast 2024-2029 ($ million)
Chart on Israel - Year-over-year growth 2024-2029 (%)
Data Table on Israel - Year-over-year growth 2024-2029 (%)

12.7.5 Turkey - Market size and forecast 2024-2029

Chart on Turkey - Market size and forecast 2024-2029 ($ million)
Data Table on Turkey - Market size and forecast 2024-2029 ($ million)
Chart on Turkey - Year-over-year growth 2024-2029 (%)
Data Table on Turkey - Year-over-year growth 2024-2029 (%)

12.8 Market opportunity by geography

Market opportunity by geography ($ million)
Data Tables on Market opportunity by geography ($ million)

13. Drivers, Challenges, and Opportunity

13.1 Market drivers

Increase in renewable energy projects
Rising use of sustainable and eco-friendly materials
Lightweight and high-strength properties of basalt fiber

13.2 Market challenges

Poor availability of raw materials
Inconsistency in basalt fiber quality
Intricate manufacturing process of basalt fibers

13.3 Impact of drivers and challenges

Impact of drivers and challenges in 2024 and 2029

13.4 Market opportunities

Increasing demand for sustainable building and construction materials
Growing adoption of basalt fiber in automotive industry
Innovation in basalt fiber manufacturing

14. Competitive Landscape

14.1 Overview

14.2

Overview on criticality of inputs and factors of differentiation

14.3 Landscape disruption

Overview on factors of disruption

14.4 Industry risks

Impact of key risks on business

15. Competitive Analysis

15.1 Companies profiled

Companies covered

15.2 Company ranking index

15.3 Market positioning of companies

Matrix on companies position and classification

15.4 Basalt Engineering LLC

Basalt Engineering LLC - Overview
Basalt Engineering LLC - Product / Service
Basalt Engineering LLC - Key offerings
SWOT

15.5 Basalt Fiber Tech

Basalt Fiber Tech - Overview
Basalt Fiber Tech - Product / Service
Basalt Fiber Tech - Key offerings
SWOT

15.6 BFMTD Co. Ltd.

BFMTD Co. Ltd. - Overview
BFMTD Co. Ltd. - Product / Service
BFMTD Co. Ltd. - Key offerings
SWOT

15.7 Deutsche Basalt Faser GmbH

Deutsche Basalt Faser GmbH - Overview
Deutsche Basalt Faser GmbH - Product / Service
Deutsche Basalt Faser GmbH - Key offerings
SWOT

15.8 Fiberbas Construction and Building Tech

Fiberbas Construction and Building Tech - Overview
Fiberbas Construction and Building Tech - Product / Service
Fiberbas Construction and Building Tech - Key offerings
SWOT

15.9 Final Advanced Materials Sarl

Final Advanced Materials Sarl - Overview
Final Advanced Materials Sarl - Product / Service
Final Advanced Materials Sarl - Key offerings
SWOT

15.10 HG GBF Basalt Fiber Co. Ltd.

HG GBF Basalt Fiber Co. Ltd. - Overview
HG GBF Basalt Fiber Co. Ltd. - Product / Service
HG GBF Basalt Fiber Co. Ltd. - Key offerings
SWOT

15.11 Jianfeng Chemical Co. Ltd.

Jianfeng Chemical Co. Ltd. - Overview
Jianfeng Chemical Co. Ltd. - Product / Service
Jianfeng Chemical Co. Ltd. - Key offerings
SWOT

15.12 Jumeisheng Co. Ltd.

Jumeisheng Co. Ltd. - Overview
Jumeisheng Co. Ltd. - Product / Service
Jumeisheng Co. Ltd. - Key offerings
SWOT

15.13 Kamenny Vek

Kamenny Vek - Overview
Kamenny Vek - Product / Service
Kamenny Vek - Key offerings
SWOT

15.14 Kodiak Fiberglass Rebar

Kodiak Fiberglass Rebar - Overview
Kodiak Fiberglass Rebar - Product / Service
Kodiak Fiberglass Rebar - Key offerings
SWOT

15.15 Lavaintel

Lavaintel - Overview
Lavaintel - Product / Service
Lavaintel - Key offerings
SWOT

15.16 SWICOFIL AG

SWICOFIL AG - Overview
SWICOFIL AG - Product / Service
SWICOFIL AG - Key offerings
SWOT

15.17 Technobasalt LLC

Technobasalt LLC - Overview
Technobasalt LLC - Product / Service
Technobasalt LLC - Key offerings
SWOT

15.18 TLCBF High tech Co. Ltd.

TLCBF High tech Co. Ltd. - Overview
TLCBF High tech Co. Ltd. - Product / Service
TLCBF High tech Co. Ltd. - Key offerings
SWOT

16. Appendix

16.1 Scope of the report

Market definition
Objectives
Notes and caveats

16.2 Inclusions and exclusions checklist

Inclusions checklist
Exclusions checklist

16.3 Currency conversion rates for US$

16.4 Research methodology

16.5 Data procurement

Information sources

16.6 Data validation

16.7 Validation techniques employed for market sizing

16.8 Data synthesis

16.9 360 degree market analysis

16.10 List of abbreviations

Research Methodology

Technavio presents a detailed picture of the market by way of study, synthesis, and summation of data from multiple sources. The analysts have presented the various facets of the market with a particular focus on identifying the key industry influencers. The data thus presented is comprehensive, reliable, and the result of extensive research, both primary and secondary.

INFORMATION SOURCES

Primary sources

  • Manufacturers and suppliers
  • Channel partners
  • Industry experts
  • Strategic decision makers

Secondary sources

  • Industry journals and periodicals
  • Government data
  • Financial reports of key industry players
  • Historical data
  • Press releases

DATA ANALYSIS

Data Synthesis

  • Collation of data
  • Estimation of key figures
  • Analysis of derived insights

Data Validation

  • Triangulation with data models
  • Reference against proprietary databases
  • Corroboration with industry experts

REPORT WRITING

Qualitative

  • Market drivers
  • Market challenges
  • Market trends
  • Five forces analysis

Quantitative

  • Market size and forecast
  • Market segmentation
  • Geographical insights
  • Competitive landscape

Interested in this report?

Get your sample now to see our research methodology and insights!

Download Now

Frequently Asked Questions

Basalt Fiber market growth will increase by USD 336.6 million during 2025-2029.

The Basalt Fiber market is expected to grow at a CAGR of 13.4% during 2025-2029.

Basalt Fiber market is segmented by Application (Composites, Non-composites) End-user (Construction and infrastructure, Automotive and transportation, Wind energy, Others) Form factor (Continuous basalt fiber, Discrete basalt fiber)

Basalt Engineering LLC, Basalt Fiber Tech, BFMTD Co. Ltd., Deutsche Basalt Faser GmbH, Fiberbas Construction and Building Tech, Final Advanced Materials Sarl, Funique Composites Pvt. Ltd., Galen LLC, HG GBF Basalt Fiber Co. Ltd., Jianfeng Chemical Co. Ltd., Jumeisheng Co. Ltd., Kamenny Vek, Kodiak Fiberglass Rebar, Lavaintel, Sudaglass Fiber Technology Inc., SWICOFIL AG, Technobasalt LLC, TLCBF High tech Co. Ltd. are a few of the key vendors in the Basalt Fiber market.

APAC will register the highest growth rate of 45.5% among the other regions. Therefore, the Basalt Fiber market in APAC is expected to garner significant business opportunities for the vendors during the forecast period.

China, Japan, India, South Korea, Australia, Indonesia, US, Canada, Mexico, Germany, France, UK, Italy, The Netherlands, Spain, Brazil, Argentina, Colombia, Saudi Arabia, UAE, South Africa, Israel, Turkey

  • Increase in renewable energy projects is the driving factor this market.

The Basalt Fiber market vendors should focus on grabbing business opportunities from the Application segment as it accounted for the largest market share in the base year.