Home Entertainment Market Analysis, Size, and Forecast 2025-2029: North America (US and Canada), Europe (France, Germany, and UK), APAC (China, India, Japan, and South Korea), South America (Brazil), and Rest of World (ROW)

Home Entertainment Market Analysis, Size, and Forecast 2025-2029:
North America (US and Canada), Europe (France, Germany, and UK), APAC (China, India, Japan, and South Korea), South America (Brazil), and Rest of World (ROW)

Published: Jun 2025 206 Pages SKU: IRTNTR76802

Market Overview at a Glance

$138 B
Market Opportunity
8.3%
CAGR
7.5
YoY growth 2024-2025(%)

Home Entertainment Market Size 2025-2029

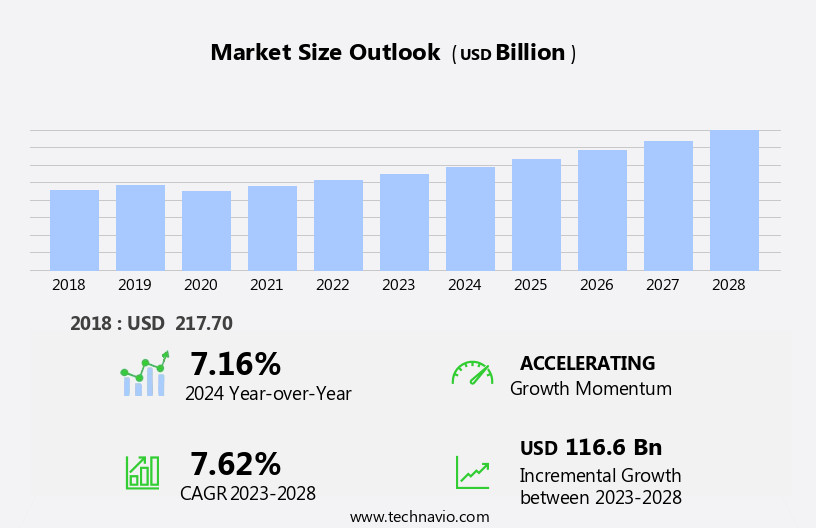
The home entertainment market size is forecast to increase by USD 138 billion at a CAGR of 8.3% between 2024 and 2029.

  • The market is experiencing significant shifts, driven by the emergence of smart televisions and the integration of advanced technologies in Over-The-Top (OTT) services. These developments are transforming consumer viewing habits, enabling on-demand access to a vast array of content. However, the market faces challenges as well. The high energy consumption of televisions, a growing concern for environmentally-conscious consumers, is one such challenge. The integration of Bluetooth and Wi-Fi connectivity in home entertainment systems has enabled seamless streaming of audio and video content.
  • To capitalize on opportunities and navigate challenges effectively, market participants must stay abreast of technological advancements and consumer preferences, while also focusing on sustainability and energy efficiency. Companies must address this issue through energy-efficient designs and innovative technologies. Another challenge is the intensifying competition in the market, as new players enter the fray and existing ones expand their offerings. These technologies continue to evolve, integrating smart home capabilities, Bluetooth and Wi-Fi connectivity, and cloud services.

What will be the Size of the Home Entertainment Market during the forecast period?

Home Entertainment Market Size

 Explore in-depth regional segment analysis with market size data - historical 2019-2023 and forecasts 2025-2029 - in the full report.  
Request Free Sample

  • The market is characterized by continuous advancements in technology, with picture quality and display technology taking center stage. Software updates and device compatibility ensure seamless integration of new features and technologies, such as OLED and QLED, into existing systems. Digital content licensing and copyright protection are crucial aspects of the market, ensuring access to high-quality digital content while maintaining intellectual property rights. Energy consumption and user experience design are increasingly important factors, with energy-efficient LED backlighting and digital signal processing optimizing power usage and enhancing viewing experiences.
  • Platform integration and cable management contribute to a clutter-free setup, while user interface design and cloud storage facilitate easy access to content. Room acoustics and audio calibration ensure optimal sound performance, and installation services cater to users seeking professional assistance. Environmental impact is a growing concern, with companies focusing on reducing waste and improving sustainability. As the market evolves, trends include advancements in OLED and QLED technology, as well as the integration of AI and machine learning for enhanced user experiences. The market encompasses a range of home entertainment-related devices, including high-definition television sets, projectors, soundbars, and home theater in a box (HTIB) systems.

How is this Home Entertainment Industry segmented?

The home entertainment industry research report provides comprehensive data (region-wise segment analysis), with forecasts and estimates in "USD billion" for the period 2025-2029, as well as historical data from 2019-2023 for the following segments.

  • Product
    • Video device
    • Audio device
    • Gaming console
  • Distribution Channel
    • Offline
    • Online
  • Application
    • Residential
    • Commercial
  • Geography
    • North America
      • US
      • Canada
    • Europe
      • France
      • Germany
      • UK
    • APAC
      • China
      • India
      • Japan
      • South Korea
    • South America
      • Brazil
    • Rest of World (ROW)

By Product Insights

The video device segment comprises video-enabled consumer electronic devices such as televisions, Blu-ray and DVD players, projectors, and streaming devices. The video device segment is expected to register a significant share in the global home entertainment market during the forecast period. The growth in the video device segment can be attributed to the growing consumer preference for visual entertainment. Factors such as rapid innovations in the existing products, an increase in the digitalization of electronic goods, and a growing tech-savvy urban population in developing countries will increase the demand for video devices. Video devices are undergoing groundbreaking improvements such as the introduction of 8K and 4K resolution, micro-LED and mini-LED displays, high dynamic range (HDR) video in televisions, and the emergence of wireless and portable projectors, which fuel the demand for the video device segment. Moreover, video devices are economically viable for mass production, making them affordable to consumers.

The video device segment, which includes televisions, Blu-ray and DVD players, projectors, and streaming devices, holds a substantial share in this market. This growth can be attributed to the increasing consumer preference for visual entertainment and advancements in technology. Innovations such as 8K and 4K resolution, HDR video in televisions, and wireless and portable projectors fuel the demand for video devices. Additionally, the digitalization of electronic goods and the expanding tech-savvy population in developing countries contribute to the market's growth. The emergence of smart home integration, multi-room audio, and voice control further enhances the entertainment experience, driving the market forward. Therefore, all such factors will foster the growth of the video device segment, which, in turn, will propel the growth of the global home entertainment market during the forecast period.

Home Entertainment Market Size

 Download Free Sample Report

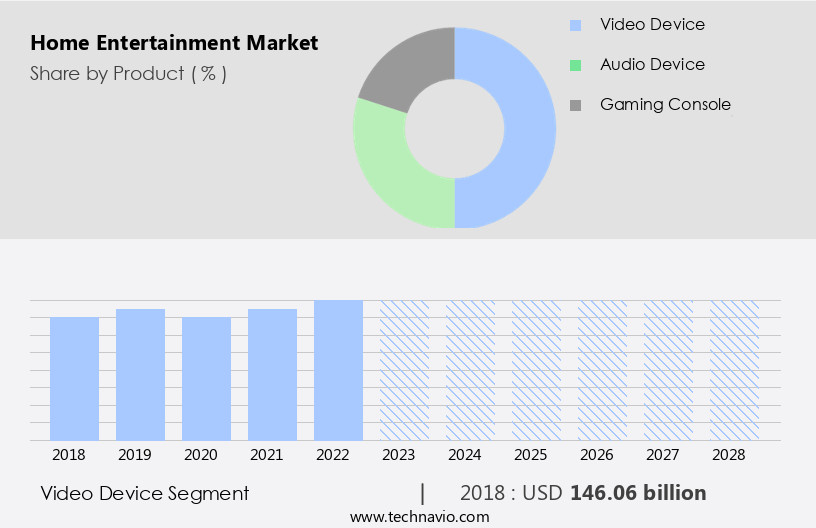
The Video device segment was valued at USD 154.80 billion in 2019 and showed a gradual increase during the forecast period.

The Home Entertainment Market is evolving rapidly, driven by innovations in sound and display technologies. Superior audio quality is achieved through advanced sound processing and strategic speaker placement, delivering engrossing experiences. The rise of OLED technology enhances visual performance with deeper blacks and vibrant colors. Streaming platforms benefit from optimized streaming bandwidth and improved network performance, ensuring seamless content delivery. Consumers rely on mobile apps for smart control, adjusting settings and accessing entertainment on-the-go. Regular firmware updates enhance device functionality, improving compatibility and security. 

The Home Entertainment Market is rapidly evolving with cutting-edge technologies like audio receivers, Blu-ray players, and surround sound systems enhancing user experience. The rise of Dolby Atmos ensures superior sound quality, complementing high frame rate visuals for a lifelike viewing experience. Traditional cable TV competes with advanced media players, while wireless speakers and portable speakers redefine audio convenience. Smart living integration includes the smart thermostat, elevating the modern home setup. The industry's focus on engaging audio and engagiing video extends beyond homes, influencing theme parks and museum exhibits for interactive entertainment.

Regional Analysis

APAC is estimated to contribute 34% to the growth of the global market during the forecast period.Technavio's analysts have elaborately explained the regional trends and drivers that shape the market during the forecast period.

Home Entertainment Market Share by Geography

View Free PDF Sample

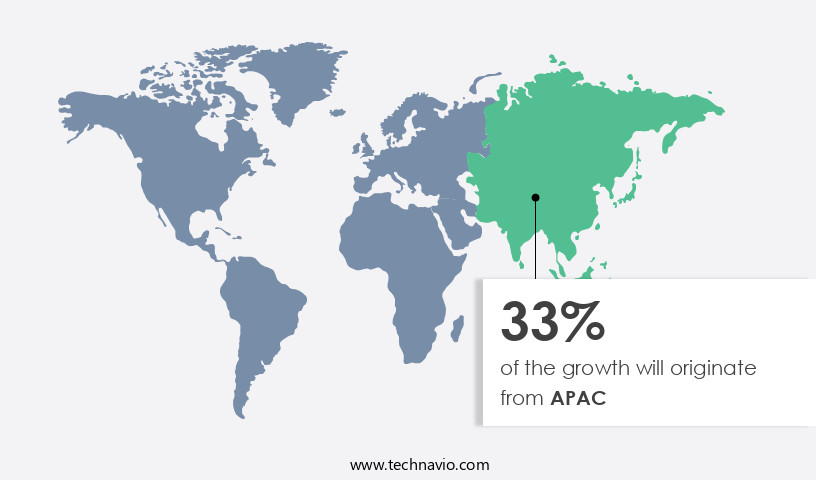
The market is experiencing significant growth in 2024, with APAC holding a dominant share. Factors driving this expansion include rising disposable income, increased Internet penetration in developing economies, and evolving consumer lifestyles leading to increased spending on home entertainment devices. The sports industry's growing interest is a major catalyst, as the region houses a vast and diverse audience for various sports such as football, cricket, and basketball. 

Smart TVs, commercial AV, smart thermostats, smart lighting, voice control, streaming services, DTS:X, home theater systems, interactive entertainment, digital signage, user experience, digital media, live events, smart home integration, multi-room audio, gaming consoles, home automation, satellite TV, content consumption, user interface, virtual reality, augmented reality, content delivery networks, ultra HD, remote control, and digital antennas are all shaping the future of home entertainment. The market's evolution is marked by advancements in technology, consumer preferences, and industry trends. These elements are redefining the home entertainment landscape and offering new opportunities for innovation and growth. One of the primary factors driving market expansion is the increase in disposable income, enabling consumers to invest in premium home entertainment systems.

Market Dynamics

Our researchers analyzed the data with 2024 as the base year, along with the key drivers, trends, and challenges. A holistic analysis of drivers will help companies refine their marketing strategies to gain a competitive advantage.

What are the Home Entertainment market drivers leading to the rise in the adoption of Industry?

  • The emergence of smart televisions serves as the primary catalyst for market growth, revolutionizing home entertainment with their advanced features and connectivity capabilities. The market is experiencing significant growth, driven by the increasing popularity of advanced television technologies. Smart televisions, in particular, have gained substantial traction due to their integrated Internet connectivity and interactive features. In 2023, smart televisions accounted for over half of all television sales. These televisions offer high-definition viewing experiences, with many models featuring 4K resolution and high dynamic range for enhanced visual quality. The integration of voice control, smart thermostats, and smart lighting further enhances the convenience and functionality of smart televisions.
  • The availability of streaming services like Amazon Prime Video and video games adds to their appeal. The market is expected to continue growing during the forecast period, as consumers seek to enhance their at-home entertainment experiences. The introduction of new technologies, such as 8K resolution and advanced audio systems, will further fuel market growth. Overall, the market is poised for continued expansion, as consumers increasingly prioritize comfort and convenience in their leisure activities. Home theaters increasingly offer access to video streaming platforms, such as Netflix and Disney Plus, and audio content in various formats.

What are the Home Entertainment market trends shaping the Industry?

  • Advanced technologies are increasingly being integrated into Over-The-Top (OTT) services, marking a significant market trend. This technological evolution enhances user experience and offers innovative features to subscribers. The market is experiencing significant growth due to the integration of advanced technologies, including AI (artificial intelligence) and ML (machine learning), into streaming services. These technologies enable personalized content recommendations and targeted advertising, enhancing the user experience. Digital signage is becoming increasingly popular for advertising and promotional purposes. Moreover, the convergence of home entertainment with live events and gaming consoles is driving market growth. Smart home integration and multi-room audio systems are gaining traction, allowing users to control their entertainment systems with voice commands or mobile apps.
  • Home automation is another area of focus, with companies integrating entertainment systems with other smart home devices. The market is witnessing a paradigm shift, with advanced technologies and innovative features becoming the norm. AI and ML are transforming the way we consume digital media, making entertainment more personalized and engaging. The integration of home entertainment with other smart home devices and live events is creating new opportunities for market growth. Devices such as Bluetooth and Wi-Fi connectivity-enabled soundbars, component systems, wireless subwoofers, and projector screens are popular choices.

How does Home Entertainment market face challenges during its growth?

  • The high energy consumption of televisions poses a significant challenge to the industry's growth trajectory. This issue, which is of great concern to both manufacturers and consumers, necessitates the development and implementation of energy-efficient technologies to mitigate its impact on the industry. The market is experiencing significant advancements, driven by the adoption of technologies such as satellite TV, virtual reality (VR), and augmented reality (AR). User interface innovations continue to enhance content consumption, with remote controls now offering voice commands and touchscreens. However, energy consumption is a challenge in the market. UHD televisions, with their high-pixel resolution, consume more power than standard HD models. The backlights used in UHD televisions require increased brightness to produce clear, vibrant pictures, leading to higher energy usage.
  • Additionally, the processing power required to display videos with high-dynamic-range (HDR) encoding further contributes to energy consumption. Content providers are investing in these technologies to create engaging, interactive experiences for users. The market is expected to continue growing, driven by these advancements and the increasing demand for high-quality entertainment at home. User interfaces are becoming more intuitive, with voice commands and touchscreens simplifying the process of accessing content. Content delivery networks ensure that users have access to high-definition content without interruption. Smart TVs and flat-screen TVs are popular video sources, and Echo and Chromecast enable wireless connectivity for easy use

Exclusive Customer Landscape

The home entertainment market forecasting report includes the adoption lifecycle of the market, covering from the innovator's stage to the laggard's stage. It focuses on adoption rates in different regions based on penetration. Furthermore, the home entertainment market report also includes key purchase criteria and drivers of price sensitivity to help companies evaluate and develop their market growth analysis strategies.
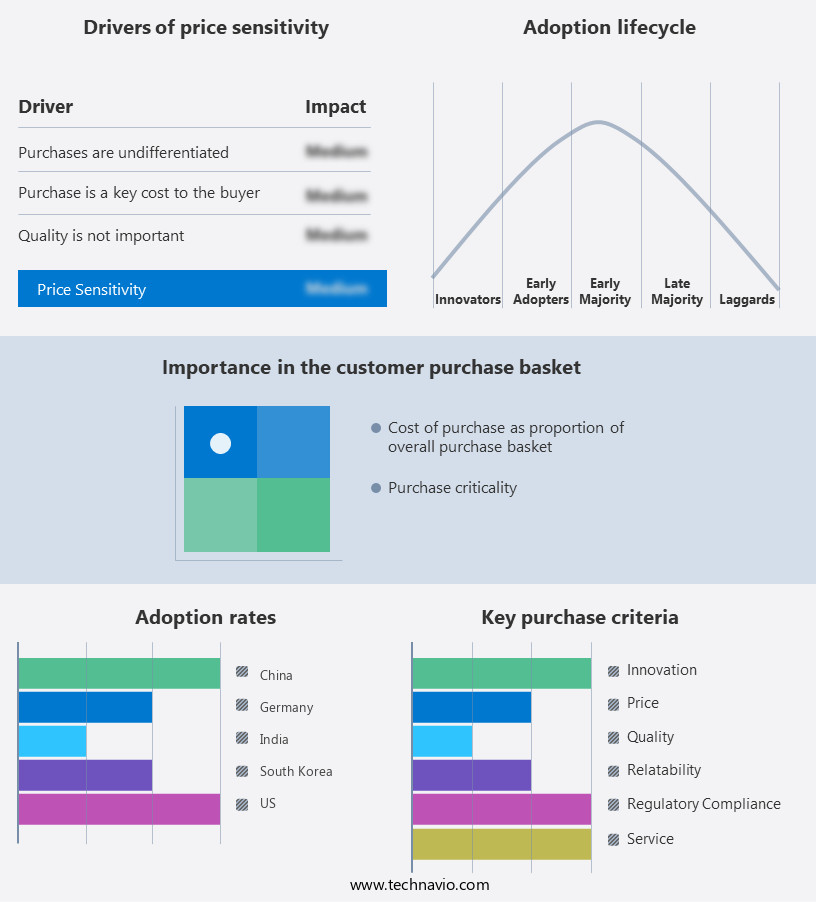
Home Entertainment Market Share by Geography

 Customer Landscape

Key Companies & Market Insights

Companies are implementing various strategies, such as strategic alliances, home entertainment market forecast, partnerships, mergers and acquisitions, geographical expansion, and product/service launches, to enhance their presence in the industry.

Apple Inc. - This company specializes in innovative home entertainment solutions. 

The industry research and growth report includes detailed analyses of the competitive landscape of the market and information about key companies, including:

  • Apple Inc.
  • Bose Corp.
  • Haier Smart Home Co. Ltd.
  • Hitachi Ltd.
  • Koninklijke Philips NV
  • LG Electronics Inc.
  • Microsoft Corp.
  • Mitsubishi Electric Corp.
  • Panasonic Holdings Corp.
  • Pioneer Corp.
  • Samsung Electronics Co. Ltd.
  • Sennheiser Electronic GmbH and Co. KG
  • Sharp Corp.
  • Sonos Inc.
  • Sony Group Corp.
  • TCL Industries Holdings Co. Ltd.
  • Toshiba Corp.
  • VIZIO Holding Corp.
  • Xiaomi Inc.
  • Yamaha Corp.

Qualitative and quantitative analysis of companies has been conducted to help clients understand the wider business environment as well as the strengths and weaknesses of key industry players. Data is qualitatively analyzed to categorize companies as pure play, category-focused, industry-focused, and diversified; it is quantitatively analyzed to categorize companies as dominant, leading, strong, tentative, and weak.

Recent Development and News in Home Entertainment Market

  • In February 2024, Disney+ announced the launch of its ad-supported subscription tier, aiming to broaden its customer base and compete more effectively with Netflix and other streaming services (Disney Press Release). This strategic move represented a significant shift in the market, as major streaming platforms began to introduce more affordable, ad-supported options to attract price-sensitive consumers.
  • In May 2024, Amazon Prime Video and MGM Studios signed a landmark deal, with Amazon acquiring MGM for approximately USD8.45 billion (Bloomberg). This merger marked a major strategic collaboration, as Amazon aimed to bolster its content library and strengthen its position in the competitive streaming market.
  • In August 2024, Apple TV+ unveiled a new feature, "Share Play," which allows users to watch shows and movies together with friends and family in real-time, even if they're not in the same location (Apple Press Release). This technological advancement demonstrated Apple's commitment to enhancing the user experience and differentiating its streaming service from competitors.

Research Analyst Overview

The market continues to evolve, with new technologies and applications shaping the landscape. Streaming services have become a dominant force, offering on-demand access to a vast library of movies and TV shows. Interactive entertainment, such as virtual and augmented reality, adds a new dimension to content consumption. Digital signage and user experience are essential components of modern entertainment, providing dynamic and engaging displays for commercial AV and public spaces.

Home automation, including smart security, thermostats, and lighting, adds a layer of convenience and control.  Gaming consoles and multi-room audio systems cater to the growing demand for interactive and shared entertainment experiences. Content management systems and delivery networks ensure seamless access to digital media, while 4K resolution and HDR offer improved visual quality. Voice control and remote control add to the user-friendly interface, making entertainment more accessible than ever before. The market's continuous dynamism ensures that innovation remains at the forefront of the entertainment experience.

Despite these advancements, energy consumption remains a concern. UHD televisions, with their high-pixel resolution, consume more power than standard HD models. The backlights used in UHD televisions require increased brightness to produce clear, vibrant pictures, leading to higher energy usage. Additionally, the processing power required to display videos with high-dynamic-range (HDR) encoding further contributes to energy consumption. The market is witnessing significant advancements, driven by technologies such as satellite TV, virtual reality, augmented reality, and ultra-high-definition content.

User interfaces are becoming more intuitive, and content delivery networks ensure seamless access to high-definition content. However, energy consumption remains a challenge, with UHD televisions requiring more power to produce clear, vibrant pictures. The market is expected to continue growing, driven by these advancements and the increasing demand for high-quality entertainment at home.

Dive into Technavio's robust research methodology, blending expert interviews, extensive data synthesis, and validated models for unparalleled Home Entertainment Market insights. See full methodology.

Market Scope

Report Coverage

Details

Page number

206

Base year

2024

Historic period

2019-2023

Forecast period

2025-2029

Growth momentum & CAGR

Accelerate at a CAGR of 8.3%

Market growth 2025-2029

USD 138 billion

Market structure

Fragmented

YoY growth 2024-2025(%)

7.5

Key countries

US, China, Japan, Brazil, Germany, South Korea, UK, India, France, and Canada

Competitive landscape

Leading Companies, Market Positioning of Companies, Competitive Strategies, and Industry Risks

Request Free Sample

What are the Key Data Covered in this Home Entertainment Market Research and Growth Report?

  • CAGR of the Home Entertainment industry during the forecast period
  • Detailed information on factors that will drive the growth and forecasting between 2025 and 2029
  • Precise estimation of the size of the market and its contribution of the industry in focus to the parent market
  • Accurate predictions about upcoming growth and trends and changes in consumer behaviour
  • Growth of the market across APAC, North America, Europe, South America, and Middle East and Africa
  • Thorough analysis of the market's competitive landscape and detailed information about companies
  • Comprehensive analysis of factors that will challenge the home entertainment market growth of industry companies

We can help! Our analysts can customize this home entertainment market research report to meet your requirements.

Get in touch

1 Executive Summary

  • 1.1 Market overview
    • Executive Summary - Chart on Market Overview
    • Executive Summary - Data Table on Market Overview
    • Executive Summary - Chart on Global Market Characteristics
    • Executive Summary - Chart on Market by Geography
    • Executive Summary - Chart on Market Segmentation by Product
    • Executive Summary - Chart on Market Segmentation by Distribution Channel
    • Executive Summary - Chart on Market Segmentation by Application
    • Executive Summary - Chart on Incremental Growth
    • Executive Summary - Data Table on Incremental Growth
    • Executive Summary - Chart on Company Market Positioning

2 Technavio Analysis

  • 2.1 Analysis of price sensitivity, lifecycle, customer purchase basket, adoption rates, and purchase criteria
    • Analysis of price sensitivity, lifecycle, customer purchase basket, adoption rates, and purchase criteria
  • 2.2 Criticality of inputs and Factors of differentiation
    • Overview on criticality of inputs and factors of differentiation
  • 2.3 Factors of disruption
    • Overview on factors of disruption
  • 2.4 Impact of drivers and challenges
    • Impact of drivers and challenges in 2024 and 2029

3 Market Landscape

  • 3.1 Market ecosystem
    • Parent Market
    • Data Table on - Parent Market
  • 3.2 Market characteristics
    • Market characteristics analysis
  • 3.3 Value chain analysis
    • Value chain analysis

4 Market Sizing

  • 4.1 Market definition
    • Offerings of companies included in the market definition
  • 4.2 Market segment analysis
    • Market segments
  • 4.3 Market size 2024
    • 4.4 Market outlook: Forecast for 2024-2029
      • Chart on Global - Market size and forecast 2024-2029 ($ billion)
      • Data Table on Global - Market size and forecast 2024-2029 ($ billion)
      • Chart on Global Market: Year-over-year growth 2024-2029 (%)
      • Data Table on Global Market: Year-over-year growth 2024-2029 (%)

    5 Historic Market Size

    • 5.1 Global Home Entertainment Market 2019 - 2023
      • Historic Market Size - Data Table on Global Home Entertainment Market 2019 - 2023 ($ billion)
    • 5.2 Product segment analysis 2019 - 2023
      • Historic Market Size - Product Segment 2019 - 2023 ($ billion)
    • 5.3 Distribution Channel segment analysis 2019 - 2023
      • Historic Market Size - Distribution Channel Segment 2019 - 2023 ($ billion)
    • 5.4 Application segment analysis 2019 - 2023
      • Historic Market Size - Application Segment 2019 - 2023 ($ billion)
    • 5.5 Geography segment analysis 2019 - 2023
      • Historic Market Size - Geography Segment 2019 - 2023 ($ billion)
    • 5.6 Country segment analysis 2019 - 2023
      • Historic Market Size - Country Segment 2019 - 2023 ($ billion)

    6 Qualitative Analysis

    • 6.1 Impact of AI on global home entertainment market

      7 Five Forces Analysis

      • 7.1 Five forces summary
        • Five forces analysis - Comparison between 2024 and 2029
      • 7.2 Bargaining power of buyers
        • Bargaining power of buyers - Impact of key factors 2024 and 2029
      • 7.3 Bargaining power of suppliers
        • Bargaining power of suppliers - Impact of key factors in 2024 and 2029
      • 7.4 Threat of new entrants
        • Threat of new entrants - Impact of key factors in 2024 and 2029
      • 7.5 Threat of substitutes
        • Threat of substitutes - Impact of key factors in 2024 and 2029
      • 7.6 Threat of rivalry
        • Threat of rivalry - Impact of key factors in 2024 and 2029
      • 7.7 Market condition
        • Chart on Market condition - Five forces 2024 and 2029

      8 Market Segmentation by Product

      • 8.1 Market segments
        • Chart on Product - Market share 2024-2029 (%)
        • Data Table on Product - Market share 2024-2029 (%)
      • 8.2 Comparison by Product
        • Chart on Comparison by Product
        • Data Table on Comparison by Product
      • 8.3 Video device - Market size and forecast 2024-2029
        • Chart on Video device - Market size and forecast 2024-2029 ($ billion)
        • Data Table on Video device - Market size and forecast 2024-2029 ($ billion)
        • Chart on Video device - Year-over-year growth 2024-2029 (%)
        • Data Table on Video device - Year-over-year growth 2024-2029 (%)
      • 8.4 Audio device - Market size and forecast 2024-2029
        • Chart on Audio device - Market size and forecast 2024-2029 ($ billion)
        • Data Table on Audio device - Market size and forecast 2024-2029 ($ billion)
        • Chart on Audio device - Year-over-year growth 2024-2029 (%)
        • Data Table on Audio device - Year-over-year growth 2024-2029 (%)
      • 8.5 Gaming console - Market size and forecast 2024-2029
        • Chart on Gaming console - Market size and forecast 2024-2029 ($ billion)
        • Data Table on Gaming console - Market size and forecast 2024-2029 ($ billion)
        • Chart on Gaming console - Year-over-year growth 2024-2029 (%)
        • Data Table on Gaming console - Year-over-year growth 2024-2029 (%)
      • 8.6 Market opportunity by Product
        • Market opportunity by Product ($ billion)
        • Data Table on Market opportunity by Product ($ billion)

      9 Market Segmentation by Distribution Channel

      • 9.1 Market segments
        • Chart on Distribution Channel - Market share 2024-2029 (%)
        • Data Table on Distribution Channel - Market share 2024-2029 (%)
      • 9.2 Comparison by Distribution Channel
        • Chart on Comparison by Distribution Channel
        • Data Table on Comparison by Distribution Channel
      • 9.3 Offline - Market size and forecast 2024-2029
        • Chart on Offline - Market size and forecast 2024-2029 ($ billion)
        • Data Table on Offline - Market size and forecast 2024-2029 ($ billion)
        • Chart on Offline - Year-over-year growth 2024-2029 (%)
        • Data Table on Offline - Year-over-year growth 2024-2029 (%)
      • 9.4 Online - Market size and forecast 2024-2029
        • Chart on Online - Market size and forecast 2024-2029 ($ billion)
        • Data Table on Online - Market size and forecast 2024-2029 ($ billion)
        • Chart on Online - Year-over-year growth 2024-2029 (%)
        • Data Table on Online - Year-over-year growth 2024-2029 (%)
      • 9.5 Market opportunity by Distribution Channel
        • Market opportunity by Distribution Channel ($ billion)
        • Data Table on Market opportunity by Distribution Channel ($ billion)

      10 Market Segmentation by Application

      • 10.1 Market segments
        • Chart on Application - Market share 2024-2029 (%)
        • Data Table on Application - Market share 2024-2029 (%)
      • 10.2 Comparison by Application
        • Chart on Comparison by Application
        • Data Table on Comparison by Application
      • 10.3 Residential - Market size and forecast 2024-2029
        • Chart on Residential - Market size and forecast 2024-2029 ($ billion)
        • Data Table on Residential - Market size and forecast 2024-2029 ($ billion)
        • Chart on Residential - Year-over-year growth 2024-2029 (%)
        • Data Table on Residential - Year-over-year growth 2024-2029 (%)
      • 10.4 Commercial - Market size and forecast 2024-2029
        • Chart on Commercial - Market size and forecast 2024-2029 ($ billion)
        • Data Table on Commercial - Market size and forecast 2024-2029 ($ billion)
        • Chart on Commercial - Year-over-year growth 2024-2029 (%)
        • Data Table on Commercial - Year-over-year growth 2024-2029 (%)
      • 10.5 Market opportunity by Application
        • Market opportunity by Application ($ billion)
        • Data Table on Market opportunity by Application ($ billion)

      11 Customer Landscape

      • 11.1 Customer landscape overview
        • Analysis of price sensitivity, lifecycle, customer purchase basket, adoption rates, and purchase criteria

      12 Geographic Landscape

      • 12.1 Geographic segmentation
        • Chart on Market share by geography 2024-2029 (%)
        • Data Table on Market share by geography 2024-2029 (%)
      • 12.2 Geographic comparison
        • Chart on Geographic comparison
        • Data Table on Geographic comparison
      • 12.3 APAC - Market size and forecast 2024-2029
        • Chart on APAC - Market size and forecast 2024-2029 ($ billion)
        • Data Table on APAC - Market size and forecast 2024-2029 ($ billion)
        • Chart on APAC - Year-over-year growth 2024-2029 (%)
        • Data Table on APAC - Year-over-year growth 2024-2029 (%)
      • 12.4 North America - Market size and forecast 2024-2029
        • Chart on North America - Market size and forecast 2024-2029 ($ billion)
        • Data Table on North America - Market size and forecast 2024-2029 ($ billion)
        • Chart on North America - Year-over-year growth 2024-2029 (%)
        • Data Table on North America - Year-over-year growth 2024-2029 (%)
      • 12.5 Europe - Market size and forecast 2024-2029
        • Chart on Europe - Market size and forecast 2024-2029 ($ billion)
        • Data Table on Europe - Market size and forecast 2024-2029 ($ billion)
        • Chart on Europe - Year-over-year growth 2024-2029 (%)
        • Data Table on Europe - Year-over-year growth 2024-2029 (%)
      • 12.6 South America - Market size and forecast 2024-2029
        • Chart on South America - Market size and forecast 2024-2029 ($ billion)
        • Data Table on South America - Market size and forecast 2024-2029 ($ billion)
        • Chart on South America - Year-over-year growth 2024-2029 (%)
        • Data Table on South America - Year-over-year growth 2024-2029 (%)
      • 12.7 Middle East and Africa - Market size and forecast 2024-2029
        • Chart on Middle East and Africa - Market size and forecast 2024-2029 ($ billion)
        • Data Table on Middle East and Africa - Market size and forecast 2024-2029 ($ billion)
        • Chart on Middle East and Africa - Year-over-year growth 2024-2029 (%)
        • Data Table on Middle East and Africa - Year-over-year growth 2024-2029 (%)
      • 12.8 US - Market size and forecast 2024-2029
        • Chart on US - Market size and forecast 2024-2029 ($ billion)
        • Data Table on US - Market size and forecast 2024-2029 ($ billion)
        • Chart on US - Year-over-year growth 2024-2029 (%)
        • Data Table on US - Year-over-year growth 2024-2029 (%)
      • 12.9 China - Market size and forecast 2024-2029
        • Chart on China - Market size and forecast 2024-2029 ($ billion)
        • Data Table on China - Market size and forecast 2024-2029 ($ billion)
        • Chart on China - Year-over-year growth 2024-2029 (%)
        • Data Table on China - Year-over-year growth 2024-2029 (%)
      • 12.10 Japan - Market size and forecast 2024-2029
        • Chart on Japan - Market size and forecast 2024-2029 ($ billion)
        • Data Table on Japan - Market size and forecast 2024-2029 ($ billion)
        • Chart on Japan - Year-over-year growth 2024-2029 (%)
        • Data Table on Japan - Year-over-year growth 2024-2029 (%)
      • 12.11 Brazil - Market size and forecast 2024-2029
        • Chart on Brazil - Market size and forecast 2024-2029 ($ billion)
        • Data Table on Brazil - Market size and forecast 2024-2029 ($ billion)
        • Chart on Brazil - Year-over-year growth 2024-2029 (%)
        • Data Table on Brazil - Year-over-year growth 2024-2029 (%)
      • 12.12 Germany - Market size and forecast 2024-2029
        • Chart on Germany - Market size and forecast 2024-2029 ($ billion)
        • Data Table on Germany - Market size and forecast 2024-2029 ($ billion)
        • Chart on Germany - Year-over-year growth 2024-2029 (%)
        • Data Table on Germany - Year-over-year growth 2024-2029 (%)
      • 12.13 South Korea - Market size and forecast 2024-2029
        • Chart on South Korea - Market size and forecast 2024-2029 ($ billion)
        • Data Table on South Korea - Market size and forecast 2024-2029 ($ billion)
        • Chart on South Korea - Year-over-year growth 2024-2029 (%)
        • Data Table on South Korea - Year-over-year growth 2024-2029 (%)
      • 12.14 UK - Market size and forecast 2024-2029
        • Chart on UK - Market size and forecast 2024-2029 ($ billion)
        • Data Table on UK - Market size and forecast 2024-2029 ($ billion)
        • Chart on UK - Year-over-year growth 2024-2029 (%)
        • Data Table on UK - Year-over-year growth 2024-2029 (%)
      • 12.15 India - Market size and forecast 2024-2029
        • Chart on India - Market size and forecast 2024-2029 ($ billion)
        • Data Table on India - Market size and forecast 2024-2029 ($ billion)
        • Chart on India - Year-over-year growth 2024-2029 (%)
        • Data Table on India - Year-over-year growth 2024-2029 (%)
      • 12.16 France - Market size and forecast 2024-2029
        • Chart on France - Market size and forecast 2024-2029 ($ billion)
        • Data Table on France - Market size and forecast 2024-2029 ($ billion)
        • Chart on France - Year-over-year growth 2024-2029 (%)
        • Data Table on France - Year-over-year growth 2024-2029 (%)
      • 12.17 Canada - Market size and forecast 2024-2029
        • Chart on Canada - Market size and forecast 2024-2029 ($ billion)
        • Data Table on Canada - Market size and forecast 2024-2029 ($ billion)
        • Chart on Canada - Year-over-year growth 2024-2029 (%)
        • Data Table on Canada - Year-over-year growth 2024-2029 (%)
      • 12.18 Market opportunity by geography
        • Market opportunity by geography ($ billion)
        • Data Tables on Market opportunity by geography ($ billion)

      13 Drivers, Challenges, and Opportunity/Restraints

      • 13.1 Market drivers
        • 13.2 Market challenges
          • 13.3 Impact of drivers and challenges
            • Impact of drivers and challenges in 2024 and 2029
          • 13.4 Market opportunities/restraints

            14 Competitive Landscape

            • 14.1 Overview
              • 14.2 Competitive Landscape
                • Overview on criticality of inputs and factors of differentiation
              • 14.3 Landscape disruption
                • Overview on factors of disruption
              • 14.4 Industry risks
                • Impact of key risks on business

              15 Competitive Analysis

              • 15.1 Companies profiled
                • Companies covered
              • 15.2 Company ranking index
                • Company ranking index
              • 15.3 Market positioning of companies
                • Matrix on companies position and classification
              • 15.4 Apple Inc.
                • Apple Inc. - Overview
                • Apple Inc. - Business segments
                • Apple Inc. - Key news
                • Apple Inc. - Key offerings
                • Apple Inc. - Segment focus
                • SWOT
              • 15.5 Bose Corp.
                • Bose Corp. - Overview
                • Bose Corp. - Product / Service
                • Bose Corp. - Key news
                • Bose Corp. - Key offerings
                • SWOT
              • 15.6 Haier Smart Home Co. Ltd.
                • Haier Smart Home Co. Ltd. - Overview
                • Haier Smart Home Co. Ltd. - Business segments
                • Haier Smart Home Co. Ltd. - Key offerings
                • Haier Smart Home Co. Ltd. - Segment focus
                • SWOT
              • 15.7 Koninklijke Philips NV
                • Koninklijke Philips NV - Overview
                • Koninklijke Philips NV - Business segments
                • Koninklijke Philips NV - Key news
                • Koninklijke Philips NV - Key offerings
                • Koninklijke Philips NV - Segment focus
                • SWOT
              • 15.8 LG Electronics Inc.
                • LG Electronics Inc. - Overview
                • LG Electronics Inc. - Product / Service
                • LG Electronics Inc. - Key offerings
                • SWOT
              • 15.9 Microsoft Corp.
                • Microsoft Corp. - Overview
                • Microsoft Corp. - Business segments
                • Microsoft Corp. - Key news
                • Microsoft Corp. - Key offerings
                • Microsoft Corp. - Segment focus
                • SWOT
              • 15.10 Panasonic Holdings Corp.
                • Panasonic Holdings Corp. - Overview
                • Panasonic Holdings Corp. - Business segments
                • Panasonic Holdings Corp. - Key news
                • Panasonic Holdings Corp. - Key offerings
                • Panasonic Holdings Corp. - Segment focus
                • SWOT
              • 15.11 Pioneer Corp.
                • Pioneer Corp. - Overview
                • Pioneer Corp. - Product / Service
                • Pioneer Corp. - Key offerings
                • SWOT
              • 15.12 Samsung Electronics Co. Ltd.
                • Samsung Electronics Co. Ltd. - Overview
                • Samsung Electronics Co. Ltd. - Business segments
                • Samsung Electronics Co. Ltd. - Key news
                • Samsung Electronics Co. Ltd. - Key offerings
                • Samsung Electronics Co. Ltd. - Segment focus
                • SWOT
              • 15.13 Sennheiser Electronic GmbH and Co. KG
                • Sennheiser Electronic GmbH and Co. KG - Overview
                • Sennheiser Electronic GmbH and Co. KG - Product / Service
                • Sennheiser Electronic GmbH and Co. KG - Key news
                • Sennheiser Electronic GmbH and Co. KG - Key offerings
                • SWOT
              • 15.14 Sonos Inc.
                • Sonos Inc. - Overview
                • Sonos Inc. - Product / Service
                • Sonos Inc. - Key news
                • Sonos Inc. - Key offerings
                • SWOT
              • 15.15 Sony Group Corp.
                • Sony Group Corp. - Overview
                • Sony Group Corp. - Business segments
                • Sony Group Corp. - Key offerings
                • Sony Group Corp. - Segment focus
                • SWOT
              • 15.16 VIZIO Holding Corp.
                • VIZIO Holding Corp. - Overview
                • VIZIO Holding Corp. - Business segments
                • VIZIO Holding Corp. - Key offerings
                • VIZIO Holding Corp. - Segment focus
                • SWOT
              • 15.17 Xiaomi Inc.
                • Xiaomi Inc. - Overview
                • Xiaomi Inc. - Business segments
                • Xiaomi Inc. - Key news
                • Xiaomi Inc. - Key offerings
                • Xiaomi Inc. - Segment focus
                • SWOT
              • 15.18 Yamaha Corp.
                • Yamaha Corp. - Overview
                • Yamaha Corp. - Business segments
                • Yamaha Corp. - Key news
                • Yamaha Corp. - Key offerings
                • Yamaha Corp. - Segment focus
                • SWOT

              16 Appendix

              • 16.1 Scope of the report
                • 16.2 Inclusions and exclusions checklist
                  • Inclusions checklist
                  • Exclusions checklist
                • 16.3 Currency conversion rates for US$
                  • Currency conversion rates for US$
                • 16.4 Research methodology
                  • Research methodology
                • 16.5 Data procurement
                  • Information sources
                • 16.6 Data validation
                  • Data validation
                • 16.7 Validation techniques employed for market sizing
                  • Validation techniques employed for market sizing
                • 16.8 Data synthesis
                  • Data synthesis
                • 16.9 360 degree market analysis
                  • 360 degree market analysis
                • 16.10 List of abbreviations
                  • List of abbreviations

                Research Methodology

                Technavio presents a detailed picture of the market by way of study, synthesis, and summation of data from multiple sources. The analysts have presented the various facets of the market with a particular focus on identifying the key industry influencers. The data thus presented is comprehensive, reliable, and the result of extensive research, both primary and secondary.

                INFORMATION SOURCES

                Primary sources

                • Manufacturers and suppliers
                • Channel partners
                • Industry experts
                • Strategic decision makers

                Secondary sources

                • Industry journals and periodicals
                • Government data
                • Financial reports of key industry players
                • Historical data
                • Press releases

                DATA ANALYSIS

                Data Synthesis

                • Collation of data
                • Estimation of key figures
                • Analysis of derived insights

                Data Validation

                • Triangulation with data models
                • Reference against proprietary databases
                • Corroboration with industry experts

                REPORT WRITING

                Qualitative

                • Market drivers
                • Market challenges
                • Market trends
                • Five forces analysis

                Quantitative

                • Market size and forecast
                • Market segmentation
                • Geographical insights
                • Competitive landscape

                Interested in this report?

                Get your sample now to see our research methodology and insights!

                Download Now

                Frequently Asked Questions

                Home Entertainment market growth will increase by $ 138 bn during 2025-2029 .

                The Home Entertainment market is expected to grow at a CAGR of 8.3% during 2025-2029 .

                Home Entertainment market is segmented by Product( Video device, Audio device, Gaming console) Distribution Channel( Offline, Online) Application( Residential, Commercial, Europe, South America, Middle East and Africa)

                Apple Inc., Bose Corp., Haier Smart Home Co. Ltd., Hitachi Ltd., Koninklijke Philips NV, LG Electronics Inc., Microsoft Corp., Mitsubishi Electric Corp., Panasonic Holdings Corp., Pioneer Corp., Samsung Electronics Co. Ltd., Sennheiser Electronic GmbH and Co. KG, Sharp Corp., Sonos Inc., Sony Group Corp., TCL Industries Holdings Co. Ltd., Toshiba Corp., VIZIO Holding Corp., Xiaomi Inc., Yamaha Corp. are a few of the key vendors in the Home Entertainment market.

                APAC will register the highest growth rate of 34% among the other regions. Therefore, the Home Entertainment market in APAC is expected to garner significant business opportunities for the vendors during the forecast period.

                US, China, Japan, Brazil, Germany, South Korea, UK, India, France, Canada

                • Emergence of smart televisionsThe smart television is a flat-screen television is the driving factor this market.
                • which is equipped with built-in operating systems and integrated Internet connectivity. It is also known as hybrid televisions or connected televisions and consists of integrated Internet and interactive Web 2.0 features. The demand for smart televisions has been witnessing an increase over the last few years is the driving factor this market.
                • and the same trend is expected to continue during the forecast period. The recently introduced smart televisions feature 4K resolution. The increased demand for such smart televisions will positively impact the growth of the global home entertainment market during the forecast period. Smart televisions constituted more than half of the television sales in 2023. Smart functions are increasingly considered essential is the driving factor this market.
                • which has resulted in the shift of consumers preferences to a self-sustaining demand for built-in Internet streaming capabilities. Factors such as increased Internet accessibility is the driving factor this market.
                • reduced product costs is the driving factor this market.
                • advancements in technology is the driving factor this market.
                • and digital revolution in broadcasting will surge the demand for smart televisions during the forecast period. Therefore is the driving factor this market.
                • the emergence of smart televisions and the increased demand from consumers will propel the growth of the global home entertainment market during the forecast period. is the driving factor this market.

                The Home Entertainment market vendors should focus on grabbing business opportunities from the Video device segment as it accounted for the largest market share in the base year.