Retail Digital Signage Market Analysis, Size, and Forecast 2026-2030: North America (US, Canada, and Mexico), APAC (China, India, and Japan), Europe (UK, Germany, and France), Middle East and Africa (Saudi Arabia, UAE, and South Africa), South America (Brazil, Argentina, and Colombia), and Rest of World (ROW)

Retail Digital Signage Market Analysis, Size, and Forecast 2026-2030:
North America (US, Canada, and Mexico), APAC (China, India, and Japan), Europe (UK, Germany, and France), Middle East and Africa (Saudi Arabia, UAE, and South Africa), South America (Brazil, Argentina, and Colombia), and Rest of World (ROW)

Published: Apr 2026 316 Pages SKU: IRTNTR81398

Market Overview at a Glance

$2.39 B
Market Opportunity
6.5%
CAGR 2025 - 2030
36.2%
North America Growth
$3.64 B
Hardware segment 2024

Retail Digital Signage Market Size 2026-2030

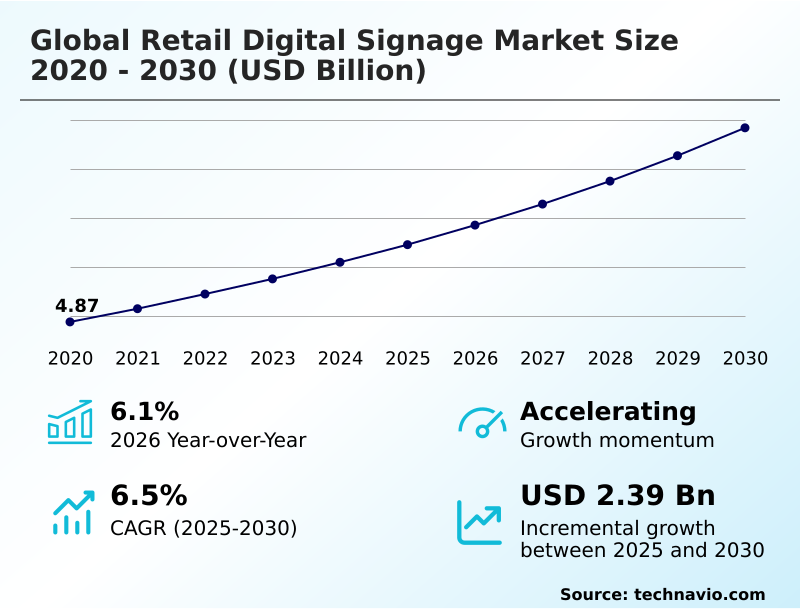
The retail digital signage market size is valued to increase by USD 2.39 billion, at a CAGR of 6.5% from 2025 to 2030. Advancement of omnichannel strategy through phygital integration will drive the retail digital signage market.

Major Market Trends & Insights

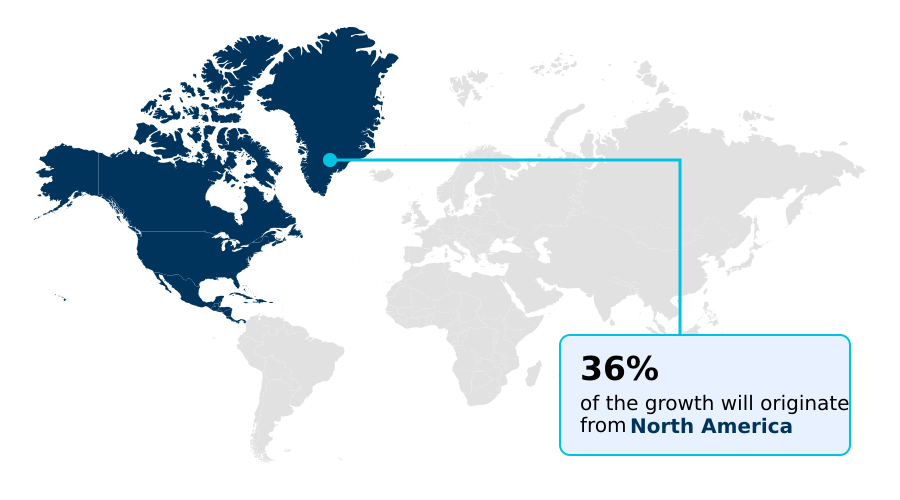
  • North America dominated the market and accounted for a 36.2% growth during the forecast period.
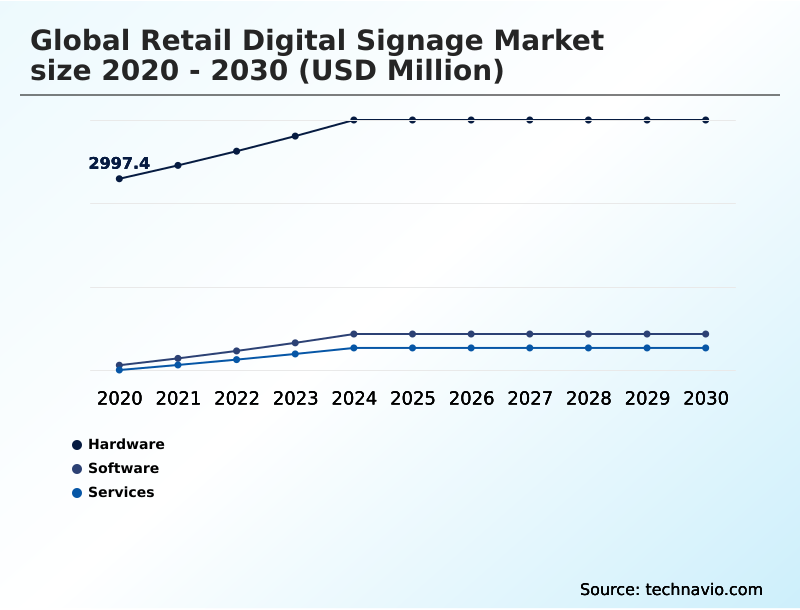
  • By Component - Hardware segment was valued at USD 3.64 billion in 2024
  • By Product Type - Standalone displays segment accounted for the largest market revenue share in 2024

Market Size & Forecast

  • Market Opportunities: USD 3.98 billion
  • Market Future Opportunities: USD 2.39 billion
  • CAGR from 2025 to 2030 : 6.5%

Market Summary

  • The Retail Digital Signage Market is undergoing a significant transformation, moving beyond simple electronic displays to become a cornerstone of modern phygital retail. This evolution is driven by the need to create immersive brand experiences and bridge the gap between digital and physical commerce.
  • Key technologies such as AI and computer vision are integrated into interactive kiosks and displays, enabling retailers to gather real-time analytics on consumer behavior for hyper-personalization of content.
  • For instance, a fashion retailer can use augmented reality mirrors for virtual try-on services, enhancing the in-store experience while collecting data on popular items, which can optimize inventory management by up to 20%. However, the high initial cost of ultra-high-definition displays and the complexities of data privacy regulations present significant challenges.
  • The successful implementation of centralized content management systems is crucial for deploying cohesive omnichannel strategies, ensuring brand consistency and operational efficiency across all customer touchpoints, from wayfinding to checkout. This dynamic landscape demands a strategic balance between technological innovation and sustainable business practices.

What will be the Size of the Retail Digital Signage Market during the forecast period?

Get Key Insights on Market Forecast (PDF) Request Free Sample

How is the Retail Digital Signage Market Segmented?

The retail digital signage industry research report provides comprehensive data (region-wise segment analysis), with forecasts and estimates in "USD million" for the period 2026-2030, as well as historical data from 2020-2024 for the following segments.

  • Component
    • Hardware
    • Software
    • Services
  • Product type
    • Standalone displays
    • Video walls
    • Digital menu boards
    • Interactive kiosks
    • Others
  • End-user
    • Hypermarkets and supermarkets
    • Specialty stores
    • Department stores
    • Others
  • Geography
    • North America
      • US
      • Canada
      • Mexico
    • APAC
      • China
      • India
      • Japan
    • Europe
      • UK
      • Germany
      • France
    • Middle East and Africa
      • Saudi Arabia
      • UAE
      • South Africa
    • South America
      • Brazil
      • Argentina
      • Colombia
    • Rest of World (ROW)

By Component Insights

The hardware segment is estimated to witness significant growth during the forecast period.

The hardware segment, including ultra-high-definition displays and media players, forms the physical backbone of retail visual communication. Development focuses on visual fidelity and durability, with micro-LED technology enabling seamless, customizable video walls. This technology is critical for omnichannel integration.

The segment also encompasses infrastructure like mounting solutions and connectivity for operational stability. Systems utilizing proximity detection and ambient light sensors can optimize performance and reduce energy consumption by up to 15%.

Innovations like transparent screens, which blend physical products with digital information, are creating layered sensory experiences, moving beyond passive display to active engagement points.

These advancements in e-paper displays and holographic displays redefine the in-store experience, supporting sophisticated phygital retail experience initiatives.

Request Free Sample

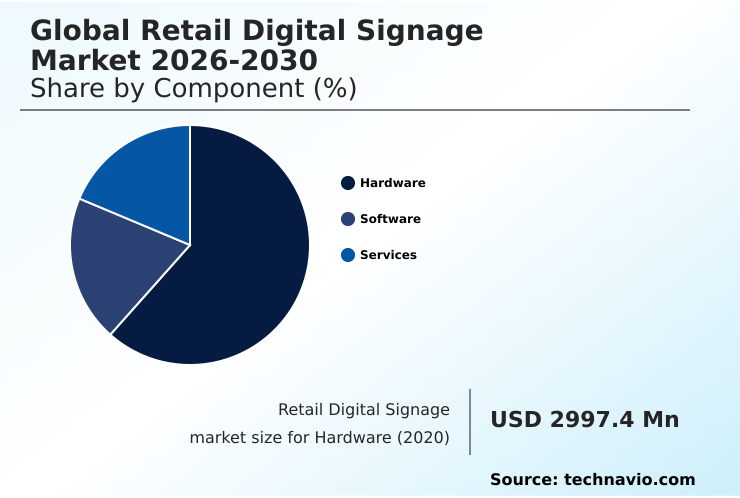
The Hardware segment was valued at USD 3.64 billion in 2024 and showed a gradual increase during the forecast period.

Request Free Sample

Regional Analysis

North America is estimated to contribute 36.2% to the growth of the global market during the forecast period.Technavio’s analysts have elaborately explained the regional trends and drivers that shape the market during the forecast period.

See How Retail Digital Signage Market Demand is Rising in North America Request Free Sample

North America leads the retail digital signage market, accounting for 36.2% of the incremental growth, driven by mature infrastructure and high adoption of programmatic advertising and sophisticated IoT ecosystems.

APAC follows closely, representing 32.34% of the opportunity, with rapid urbanization and a focus on experiential retail utilizing 3D anamorphic displays.

Europe, contributing 22.62%, is heavily influenced by stringent regulations, prioritizing sustainable and privacy-compliant solutions like e-paper displays and cloud-based architectures. A key driver in this region is the need for omnichannel strategy.

The Middle East and Africa and South America show steady growth, focusing on modernizing retail formats and implementing foundational technologies like quick response codes for omnichannel integration.

Market Dynamics

Our researchers analyzed the data with 2025 as the base year, along with the key drivers, trends, and challenges. A holistic analysis of drivers will help companies refine their marketing strategies to gain a competitive advantage.

  • Navigating the future of retail requires a deep understanding of the strategic implications behind emerging display technologies. A core consideration is the impact of AI on retail digital signage personalization, which moves beyond generic advertising to deliver tailored content that can significantly lift conversion rates.
  • Concurrently, businesses must perform a rigorous cost-benefit analysis of electronic shelf labels vs paper, weighing the upfront investment against long-term operational savings and dynamic pricing capabilities, which can outperform static models by a significant margin. Success also hinges on optimizing retail store layout with digital wayfinding, as effective navigation reduces shopper friction and increases time spent in high-margin areas.
  • Furthermore, integrating digital signage with point-of-sale systems is no longer optional; it is essential for real-time inventory accuracy and a seamless omnichannel experience. Finally, addressing the privacy challenges of computer vision in retail analytics is paramount.
  • Retailers must adopt privacy-by-design principles to build consumer trust, as failure to do so can undermine the entire data-driven strategy and lead to regulatory penalties. These elements collectively shape a complex but opportunity-rich environment for forward-thinking retailers.

What are the key market drivers leading to the rise in the adoption of Retail Digital Signage Industry?

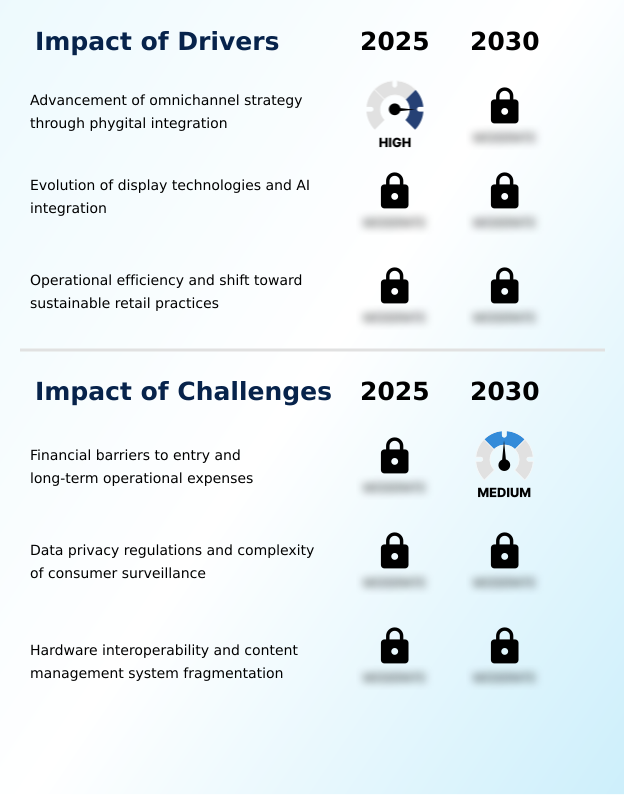
  • The advancement of omnichannel strategies through phygital integration, which synchronizes the physical and digital consumer journey, is a key market driver.

  • The need for a seamless phygital retail experience is a primary driver, with retailers using centralized content management systems to synchronize online and in-store promotions. This omnichannel approach is critical for brand consistency.
  • The evolution of display technologies, including high-efficiency transparent OLED panels and advanced gesture control, enhances visual quality and interactivity. AI integration transforms passive signs into intelligent agents for targeted content.
  • Furthermore, the push for operational efficiency and sustainability makes digital shelf-edge labels a logical solution, reducing paper waste and enabling dynamic pricing that can boost margin control by 2-4%.
  • The phygital experience relies on these advanced media players and IoT ecosystems.

What are the market trends shaping the Retail Digital Signage Industry?

  • The proliferation of artificial intelligence and real-time consumer analytics is a primary market trend, driving the shift from static advertising to dynamic, data-responsive content.

  • The global retail digital signage market is increasingly defined by the integration of artificial intelligence and real-time data processing. This trend is particularly dominant in North America and APAC, where technologies like computer vision and machine learning transform displays into intelligent observers.
  • Such systems facilitate hyper-personalization by adjusting content based on viewer demographics, with early adopters reporting engagement increases of over 25%. Sustainability is also a key focus, with new hardware like transparent OLED panels designed for lower energy use, reducing operational costs by up to 80% in some cases through the adoption of technologies like contactless interaction technologies and facial recognition.

What challenges does the Retail Digital Signage Industry face during its growth?

  • Significant financial barriers to entry and high long-term operational expenses present a key challenge impacting broader industry adoption and growth.

  • Substantial initial investment for ultra-high-definition displays and interactive kiosks remains a primary hurdle. Ongoing operational expenses, including software licensing and energy consumption, further compound the financial burden. Data privacy regulations, such as GDPR, create complexity for systems using biometric-enabled advertising and require significant investment in compliant edge computing solutions to anonymize data.
  • A German pilot program was suspended due to insufficient consent methods, highlighting the difficulty in balancing personalization with privacy. Hardware interoperability and fragmented content management systems also create significant technical challenges, increasing long-term operational costs and hindering seamless integration with existing retail systems like POS databases, a core component of phygital.

Exclusive Technavio Analysis on Customer Landscape

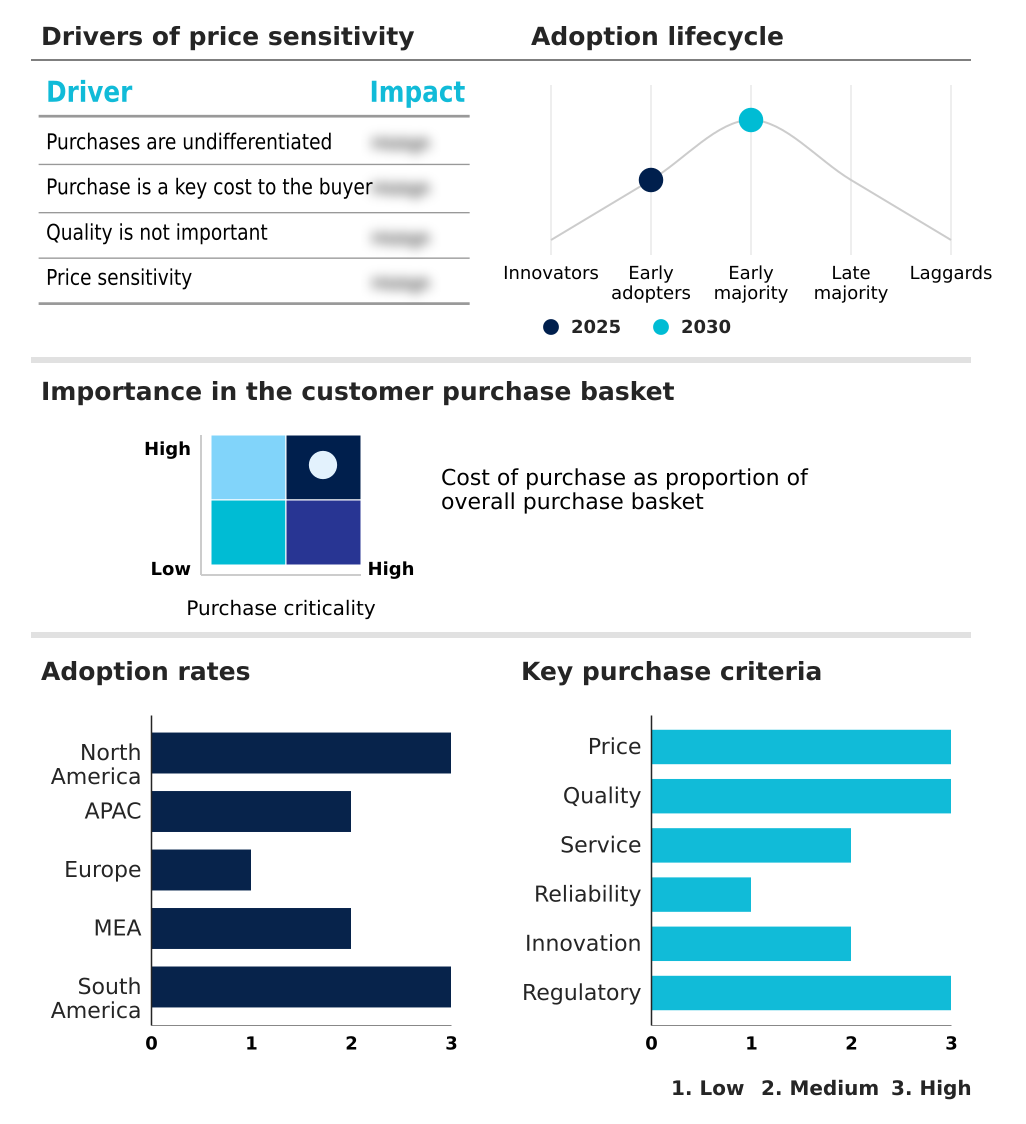
The retail digital signage market forecasting report includes the adoption lifecycle of the market, covering from the innovator’s stage to the laggard’s stage. It focuses on adoption rates in different regions based on penetration. Furthermore, the retail digital signage market report also includes key purchase criteria and drivers of price sensitivity to help companies evaluate and develop their market growth analysis strategies.

Customer Landscape of Retail Digital Signage Industry

Competitive Landscape

Companies are implementing various strategies, such as strategic alliances, retail digital signage market forecast, partnerships, mergers and acquisitions, geographical expansion, and product/service launches, to enhance their presence in the industry.

Acer Inc. - Provides a portfolio of professional displays including large-format, 4K, and interactive video walls designed for retail visualization.

The industry research and growth report includes detailed analyses of the competitive landscape of the market and information about key companies, including:

  • Acer Inc.
  • ASUSTeK Computer Inc.
  • AUO Corp.
  • Barco NV
  • Christie Digital Systems Inc.
  • Dell Technologies Inc.
  • Elo Touch Solutions Inc.
  • HP Inc.
  • Koninklijke Philips NV
  • Leyard International.
  • LG Electronics Inc.
  • Mitsubishi Electric Corp.
  • NEC Corp.
  • Panasonic Holdings Corp.
  • Planar Systems Inc.
  • Samsung Electronics Co. Ltd.
  • Sharp Corp.
  • Sony Group Corp.
  • Toshiba Corp.
  • ViewSonic Corp.

Qualitative and quantitative analysis of companies has been conducted to help clients understand the wider business environment as well as the strengths and weaknesses of key industry players. Data is qualitatively analyzed to categorize companies as pure play, category-focused, industry-focused, and diversified; it is quantitatively analyzed to categorize companies as dominant, leading, strong, tentative, and weak.

Recent Development and News in Retail digital signage market

  • In August 2025, a prominent North American department store chain deployed a system that synchronized mobile shopping carts with in-store interactive kiosks across its flagship locations.
  • In May 2025, a leading global technology firm headquartered in Seoul launched a suite of signage solutions that utilized edge computing to analyze customer demographics without storing personal information.
  • In March 2025, Target Corporation implemented a comprehensive network of AI-powered interactive kiosks across three hundred US locations to provide personalized product recommendations.
  • In November 2025, Adidas introduced a proprietary Scan-and-Sync interactive display system in its flagship stores in London and Paris, allowing shoppers to synchronize mobile profiles with large-format wall displays.

Dive into Technavio’s robust research methodology, blending expert interviews, extensive data synthesis, and validated models for unparalleled Retail Digital Signage Market insights. See full methodology.

Market Scope
Page number 316
Base year 2025
Historic period 2020-2024
Forecast period 2026-2030
Growth momentum & CAGR Accelerate at a CAGR of 6.5%
Market growth 2026-2030 USD 2392.1 million
Market structure Fragmented
YoY growth 2025-2026(%) 6.1%
Key countries US, Canada, Mexico, China, India, Japan, South Korea, Australia, Indonesia, UK, Germany, France, Italy, Spain, The Netherlands, Saudi Arabia, UAE, South Africa, Israel, Turkey, Brazil, Argentina and Colombia
Competitive landscape Leading Companies, Market Positioning of Companies, Competitive Strategies, and Industry Risks

Request Free Sample

Research Analyst Overview

  • The retail digital signage market is defined by its role as the central nervous system for the modern phygital retail experience. Its continuous evolution is marked by the convergence of advanced hardware and intelligent software. The adoption of micro-LED technology and transparent OLED panels, managed through centralized content management systems, allows for unprecedented visual storytelling.
  • Core to this is omnichannel integration, ensuring a seamless customer journey. Boardroom decisions are increasingly influenced by the need to balance innovation with regulatory compliance; for example, the use of facial recognition for hyper-personalization must navigate stringent data privacy laws, impacting technology budgets and vendor selection.
  • Systems leveraging edge computing to process analytics locally can reduce data transmission costs by over 40% while enhancing security. This ecosystem, which includes interactive kiosks, programmatic advertising, and digital shelf-edge labels, is no longer a peripheral marketing tool but a critical operational asset driving both sales and efficiency through contactless interaction technologies, augmented reality mirrors, and e-paper displays.

What are the Key Data Covered in this Retail Digital Signage Market Research and Growth Report?

  • What is the expected growth of the Retail Digital Signage Market between 2026 and 2030?

    • USD 2.39 billion, at a CAGR of 6.5%

  • What segmentation does the market report cover?

    • The report is segmented by Component (Hardware, Software, and Services), Product Type (Standalone displays, Video walls, Digital menu boards, Interactive kiosks, and Others), End-user (Hypermarkets and supermarkets, Specialty stores, Department stores, and Others) and Geography (North America, APAC, Europe, Middle East and Africa, South America)

  • Which regions are analyzed in the report?

    • North America, APAC, Europe, Middle East and Africa and South America

  • What are the key growth drivers and market challenges?

    • Advancement of omnichannel strategy through phygital integration, Financial barriers to entry and long-term operational expenses

  • Who are the major players in the Retail Digital Signage Market?

    • Acer Inc., ASUSTeK Computer Inc., AUO Corp., Barco NV, Christie Digital Systems Inc., Dell Technologies Inc., Elo Touch Solutions Inc., HP Inc., Koninklijke Philips NV, Leyard International., LG Electronics Inc., Mitsubishi Electric Corp., NEC Corp., Panasonic Holdings Corp., Planar Systems Inc., Samsung Electronics Co. Ltd., Sharp Corp., Sony Group Corp., Toshiba Corp. and ViewSonic Corp.

Market Research Insights

  • The retail digital signage market is shaped by the pursuit of operational efficiency and enhanced customer engagement. Retailers are adopting dynamic pricing strategies, which can adjust in real-time, improving pricing accuracy by over 99% compared to manual methods. The implementation of predictive maintenance protocols on display networks reduces hardware downtime by as much as 30%, safeguarding brand image.
  • The shift to software-as-a-service models lowers initial capital expenditure, making advanced content management accessible to more businesses. This phygital retail approach, which includes endless aisle browsing and gamified shopping experiences, is critical for creating a compelling in-store experience.

We can help! Our analysts can customize this retail digital signage market research report to meet your requirements.

Get in touch

1. Executive Summary

1.1 Market overview

Executive Summary - Chart on Market Overview
Executive Summary - Data Table on Market Overview
Executive Summary - Chart on Global Market Characteristics
Executive Summary - Chart on Market by Geography
Executive Summary - Chart on Market Segmentation by Component
Executive Summary - Chart on Market Segmentation by Product Type
Executive Summary - Chart on Market Segmentation by End-user
Executive Summary - Chart on Incremental Growth
Executive Summary - Data Table on Incremental Growth
Executive Summary - Chart on Company Market Positioning

2. Technavio Analysis

2.1 Analysis of price sensitivity, lifecycle, customer purchase basket, adoption rates, and purchase criteria

2.2 Criticality of inputs and Factors of differentiation

Chart on Overview on criticality of inputs and factors of differentiation

2.3 Factors of disruption

Chart on Overview on factors of disruption

2.4 Impact of drivers and challenges

Chart on Impact of drivers and challenges in 2025 and 2030

3. Market Landscape

3.1 Market ecosystem

Chart on Parent Market
Data Table on - Parent Market

3.2 Market characteristics

Chart on Market characteristics analysis

3.3 Value chain analysis

Chart on Value chain analysis

4. Market Sizing

4.1 Market definition

Data Table on Offerings of companies included in the market definition

4.2 Market segment analysis

Market segments

4.3 Market size 2025

4.4 Market outlook: Forecast for 2025-2030

Chart on Global - Market size and forecast 2025-2030 ($ million)
Data Table on Global - Market size and forecast 2025-2030 ($ million)
Chart on Global Market: Year-over-year growth 2025-2030 (%)
Data Table on Global Market: Year-over-year growth 2025-2030 (%)

5. Historic Market Size

5.1 Global Retail Digital Signage Market 2020 - 2024

Historic Market Size - Data Table on Global Retail Digital Signage Market 2020 - 2024 ($ million)

5.2 Component segment analysis 2020 - 2024

Historic Market Size - Component Segment 2020 - 2024 ($ million)

5.3 Product Type segment analysis 2020 - 2024

Historic Market Size - Product Type Segment 2020 - 2024 ($ million)

5.4 End-user segment analysis 2020 - 2024

Historic Market Size - End-user Segment 2020 - 2024 ($ million)

5.5 Geography segment analysis 2020 - 2024

Historic Market Size - Geography Segment 2020 - 2024 ($ million)

5.6 Country segment analysis 2020 - 2024

Historic Market Size - Country Segment 2020 - 2024 ($ million)

6. Qualitative Analysis

6.1 The AI impact on Global Retail Digital Signage Market

6.2 Impact of geopolitical conflicts on Global Retail Digital Signage Market

7. Five Forces Analysis

7.1 Five forces summary

Five forces analysis - Comparison between 2025 and 2030

7.2 Bargaining power of buyers

Bargaining power of buyers - Impact of key factors 2025 and 2030

7.3 Bargaining power of suppliers

Bargaining power of suppliers - Impact of key factors in 2025 and 2030

7.4 Threat of new entrants

Threat of new entrants - Impact of key factors in 2025 and 2030

7.5 Threat of substitutes

Threat of substitutes - Impact of key factors in 2025 and 2030

7.6 Threat of rivalry

Threat of rivalry - Impact of key factors in 2025 and 2030

7.7 Market condition

Chart on Market condition - Five forces 2025 and 2030

8. Market Segmentation by Component

8.1 Market segments

Chart on Component - Market share 2025-2030 (%)
Data Table on Component - Market share 2025-2030 (%)

8.2 Comparison by Component

Chart on Comparison by Component
Data Table on Comparison by Component

8.3 Hardware - Market size and forecast 2025-2030

Chart on Hardware - Market size and forecast 2025-2030 ($ million)
Data Table on Hardware - Market size and forecast 2025-2030 ($ million)
Chart on Hardware - Year-over-year growth 2025-2030 (%)
Data Table on Hardware - Year-over-year growth 2025-2030 (%)

8.4 Software - Market size and forecast 2025-2030

Chart on Software - Market size and forecast 2025-2030 ($ million)
Data Table on Software - Market size and forecast 2025-2030 ($ million)
Chart on Software - Year-over-year growth 2025-2030 (%)
Data Table on Software - Year-over-year growth 2025-2030 (%)

8.5 Services - Market size and forecast 2025-2030

Chart on Services - Market size and forecast 2025-2030 ($ million)
Data Table on Services - Market size and forecast 2025-2030 ($ million)
Chart on Services - Year-over-year growth 2025-2030 (%)
Data Table on Services - Year-over-year growth 2025-2030 (%)

8.6 Market opportunity by Component

Market opportunity by Component ($ million)
Data Table on Market opportunity by Component ($ million)

9. Market Segmentation by Product Type

9.1 Market segments

Chart on Product Type - Market share 2025-2030 (%)
Data Table on Product Type - Market share 2025-2030 (%)

9.2 Comparison by Product Type

Chart on Comparison by Product Type
Data Table on Comparison by Product Type

9.3 Standalone displays - Market size and forecast 2025-2030

Chart on Standalone displays - Market size and forecast 2025-2030 ($ million)
Data Table on Standalone displays - Market size and forecast 2025-2030 ($ million)
Chart on Standalone displays - Year-over-year growth 2025-2030 (%)
Data Table on Standalone displays - Year-over-year growth 2025-2030 (%)

9.4 Video walls - Market size and forecast 2025-2030

Chart on Video walls - Market size and forecast 2025-2030 ($ million)
Data Table on Video walls - Market size and forecast 2025-2030 ($ million)
Chart on Video walls - Year-over-year growth 2025-2030 (%)
Data Table on Video walls - Year-over-year growth 2025-2030 (%)

9.5 Digital menu boards - Market size and forecast 2025-2030

Chart on Digital menu boards - Market size and forecast 2025-2030 ($ million)
Data Table on Digital menu boards - Market size and forecast 2025-2030 ($ million)
Chart on Digital menu boards - Year-over-year growth 2025-2030 (%)
Data Table on Digital menu boards - Year-over-year growth 2025-2030 (%)

9.6 Interactive kiosks - Market size and forecast 2025-2030

Chart on Interactive kiosks - Market size and forecast 2025-2030 ($ million)
Data Table on Interactive kiosks - Market size and forecast 2025-2030 ($ million)
Chart on Interactive kiosks - Year-over-year growth 2025-2030 (%)
Data Table on Interactive kiosks - Year-over-year growth 2025-2030 (%)

9.7 Others - Market size and forecast 2025-2030

Chart on Others - Market size and forecast 2025-2030 ($ million)
Data Table on Others - Market size and forecast 2025-2030 ($ million)
Chart on Others - Year-over-year growth 2025-2030 (%)
Data Table on Others - Year-over-year growth 2025-2030 (%)

9.8 Market opportunity by Product Type

Market opportunity by Product Type ($ million)
Data Table on Market opportunity by Product Type ($ million)

10. Market Segmentation by End-user

10.1 Market segments

Chart on End-user - Market share 2025-2030 (%)
Data Table on End-user - Market share 2025-2030 (%)

10.2 Comparison by End-user

Chart on Comparison by End-user
Data Table on Comparison by End-user

10.3 Hypermarkets and supermarkets - Market size and forecast 2025-2030

Chart on Hypermarkets and supermarkets - Market size and forecast 2025-2030 ($ million)
Data Table on Hypermarkets and supermarkets - Market size and forecast 2025-2030 ($ million)
Chart on Hypermarkets and supermarkets - Year-over-year growth 2025-2030 (%)
Data Table on Hypermarkets and supermarkets - Year-over-year growth 2025-2030 (%)

10.4 Specialty stores - Market size and forecast 2025-2030

Chart on Specialty stores - Market size and forecast 2025-2030 ($ million)
Data Table on Specialty stores - Market size and forecast 2025-2030 ($ million)
Chart on Specialty stores - Year-over-year growth 2025-2030 (%)
Data Table on Specialty stores - Year-over-year growth 2025-2030 (%)

10.5 Department stores - Market size and forecast 2025-2030

Chart on Department stores - Market size and forecast 2025-2030 ($ million)
Data Table on Department stores - Market size and forecast 2025-2030 ($ million)
Chart on Department stores - Year-over-year growth 2025-2030 (%)
Data Table on Department stores - Year-over-year growth 2025-2030 (%)

10.6 Others - Market size and forecast 2025-2030

Chart on Others - Market size and forecast 2025-2030 ($ million)
Data Table on Others - Market size and forecast 2025-2030 ($ million)
Chart on Others - Year-over-year growth 2025-2030 (%)
Data Table on Others - Year-over-year growth 2025-2030 (%)

10.7 Market opportunity by End-user

Market opportunity by End-user ($ million)
Data Table on Market opportunity by End-user ($ million)

11. Customer Landscape

11.1 Customer landscape overview

Analysis of price sensitivity, lifecycle, customer purchase basket, adoption rates, and purchase criteria

12. Geographic Landscape

12.1 Geographic segmentation

Chart on Market share by geography 2025-2030 (%)
Data Table on Market share by geography 2025-2030 (%)

12.2 Geographic comparison

Chart on Geographic comparison
Data Table on Geographic comparison

12.3 North America - Market size and forecast 2025-2030

Chart on North America - Market size and forecast 2025-2030 ($ million)
Data Table on North America - Market size and forecast 2025-2030 ($ million)
Chart on North America - Year-over-year growth 2025-2030 (%)
Data Table on North America - Year-over-year growth 2025-2030 (%)
Chart on Regional Comparison - North America
Data Table on Regional Comparison - North America

12.3.1 US - Market size and forecast 2025-2030

Chart on US - Market size and forecast 2025-2030 ($ million)
Data Table on US - Market size and forecast 2025-2030 ($ million)
Chart on US - Year-over-year growth 2025-2030 (%)
Data Table on US - Year-over-year growth 2025-2030 (%)

12.3.2 Canada - Market size and forecast 2025-2030

Chart on Canada - Market size and forecast 2025-2030 ($ million)
Data Table on Canada - Market size and forecast 2025-2030 ($ million)
Chart on Canada - Year-over-year growth 2025-2030 (%)
Data Table on Canada - Year-over-year growth 2025-2030 (%)

12.3.3 Mexico - Market size and forecast 2025-2030

Chart on Mexico - Market size and forecast 2025-2030 ($ million)
Data Table on Mexico - Market size and forecast 2025-2030 ($ million)
Chart on Mexico - Year-over-year growth 2025-2030 (%)
Data Table on Mexico - Year-over-year growth 2025-2030 (%)

12.4 APAC - Market size and forecast 2025-2030

Chart on APAC - Market size and forecast 2025-2030 ($ million)
Data Table on APAC - Market size and forecast 2025-2030 ($ million)
Chart on APAC - Year-over-year growth 2025-2030 (%)
Data Table on APAC - Year-over-year growth 2025-2030 (%)
Chart on Regional Comparison - APAC
Data Table on Regional Comparison - APAC

12.4.1 China - Market size and forecast 2025-2030

Chart on China - Market size and forecast 2025-2030 ($ million)
Data Table on China - Market size and forecast 2025-2030 ($ million)
Chart on China - Year-over-year growth 2025-2030 (%)
Data Table on China - Year-over-year growth 2025-2030 (%)

12.4.2 India - Market size and forecast 2025-2030

Chart on India - Market size and forecast 2025-2030 ($ million)
Data Table on India - Market size and forecast 2025-2030 ($ million)
Chart on India - Year-over-year growth 2025-2030 (%)
Data Table on India - Year-over-year growth 2025-2030 (%)

12.4.3 Japan - Market size and forecast 2025-2030

Chart on Japan - Market size and forecast 2025-2030 ($ million)
Data Table on Japan - Market size and forecast 2025-2030 ($ million)
Chart on Japan - Year-over-year growth 2025-2030 (%)
Data Table on Japan - Year-over-year growth 2025-2030 (%)

12.4.4 South Korea - Market size and forecast 2025-2030

Chart on South Korea - Market size and forecast 2025-2030 ($ million)
Data Table on South Korea - Market size and forecast 2025-2030 ($ million)
Chart on South Korea - Year-over-year growth 2025-2030 (%)
Data Table on South Korea - Year-over-year growth 2025-2030 (%)

12.4.5 Australia - Market size and forecast 2025-2030

Chart on Australia - Market size and forecast 2025-2030 ($ million)
Data Table on Australia - Market size and forecast 2025-2030 ($ million)
Chart on Australia - Year-over-year growth 2025-2030 (%)
Data Table on Australia - Year-over-year growth 2025-2030 (%)

12.4.6 Indonesia - Market size and forecast 2025-2030

Chart on Indonesia - Market size and forecast 2025-2030 ($ million)
Data Table on Indonesia - Market size and forecast 2025-2030 ($ million)
Chart on Indonesia - Year-over-year growth 2025-2030 (%)
Data Table on Indonesia - Year-over-year growth 2025-2030 (%)

12.5 Europe - Market size and forecast 2025-2030

Chart on Europe - Market size and forecast 2025-2030 ($ million)
Data Table on Europe - Market size and forecast 2025-2030 ($ million)
Chart on Europe - Year-over-year growth 2025-2030 (%)
Data Table on Europe - Year-over-year growth 2025-2030 (%)
Chart on Regional Comparison - Europe
Data Table on Regional Comparison - Europe

12.5.1 UK - Market size and forecast 2025-2030

Chart on UK - Market size and forecast 2025-2030 ($ million)
Data Table on UK - Market size and forecast 2025-2030 ($ million)
Chart on UK - Year-over-year growth 2025-2030 (%)
Data Table on UK - Year-over-year growth 2025-2030 (%)

12.5.2 Germany - Market size and forecast 2025-2030

Chart on Germany - Market size and forecast 2025-2030 ($ million)
Data Table on Germany - Market size and forecast 2025-2030 ($ million)
Chart on Germany - Year-over-year growth 2025-2030 (%)
Data Table on Germany - Year-over-year growth 2025-2030 (%)

12.5.3 France - Market size and forecast 2025-2030

Chart on France - Market size and forecast 2025-2030 ($ million)
Data Table on France - Market size and forecast 2025-2030 ($ million)
Chart on France - Year-over-year growth 2025-2030 (%)
Data Table on France - Year-over-year growth 2025-2030 (%)

12.5.4 Italy - Market size and forecast 2025-2030

Chart on Italy - Market size and forecast 2025-2030 ($ million)
Data Table on Italy - Market size and forecast 2025-2030 ($ million)
Chart on Italy - Year-over-year growth 2025-2030 (%)
Data Table on Italy - Year-over-year growth 2025-2030 (%)

12.5.5 Spain - Market size and forecast 2025-2030

Chart on Spain - Market size and forecast 2025-2030 ($ million)
Data Table on Spain - Market size and forecast 2025-2030 ($ million)
Chart on Spain - Year-over-year growth 2025-2030 (%)
Data Table on Spain - Year-over-year growth 2025-2030 (%)

12.5.6 The Netherlands - Market size and forecast 2025-2030

Chart on The Netherlands - Market size and forecast 2025-2030 ($ million)
Data Table on The Netherlands - Market size and forecast 2025-2030 ($ million)
Chart on The Netherlands - Year-over-year growth 2025-2030 (%)
Data Table on The Netherlands - Year-over-year growth 2025-2030 (%)

12.6 Middle East and Africa - Market size and forecast 2025-2030

Chart on Middle East and Africa - Market size and forecast 2025-2030 ($ million)
Data Table on Middle East and Africa - Market size and forecast 2025-2030 ($ million)
Chart on Middle East and Africa - Year-over-year growth 2025-2030 (%)
Data Table on Middle East and Africa - Year-over-year growth 2025-2030 (%)
Chart on Regional Comparison - Middle East and Africa
Data Table on Regional Comparison - Middle East and Africa

12.6.1 Saudi Arabia - Market size and forecast 2025-2030

Chart on Saudi Arabia - Market size and forecast 2025-2030 ($ million)
Data Table on Saudi Arabia - Market size and forecast 2025-2030 ($ million)
Chart on Saudi Arabia - Year-over-year growth 2025-2030 (%)
Data Table on Saudi Arabia - Year-over-year growth 2025-2030 (%)

12.6.2 UAE - Market size and forecast 2025-2030

Chart on UAE - Market size and forecast 2025-2030 ($ million)
Data Table on UAE - Market size and forecast 2025-2030 ($ million)
Chart on UAE - Year-over-year growth 2025-2030 (%)
Data Table on UAE - Year-over-year growth 2025-2030 (%)

12.6.3 South Africa - Market size and forecast 2025-2030

Chart on South Africa - Market size and forecast 2025-2030 ($ million)
Data Table on South Africa - Market size and forecast 2025-2030 ($ million)
Chart on South Africa - Year-over-year growth 2025-2030 (%)
Data Table on South Africa - Year-over-year growth 2025-2030 (%)

12.6.4 Israel - Market size and forecast 2025-2030

Chart on Israel - Market size and forecast 2025-2030 ($ million)
Data Table on Israel - Market size and forecast 2025-2030 ($ million)
Chart on Israel - Year-over-year growth 2025-2030 (%)
Data Table on Israel - Year-over-year growth 2025-2030 (%)

12.6.5 Turkey - Market size and forecast 2025-2030

Chart on Turkey - Market size and forecast 2025-2030 ($ million)
Data Table on Turkey - Market size and forecast 2025-2030 ($ million)
Chart on Turkey - Year-over-year growth 2025-2030 (%)
Data Table on Turkey - Year-over-year growth 2025-2030 (%)

12.7 South America - Market size and forecast 2025-2030

Chart on South America - Market size and forecast 2025-2030 ($ million)
Data Table on South America - Market size and forecast 2025-2030 ($ million)
Chart on South America - Year-over-year growth 2025-2030 (%)
Data Table on South America - Year-over-year growth 2025-2030 (%)
Chart on Regional Comparison - South America
Data Table on Regional Comparison - South America

12.7.1 Brazil - Market size and forecast 2025-2030

Chart on Brazil - Market size and forecast 2025-2030 ($ million)
Data Table on Brazil - Market size and forecast 2025-2030 ($ million)
Chart on Brazil - Year-over-year growth 2025-2030 (%)
Data Table on Brazil - Year-over-year growth 2025-2030 (%)

12.7.2 Argentina - Market size and forecast 2025-2030

Chart on Argentina - Market size and forecast 2025-2030 ($ million)
Data Table on Argentina - Market size and forecast 2025-2030 ($ million)
Chart on Argentina - Year-over-year growth 2025-2030 (%)
Data Table on Argentina - Year-over-year growth 2025-2030 (%)

12.7.3 Colombia - Market size and forecast 2025-2030

Chart on Colombia - Market size and forecast 2025-2030 ($ million)
Data Table on Colombia - Market size and forecast 2025-2030 ($ million)
Chart on Colombia - Year-over-year growth 2025-2030 (%)
Data Table on Colombia - Year-over-year growth 2025-2030 (%)

12.8 Market opportunity by geography

Market opportunity by geography ($ million)
Data Tables on Market opportunity by geography ($ million)

13. Drivers, Challenges, and Opportunity

13.1 Market drivers

Advancement of omnichannel strategy through phygital integration
Evolution of display technologies and AI integration
Operational efficiency and shift toward sustainable retail practices

13.2 Market challenges

Financial barriers to entry and long-term operational expenses
Data privacy regulations and complexity of consumer surveillance
Hardware interoperability and content management system fragmentation

13.3 Impact of drivers and challenges

Impact of drivers and challenges in 2025 and 2030

13.4 Market opportunities

Proliferation of AI and real-time consumer analytics
Strategic shift toward sustainable infrastructure and energy-efficient hardware
Enhancement of omnichannel experience through interactive and contactless solutions

14. Competitive Landscape

14.1 Overview

14.2

Overview on criticality of inputs and factors of differentiation

14.3 Landscape disruption

Overview on factors of disruption

14.4 Industry risks

Impact of key risks on business

15. Competitive Analysis

15.1 Companies profiled

Companies covered

15.2 Company ranking index

15.3 Market positioning of companies

Matrix on companies position and classification

15.4 Acer Inc.

Acer Inc. - Overview
Acer Inc. - Business segments
Acer Inc. - Key news
Acer Inc. - Key offerings
Acer Inc. - Segment focus
SWOT

15.5 ASUSTeK Computer Inc.

ASUSTeK Computer Inc. - Overview
ASUSTeK Computer Inc. - Business segments
ASUSTeK Computer Inc. - Key offerings
ASUSTeK Computer Inc. - Segment focus
SWOT

15.6 AUO Corp.

AUO Corp. - Overview
AUO Corp. - Business segments
AUO Corp. - Key news
AUO Corp. - Key offerings
AUO Corp. - Segment focus
SWOT

15.7 Barco NV

Barco NV - Overview
Barco NV - Business segments
Barco NV - Key offerings
Barco NV - Segment focus
SWOT

15.8 Christie Digital Systems Inc.

Christie Digital Systems Inc. - Overview
Christie Digital Systems Inc. - Product / Service
Christie Digital Systems Inc. - Key offerings
SWOT

15.9 Dell Technologies Inc.

Dell Technologies Inc. - Overview
Dell Technologies Inc. - Business segments
Dell Technologies Inc. - Key news
Dell Technologies Inc. - Key offerings
Dell Technologies Inc. - Segment focus
SWOT

15.10 Elo Touch Solutions Inc.

Elo Touch Solutions Inc. - Overview
Elo Touch Solutions Inc. - Product / Service
Elo Touch Solutions Inc. - Key offerings
SWOT

15.11 HP Inc.

HP Inc. - Overview
HP Inc. - Business segments
HP Inc. - Key news
HP Inc. - Key offerings
HP Inc. - Segment focus
SWOT

15.12 Koninklijke Philips NV

Koninklijke Philips NV - Overview
Koninklijke Philips NV - Business segments
Koninklijke Philips NV - Key news
Koninklijke Philips NV - Key offerings
Koninklijke Philips NV - Segment focus
SWOT

15.13 Leyard International.

Leyard International. - Overview
Leyard International. - Product / Service
Leyard International. - Key offerings
SWOT

15.14 LG Electronics Inc.

LG Electronics Inc. - Overview
LG Electronics Inc. - Business segments
LG Electronics Inc. - Key offerings
LG Electronics Inc. - Segment focus
SWOT

15.15 Mitsubishi Electric Corp.

Mitsubishi Electric Corp. - Overview
Mitsubishi Electric Corp. - Business segments
Mitsubishi Electric Corp. - Key offerings
Mitsubishi Electric Corp. - Segment focus
SWOT

15.16 NEC Corp.

NEC Corp. - Overview
NEC Corp. - Business segments
NEC Corp. - Key offerings
NEC Corp. - Segment focus
SWOT

15.17 Panasonic Holdings Corp.

Panasonic Holdings Corp. - Overview
Panasonic Holdings Corp. - Business segments
Panasonic Holdings Corp. - Key news
Panasonic Holdings Corp. - Key offerings
Panasonic Holdings Corp. - Segment focus
SWOT

15.18 Planar Systems Inc.

Planar Systems Inc. - Overview
Planar Systems Inc. - Product / Service
Planar Systems Inc. - Key offerings
SWOT

16. Appendix

16.1 Scope of the report

Market definition
Objectives
Notes and caveats

16.2 Inclusions and exclusions checklist

Inclusions checklist
Exclusions checklist

16.3 Currency conversion rates for US$

16.4 Research methodology

16.5 Data procurement

Information sources

16.6 Data validation

16.7 Validation techniques employed for market sizing

16.8 Data synthesis

16.9 360 degree market analysis

16.10 List of abbreviations

Research Methodology

Technavio presents a detailed picture of the market by way of study, synthesis, and summation of data from multiple sources. The analysts have presented the various facets of the market with a particular focus on identifying the key industry influencers. The data thus presented is comprehensive, reliable, and the result of extensive research, both primary and secondary.

INFORMATION SOURCES

Primary sources

  • Manufacturers and suppliers
  • Channel partners
  • Industry experts
  • Strategic decision makers

Secondary sources

  • Industry journals and periodicals
  • Government data
  • Financial reports of key industry players
  • Historical data
  • Press releases

DATA ANALYSIS

Data Synthesis

  • Collation of data
  • Estimation of key figures
  • Analysis of derived insights

Data Validation

  • Triangulation with data models
  • Reference against proprietary databases
  • Corroboration with industry experts

REPORT WRITING

Qualitative

  • Market drivers
  • Market challenges
  • Market trends
  • Five forces analysis

Quantitative

  • Market size and forecast
  • Market segmentation
  • Geographical insights
  • Competitive landscape

Interested in this report?

Get your sample now to see our research methodology and insights!

Download Now

Frequently Asked Questions

Retail Digital Signage market growth will increase by USD 2392.1 million during 2026-2030.

The Retail Digital Signage market is expected to grow at a CAGR of 6.5% during 2026-2030.

Retail Digital Signage market is segmented by Component (Hardware, Software, Services) Product type (Standalone displays, Video walls, Digital menu boards, Interactive kiosks, Others) End-user (Hypermarkets and supermarkets, Specialty stores, Department stores, Others)

Acer Inc., ASUSTeK Computer Inc., AUO Corp., Barco NV, Christie Digital Systems Inc., Dell Technologies Inc., Elo Touch Solutions Inc., HP Inc., Koninklijke Philips NV, Leyard International., LG Electronics Inc., Mitsubishi Electric Corp., NEC Corp., Panasonic Holdings Corp., Planar Systems Inc., Samsung Electronics Co. Ltd., Sharp Corp., Sony Group Corp., Toshiba Corp., ViewSonic Corp. are a few of the key vendors in the Retail Digital Signage market.

North America will register the highest growth rate of 36.2% among the other regions. Therefore, the Retail Digital Signage market in North America is expected to garner significant business opportunities for the vendors during the forecast period.

US, Canada, Mexico, China, India, Japan, South Korea, Australia, Indonesia, UK, Germany, France, Italy, Spain, The Netherlands, Saudi Arabia, UAE, South Africa, Israel, Turkey, Brazil, Argentina, Colombia

  • Advancement of omnichannel strategy through phygital integration is the driving factor this market.

The Retail Digital Signage market vendors should focus on grabbing business opportunities from the Component segment as it accounted for the largest market share in the base year.
RIA - Research AI Assistant
Ask RIA