Reusable Water Bottle Market Analysis Report: By Distribution Channel, By Type By Region - Growth Trends & Forecasts 2024-2028

Reusable Water Bottle Market Analysis Report:
By Distribution Channel, By Type By Region - Growth Trends & Forecasts 2024-2028

Published: Jul 2024 155 Pages SKU: IRTNTR75297

Market Overview at a Glance

$2.18 B
Market Opportunity
4.6%
CAGR
4.18
YoY growth 2023-2024(%)

Reusable Water Bottle Market Size 2024-2028 

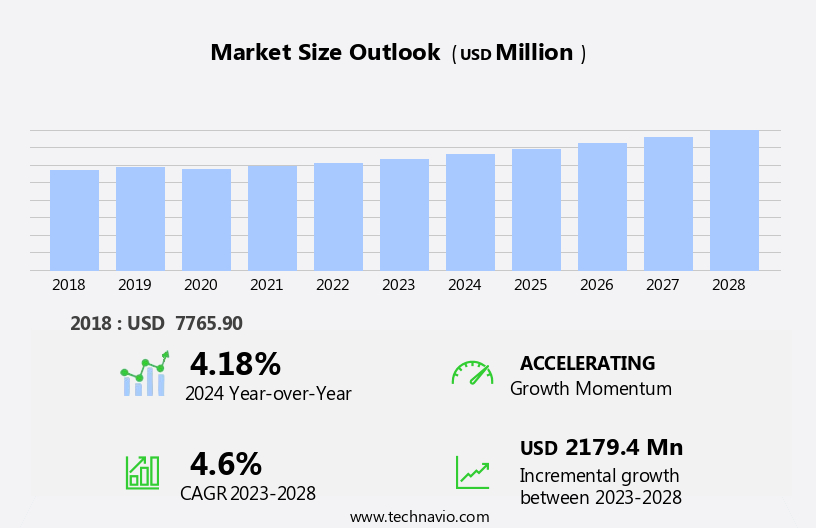
The reusable water bottle market size is forecast to increase by USD 2.18 billion at a CAGR of 4.6% between 2023 and 2028.

  • The Reusable Water Bottle Market is experiencing significant growth driven by a confluence of factors. The rising tide of environmental consciousness, fueled by the growing awareness of plastic pollution and the urgent need to reduce our reliance on single-use plastics, is a primary driver. This is further amplified by the growing health and wellness movement, with consumers increasingly prioritizing sustainable and healthy lifestyles.Government regulations and initiatives aimed at curbing plastic waste, such as bans on single-use plastic bags and bottles, are further incentivizing the adoption of reusable water bottles. Moreover, the COVID-19 pandemic accelerated the shift towards home-based lifestyles, leading to increased demand for home-based fitness activities and a renewed focus on personal health and well-being. This has significantly boosted the demand for reusable water bottles for home use and during outdoor activities.
  • Technological advancements are also playing a crucial role in driving market growth. Innovations in materials science have led to the development of durable, lightweight, and eco-friendly materials such as recycled stainless steel, BPA-free plastics, and biodegradable polymers. Furthermore, the integration of smart features like built-in filters, temperature sensors, and connectivity with fitness trackers is enhancing the user experience and creating new avenues for product differentiation.

What will be the Size of the Reusable Water Bottle Market During the Forecast Period?

Reusable Water Bottle Market Size

 Request Free Sample

  • The market is witnessing significant growth due to increasing environmental concerns and the negative impact of single-use plastic bottles on the environment. The market is driven by the rising awareness of healthier lifestyles and the desire to reduce plastic trash. Reusable water bottles are becoming essential for kitchen products and are popular among millennials and Generation X. The market for reusable water bottles includes various types such as glass and metal bottles. Glass water bottles are gaining popularity due to their eco-friendliness and ability to avoid the use of the chemical compound Bisphenol A (BPA). However, glass bottles have their challenges, including the risk of breaking and the presence of germs and contamination.
  • The rising tide of environmental consciousness, fueled by the growing awareness of plastic pollution and the urgent need to reduce our reliance on single-use plastics, is a primary driver. This is further amplified by the growing health and wellness movement, with consumers increasingly prioritizing sustainable lifestyles and seeking to reduce their environmental impact.The demand for eco-friendly water bottles is further fueled by government regulations and initiatives aimed at curbing plastic waste. Many regions are implementing bans on single-use plastic bags and bottles, encouraging the adoption of sustainable alternatives.

How is this Reusable Water Bottle Industry segmented and which is the largest segment?

The reusable water bottle industry research report provides comprehensive data (region-wise segment analysis), with forecasts and estimates in "USD million" for the period 2024-2028, as well as historical data from 2018-2022 for the following segments.

  • Distribution Channel
    • Offline
    • Online
  • Type
    • Plastic
    • Metal
    • Silicone
    • Glass
  • Geography
    • APAC
      • China
      • India
      • Japan
    • North America
      • US
      • Canada
    • Europe
      • Germany
      • France
      • Spain
    • South America
      • Brazil
    • Middle East and Africa
      • South Africa

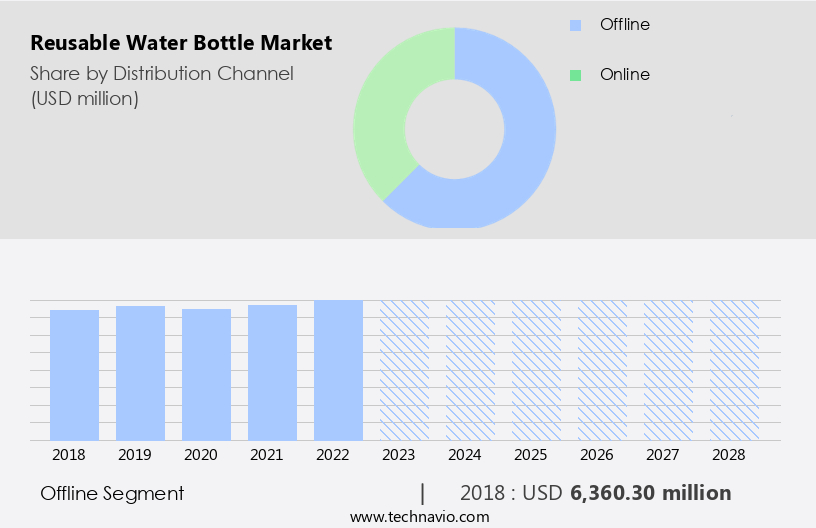
By Distribution Channel Insights

  • The offline segment is estimated to witness significant growth during the forecast period.

The market encompasses a range of products, including reusable water infusers, growlers, everyday water bottles, sports water bottles, and travel water bottles. These bottles are available in various materials such as silicon, stainless steel, glass, and plastic. Primary usage of reusable water bottles includes replacing single-use, non-disposable plastic bottles for environmental reasons and healthier lifestyles. Everyday water bottles are popular among offices and universities, while sports water bottles cater to fitness enthusiasts, and travel water bottles are essential for commuters. Offline distribution channels of reusable water bottles include independent stores and retailers, as well as online retailers. Physical retail businesses provide an opportunity for customers to see, touch, and feel the product before purchasing it.

The offline segment offers a diverse range of items, including bottles made of materials like stainless steel, glass, and silicon. Rising public awareness and consumer interest in reducing plastic bottle use due to environmental concerns and ecological problems have led to a rapidly expanding population of conscientious consumers. Reusable water bottles made of zero plastic materials like silicon and glass are gaining popularity. Rapid urbanization and the increasing adoption of a healthy lifestyle have also contributed to the market's growth. However, the use of substandard plastic materials in some reusable water bottles can lead to by-products like volatile organic compounds, phthalates, and harmful bacteria.

These toxins can pose health risks and contribute to plastic pollution. Therefore, consumers are increasingly seeking out high-quality, non-toxic, and eco-friendly options. Blogs and online platforms have become essential sources of information for consumers looking to make informed decisions about their reusable water bottle purchases. These platforms provide detailed reviews, comparisons, and recommendations based on various factors like material, price, and functionality. Overall, the market is poised for continued growth as consumers prioritize their health and the environment.

Reusable Water Bottle Market Size

Get a glance at the  Reusable Water Bottle Industry report of share of various segments Request Free Sample

The Offline segment was valued at USD 6.36 billion in 2018 and showed a gradual increase during the forecast period.
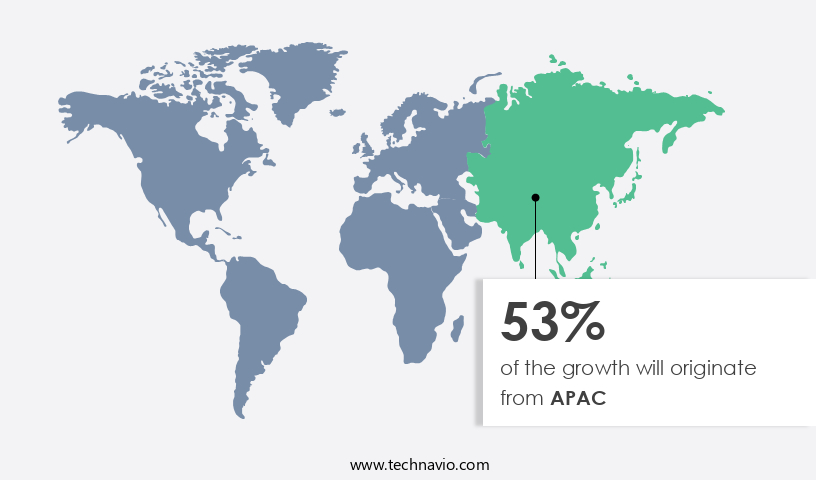
Regional Analysis

  • APAC is estimated to contribute 53% to the growth of the global market during the forecast period.

Technavio's analysts have elaborately explained the regional trends and drivers that shape the market during the forecast period.

Reusable Water Bottle Market Share by Geography

For more insights on the market share of various regions, Request Free Sample

The market is experiencing significant growth due to rising public awareness and consumer interest in reducing plastic use. Materials such as silicon, glass, and stainless steel are increasingly being used to manufacture reusable water bottles, as opposed to single-use, non-disposable plastic. Reusable water infusers and growlers are gaining popularity for their convenience and health benefits. Everyday water bottles, sports water bottles, and travel water bottles are all categories that are seeing a surge in demand. Independent stores and online retailers are capitalizing on this trend, offering a wide range of options to meet the diverse needs of consumers. The rapid expansion of the population and urbanization are driving the demand for reusable water bottles.

The ecological problems caused by plastic bottle use, including plastic waste, toxic by-products, and the presence of harmful bacteria, are major concerns. Conscientious consumers are turning to reusable bottles for both environmental and health reasons. Zero plastic is becoming a desirable attribute for many, and reusable water bottles offer a cost-effective and sustainable solution. The market is expected to continue expanding as more people adopt this healthy lifestyle choice, particularly in offices, universities, and other settings where access to clean drinking water is important.

Market Dynamics

Our reusable water bottle market researchers analyzed the data with 2023 as the base year, along with the key drivers, trends, and challenges. A holistic analysis of drivers will help companies refine their marketing strategies to gain a competitive advantage.Metal bottles, on the other hand, offer durability and resistance to breakage. Copper bottles are a new entrant In the market, known for their antimicrobial properties. Reusable water bottles with built-in mechanisms like filters are gaining popularity as they provide cleaner water and eliminate the risk of subsurface contamination. The market for reusable water bottles is expected to continue growing as more businesses adopt them in workplaces, offices, universities, and other institutions. Despite the benefits, challenges such as contaminants and germs in reusable bottles remain a concern and require continuous innovation to address. The market is expected to witness continued growth as more people adopt a healthier lifestyle and reduce their carbon footprint.The integration of smart features, such as built-in filters, temperature sensors, and connectivity with fitness trackers, is enhancing the user experience and creating new avenues for product differentiation.

What are the key market drivers leading to the rise In the adoption of Reusable Water Bottle Industry?

Increasing demand for Eco-friendly products is the key driver of the market.

  • Reusable water bottles have gained significant importance in today's consumer market as concerns about plastic waste and health issues continue to rise. Single-use plastic bottles contribute an alarming amount of trash, which poses a potential environmental disaster. In response, businesses are introducing reusable water bottles with built-in mechanisms like filters to eliminate contaminants, ensuring consumers have access to clean water on the go. These eco-friendly alternatives offer numerous advantages over conventional plastic bottles, including reducing emissions associated with their production and disposal. As consumer shopping patterns shift towards online shopping and technological behemoths dominate the retailing industry, start-ups and local companies are also capitalizing on this trend.
  • Companies such as Lifetime Brands Inc, Klean Kanteen, O2CooL LLC, and Nalge Nunc International Corp are producing reusable water bottles made from environmentally friendly materials like recycled  stainless steel, glass, and BPA-free plastics. With increasing health concerns, particularly those related to BPA and its association with cancer, gastrointestinal ailments, neurological impairments, and reproductive issues, consumers are becoming more knowledgeable about the potential risks of using plastic bottles. As a result, the demand for reusable water bottles is on the rise, making them an essential consumer good In the lifestyle transition towards a healthier and more sustainable future.

What are the market trends shaping the Reusable Water Bottle Industry?

Technological advancement in high-quality, durable, and reusable water bottles is the upcoming market trend.

  • Reusable water bottles have become an essential item for consumers, with growing concerns over plastic trash and potential health issues associated with conventional plastic bottles. Manufacturers, including Lifetime Brands Inc, Klean Kanteen, O2CooL LLC, and Nalge Nunc International Corp, are continually innovating and upgrading their products to meet the demands of health-conscious consumers. These businesses are incorporating built-in mechanisms, such as filters to remove contaminants, and producing BPA-free bottles to address concerns over cancer and other health issues. Advantages of reusable water bottles extend beyond health benefits, as they also contribute to reducing plastic waste and emissions. Technological behemoths, such as Amazon and other e-Commerce platforms, have capitalized on consumer shopping patterns, making it easier for consumers to purchase these products online.
  • Start-ups and local companies are also entering the market, offering unique designs and materials, such as borosilicate glass, which is more resistant to temperature changes and more durable than regular glass. The retailing industry and consumer goods sector have seen a significant shift towards reusable water bottles, with online shopping and conventional specialty stores offering a wide range of options. Consumers are increasingly aware of the potential environmental disaster caused by plastic waste and the health issues associated with BPA and other chemicals found in plastic bottles. As a result, reusable water bottles offer a practical and sustainable solution for individuals looking to make a positive impact on their health and the environment.

What challenges does the Reusable Water Bottle Industry face during its growth?

Use of substandard plastic materials in reusable water bottles is a key challenge affecting the industry growth.

  • Reusable water bottles have gained significant importance in today's world due to growing health concerns and consumer awareness towards reducing plastic trash. Businesses have responded by introducing various types of reusable water bottles, including those with built-in mechanisms like filters to eliminate contaminants. The advantages of using reusable water bottles over plastic ones are numerous. They help reduce the amount of plastic waste, minimize emissions from manufacturing and transportation of plastic bottles, and offer BPA-free alternatives, reducing the risk of health issues like cancer. However, the quality of materials used in manufacturing reusable water bottles is a critical factor. Inferior plastic materials can negatively impact the environment and undercut the sustainability benefits of reusable bottles.
  • They are less durable, leading to shorter lifespans and increased waste. Moreover, they may pose health risks due to potential contaminants and polluted water. In the consumer shopping patterns of today, e-Commerce and technological behemoths dominate, but local companies and start-ups also play a role. Consumers, increasingly aware of health concerns and lifestyle transitioning, are making informed decisions based on their consumer knowledge. Reusable water bottles offer a viable solution to the potential environmental disaster caused by the energy sector's reliance on plastic bottles and the health issues associated with their use, including reproductive issues, gastrointestinal ailments, and neurological impairments.

Exclusive Customer Landscape

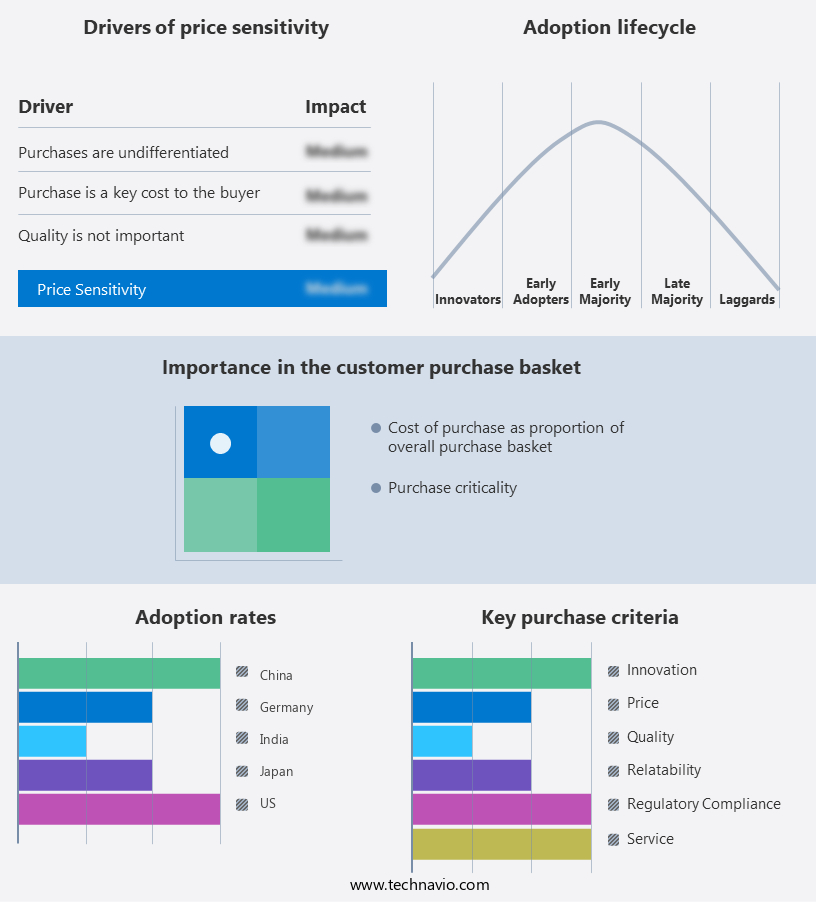
The reusable water bottle market forecasting report includes the adoption lifecycle of the market, covering from the innovator's stage to the laggard's stage. It focuses on adoption rates in different regions based on penetration. Furthermore, the reusable water bottle market report also includes key purchase criteria and drivers of price sensitivity to help companies evaluate and develop their market growth analysis strategies.

Reusable Water Bottle Market Share by Geography

 Customer Landscape

Key Companies & Market Insights

Companies are implementing various strategies, such as strategic alliances, reusable water bottle market forecast, partnerships, mergers and acquisitions, geographical expansion, and product/service launches, to enhance their presence In the industry.

The industry research and growth report includes detailed analyses of the competitive landscape of the market and information about key companies, including:

  • A. O. Smith Corp.
  • Bulletin Brands Inc.
  • Chillys Bottles Ltd.
  • Cool Gear International LLC
  • Daylesford Organic Ltd.
  • Happy and Hydrated Ltd.
  • HYDAWAY LLC
  • Klean Kanteen
  • Lifetime Brands Inc.
  • Nalge Nunc International Corp.
  • Newell Brands Inc.
  • Nippon Sanso Holdings Co. Ltd.
  • O2Cool LLC
  • Re Co. SA
  • Shock Doctor Inc.
  • SIGG Switzerland Bottles AG
  • The Clorox Co.
  • The Ocean Bottle Ltd.
  • Vista Outdoor Inc.
  • VOSS of Norway AS

Qualitative and quantitative analysis of companies has been conducted to help clients understand the wider business environment as well as the strengths and weaknesses of key industry players. Data is qualitatively analyzed to categorize companies as pure play, category-focused, industry-focused, and diversified; it is quantitatively analyzed to categorize companies as dominant, leading, strong, tentative, and weak.

Research Analyst Overview

Reusable water bottles have gained significant popularity in recent years as consumers become increasingly conscious of the environmental hazards posed by single-use plastic bottles. These kitchen products are now a staple for millennials and Generation X, who prefer them for picnics, outdoor recreation, and city parks. Reusable water bottles come in various materials such as glass and metal, providing an eco-friendly alternative to plastic. The market for reusable water bottles is thriving, with brands like Hydro Flask, Nalgene, Klean Kanteen, Contigo, and Hydaway leading the way. Stainless-steel bottles are particularly popular due to their durability and sustainability. However, glass water bottles also have their advantages, including being free of Bisphenol A, a chemical compound linked to health concerns.

Reusable water bottles not only help reduce plastic waste in landfills but also minimize groundwater pollution caused by plastic bottles. The use of reusable bottles promotes a healthier lifestyle and reduces the carbon footprint associated with the production and disposal of plastic material. Recycled materials are increasingly being used to make reusable water bottles, further reducing their environmental impact. Workplaces, colleges, schools, and even homes are adopting the use of reusable water bottles to minimize their use of plastic and contribute to a more sustainable future. Despite the benefits, it's essential to ensure proper cleaning to prevent germs and contamination.

Reusable Water Bottle Market Scope

Report Coverage

Details

Page number

155

Base year

2023

Historic period

2018-2022

Forecast period

2024-2028

Growth momentum & CAGR

Accelerate at a CAGR of 4.6%

Market growth 2024-2028

USD 2179.4 million

Market structure

Fragmented

YoY growth 2023-2024(%)

4.18

Key countries

China, US, India, Germany, Japan, France, Spain, and South Africa

Competitive landscape

Leading Companies, Market Positioning of Companies, Competitive Strategies, and Industry Risks

Request Free Sample

What are the Key Data Covered in this Reusable Water Bottle Market Research and Growth Report?

  • CAGR of the Reusable Water Bottle industry during the forecast period
  • Detailed information on factors that will drive the Reusable Water Bottle growth and forecasting between 2024 and 2028
  • Precise estimation of the size of the market and its contribution of the industry in focus to the parent market
  • Accurate predictions about upcoming growth and trends and changes in consumer behaviour
  • Growth of the market across APAC, North America, Europe, South America, and Middle East and Africa
  • Thorough analysis of the market's competitive landscape and detailed information about companies
  • Comprehensive analysis of factors that will challenge the reusable water bottle market growth of industry companies

We can help! Our analysts can customize this reusable water bottle market research report to meet your requirements.

Get in touch

1 Executive Summary

  • 1.1 Market overview
    • Executive Summary - Chart on Market Overview
    • Executive Summary - Data Table on Market Overview
    • Executive Summary - Chart on Global Market Characteristics
    • Executive Summary - Chart on Market by Geography
    • Executive Summary - Chart on Market Segmentation by Distribution Channel
    • Executive Summary - Chart on Market Segmentation by Type
    • Executive Summary - Chart on Incremental Growth
    • Executive Summary - Data Table on Incremental Growth
    • Executive Summary - Chart on Company Market Positioning

2 Market Landscape

  • 2.1 Market ecosystem
    • Parent Market
    • Data Table on - Parent Market
  • 2.2 Market characteristics
    • Market characteristics analysis
  • 2.3 Value chain analysis
    • Value Chain Analysis

3 Market Sizing

  • 3.1 Market definition
    • Offerings of companies included in the market definition
  • 3.2 Market segment analysis
    • Market segments
  • 3.3 Market size 2023
    • 3.4 Market outlook: Forecast for 2023-2028
      • Chart on Global - Market size and forecast 2023-2028 ($ million)
      • Data Table on Global - Market size and forecast 2023-2028 ($ million)
      • Chart on Global Market: Year-over-year growth 2023-2028 (%)
      • Data Table on Global Market: Year-over-year growth 2023-2028 (%)

    4 Historic Market Size

    • 4.1 Global Reusable Water Bottle Market 2018 - 2022
      • Historic Market Size - Data Table on Global Reusable Water Bottle Market 2018 - 2022 ($ million)
    • 4.2 Distribution Channel segment analysis 2018 - 2022
      • Historic Market Size - Distribution Channel Segment 2018 - 2022 ($ million)
    • 4.3 Type segment analysis 2018 - 2022
      • Historic Market Size - Type Segment 2018 - 2022 ($ million)
    • 4.4 Geography segment analysis 2018 - 2022
      • Historic Market Size - Geography Segment 2018 - 2022 ($ million)
    • 4.5 Country segment analysis 2018 - 2022
      • Historic Market Size - Country Segment 2018 - 2022 ($ million)

    5 Five Forces Analysis

    • 5.1 Five forces summary
      • Five forces analysis - Comparison between 2023 and 2028
    • 5.2 Bargaining power of buyers
      • Bargaining power of buyers - Impact of key factors 2023 and 2028
    • 5.3 Bargaining power of suppliers
      • Bargaining power of suppliers - Impact of key factors in 2023 and 2028
    • 5.4 Threat of new entrants
      • Threat of new entrants - Impact of key factors in 2023 and 2028
    • 5.5 Threat of substitutes
      • Threat of substitutes - Impact of key factors in 2023 and 2028
    • 5.6 Threat of rivalry
      • Threat of rivalry - Impact of key factors in 2023 and 2028
    • 5.7 Market condition
      • Chart on Market condition - Five forces 2023 and 2028

    6 Market Segmentation by Distribution Channel

    • 6.1 Market segments
      • Chart on Distribution Channel - Market share 2023-2028 (%)
      • Data Table on Distribution Channel - Market share 2023-2028 (%)
    • 6.2 Comparison by Distribution Channel
      • Chart on Comparison by Distribution Channel
      • Data Table on Comparison by Distribution Channel
    • 6.3 Offline - Market size and forecast 2023-2028
      • Chart on Offline - Market size and forecast 2023-2028 ($ million)
      • Data Table on Offline - Market size and forecast 2023-2028 ($ million)
      • Chart on Offline - Year-over-year growth 2023-2028 (%)
      • Data Table on Offline - Year-over-year growth 2023-2028 (%)
    • 6.4 Online - Market size and forecast 2023-2028
      • Chart on Online - Market size and forecast 2023-2028 ($ million)
      • Data Table on Online - Market size and forecast 2023-2028 ($ million)
      • Chart on Online - Year-over-year growth 2023-2028 (%)
      • Data Table on Online - Year-over-year growth 2023-2028 (%)
    • 6.5 Market opportunity by Distribution Channel
      • Market opportunity by Distribution Channel ($ million)
      • Data Table on Market opportunity by Distribution Channel ($ million)

    7 Market Segmentation by Type

    • 7.1 Market segments
      • Chart on Type - Market share 2023-2028 (%)
      • Data Table on Type - Market share 2023-2028 (%)
    • 7.2 Comparison by Type
      • Chart on Comparison by Type
      • Data Table on Comparison by Type
    • 7.3 Plastic - Market size and forecast 2023-2028
      • Chart on Plastic - Market size and forecast 2023-2028 ($ million)
      • Data Table on Plastic - Market size and forecast 2023-2028 ($ million)
      • Chart on Plastic - Year-over-year growth 2023-2028 (%)
      • Data Table on Plastic - Year-over-year growth 2023-2028 (%)
    • 7.4 Metal - Market size and forecast 2023-2028
      • Chart on Metal - Market size and forecast 2023-2028 ($ million)
      • Data Table on Metal - Market size and forecast 2023-2028 ($ million)
      • Chart on Metal - Year-over-year growth 2023-2028 (%)
      • Data Table on Metal - Year-over-year growth 2023-2028 (%)
    • 7.5 Silicone - Market size and forecast 2023-2028
      • Chart on Silicone - Market size and forecast 2023-2028 ($ million)
      • Data Table on Silicone - Market size and forecast 2023-2028 ($ million)
      • Chart on Silicone - Year-over-year growth 2023-2028 (%)
      • Data Table on Silicone - Year-over-year growth 2023-2028 (%)
    • 7.6 Glass - Market size and forecast 2023-2028
      • Chart on Glass - Market size and forecast 2023-2028 ($ million)
      • Data Table on Glass - Market size and forecast 2023-2028 ($ million)
      • Chart on Glass - Year-over-year growth 2023-2028 (%)
      • Data Table on Glass - Year-over-year growth 2023-2028 (%)
    • 7.7 Market opportunity by Type
      • Market opportunity by Type ($ million)
      • Data Table on Market opportunity by Type ($ million)

    8 Customer Landscape

    • 8.1 Customer landscape overview
      • Analysis of price sensitivity, lifecycle, customer purchase basket, adoption rates, and purchase criteria

    9 Geographic Landscape

    • 9.1 Geographic segmentation
      • Chart on Market share by geography 2023-2028 (%)
      • Data Table on Market share by geography 2023-2028 (%)
    • 9.2 Geographic comparison
      • Chart on Geographic comparison
      • Data Table on Geographic comparison
    • 9.3 APAC - Market size and forecast 2023-2028
      • Chart on APAC - Market size and forecast 2023-2028 ($ million)
      • Data Table on APAC - Market size and forecast 2023-2028 ($ million)
      • Chart on APAC - Year-over-year growth 2023-2028 (%)
      • Data Table on APAC - Year-over-year growth 2023-2028 (%)
    • 9.4 North America - Market size and forecast 2023-2028
      • Chart on North America - Market size and forecast 2023-2028 ($ million)
      • Data Table on North America - Market size and forecast 2023-2028 ($ million)
      • Chart on North America - Year-over-year growth 2023-2028 (%)
      • Data Table on North America - Year-over-year growth 2023-2028 (%)
    • 9.5 Europe - Market size and forecast 2023-2028
      • Chart on Europe - Market size and forecast 2023-2028 ($ million)
      • Data Table on Europe - Market size and forecast 2023-2028 ($ million)
      • Chart on Europe - Year-over-year growth 2023-2028 (%)
      • Data Table on Europe - Year-over-year growth 2023-2028 (%)
    • 9.6 South America - Market size and forecast 2023-2028
      • Chart on South America - Market size and forecast 2023-2028 ($ million)
      • Data Table on South America - Market size and forecast 2023-2028 ($ million)
      • Chart on South America - Year-over-year growth 2023-2028 (%)
      • Data Table on South America - Year-over-year growth 2023-2028 (%)
    • 9.7 Middle East and Africa - Market size and forecast 2023-2028
      • Chart on Middle East and Africa - Market size and forecast 2023-2028 ($ million)
      • Data Table on Middle East and Africa - Market size and forecast 2023-2028 ($ million)
      • Chart on Middle East and Africa - Year-over-year growth 2023-2028 (%)
      • Data Table on Middle East and Africa - Year-over-year growth 2023-2028 (%)
    • 9.8 China - Market size and forecast 2023-2028
      • Chart on China - Market size and forecast 2023-2028 ($ million)
      • Data Table on China - Market size and forecast 2023-2028 ($ million)
      • Chart on China - Year-over-year growth 2023-2028 (%)
      • Data Table on China - Year-over-year growth 2023-2028 (%)
    • 9.9 US - Market size and forecast 2023-2028
      • Chart on US - Market size and forecast 2023-2028 ($ million)
      • Data Table on US - Market size and forecast 2023-2028 ($ million)
      • Chart on US - Year-over-year growth 2023-2028 (%)
      • Data Table on US - Year-over-year growth 2023-2028 (%)
    • 9.10 India - Market size and forecast 2023-2028
      • Chart on India - Market size and forecast 2023-2028 ($ million)
      • Data Table on India - Market size and forecast 2023-2028 ($ million)
      • Chart on India - Year-over-year growth 2023-2028 (%)
      • Data Table on India - Year-over-year growth 2023-2028 (%)
    • 9.11 Germany - Market size and forecast 2023-2028
      • Chart on Germany - Market size and forecast 2023-2028 ($ million)
      • Data Table on Germany - Market size and forecast 2023-2028 ($ million)
      • Chart on Germany - Year-over-year growth 2023-2028 (%)
      • Data Table on Germany - Year-over-year growth 2023-2028 (%)
    • 9.12 Japan - Market size and forecast 2023-2028
      • Chart on Japan - Market size and forecast 2023-2028 ($ million)
      • Data Table on Japan - Market size and forecast 2023-2028 ($ million)
      • Chart on Japan - Year-over-year growth 2023-2028 (%)
      • Data Table on Japan - Year-over-year growth 2023-2028 (%)
    • 9.13 Market opportunity by geography
      • Market opportunity by geography ($ million)
      • Data Tables on Market opportunity by geography ($ million)
    • 9.14 China - Market size and forecast (2023-2028)
      • Chart on China - Market size and forecast (2023-2028) ($ million)
      • Data Table on China - Market size and forecast (2023-2028) ($ million)
      • Chart on China - Year-over-year growth (2023-2028) (%)
      • Data Table on China - Year-over-year growth (2023-2028) (%)
    • 9.15 US - Market size and forecast (2023-2028)
      • Chart on US - Market size and forecast (2023-2028) ($ million)
      • Data Table on US - Market size and forecast (2023-2028) ($ million)
      • Chart on US - Year-over-year growth (2023-2028) (%)
      • Data Table on US - Year-over-year growth (2023-2028) (%)
    • 9.16 India - Market size and forecast (2023-2028)
      • Chart on India - Market size and forecast (2023-2028) ($ million)
      • Data Table on India - Market size and forecast (2023-2028) ($ million)
      • Chart on India - Year-over-year growth (2023-2028) (%)
      • Data Table on India - Year-over-year growth (2023-2028) (%)
    • 9.17 Germany - Market size and forecast (2023-2028)
      • Chart on Germany - Market size and forecast (2023-2028) ($ million)
      • Data Table on Germany - Market size and forecast (2023-2028) ($ million)
      • Chart on Germany - Year-over-year growth (2023-2028) (%)
      • Data Table on Germany - Year-over-year growth (2023-2028) (%)
    • 9.18 Japan - Market size and forecast (2023-2028)
      • Chart on Japan - Market size and forecast (2023-2028) ($ million)
      • Data Table on Japan - Market size and forecast (2023-2028) ($ million)
      • Chart on Japan - Year-over-year growth (2023-2028) (%)
      • Data Table on Japan - Year-over-year growth (2023-2028) (%)

    10 Drivers, Challenges, and Opportunity/Restraints

    • 10.1 Market drivers
      • 10.2 Market challenges
        • 10.3 Impact of drivers and challenges
          • Impact of drivers and challenges in 2023 and 2028
        • 10.4 Market opportunities/restraints

          11 Competitive Landscape

          • 11.1 Overview
            • 11.2 Competitive Landscape
              • Overview on criticality of inputs and factors of differentiation
            • 11.3 Landscape disruption
              • Overview on factors of disruption
            • 11.4 Industry risks
              • Impact of key risks on business

            12 Competitive Analysis

            • 12.1 Companies profiled
              • Companies covered
            • 12.2 Market positioning of companies
              • Matrix on companies position and classification
            • 12.3 A. O. Smith Corp.
              • A. O. Smith Corp. - Overview
              • A. O. Smith Corp. - Business segments
              • A. O. Smith Corp. - Key news
              • A. O. Smith Corp. - Key offerings
              • A. O. Smith Corp. - Segment focus
            • 12.4 Bulletin Brands Inc.
              • Bulletin Brands Inc. - Overview
              • Bulletin Brands Inc. - Product / Service
              • Bulletin Brands Inc. - Key offerings
            • 12.5 Chillys Bottles Ltd.
              • Chillys Bottles Ltd. - Overview
              • Chillys Bottles Ltd. - Product / Service
              • Chillys Bottles Ltd. - Key offerings
            • 12.6 Cool Gear International LLC
              • Cool Gear International LLC - Overview
              • Cool Gear International LLC - Product / Service
              • Cool Gear International LLC - Key offerings
            • 12.7 HYDAWAY LLC
              • HYDAWAY LLC - Overview
              • HYDAWAY LLC - Product / Service
              • HYDAWAY LLC - Key offerings
            • 12.8 Klean Kanteen
              • Klean Kanteen - Overview
              • Klean Kanteen - Product / Service
              • Klean Kanteen - Key offerings
            • 12.9 Lifetime Brands Inc.
              • Lifetime Brands Inc. - Overview
              • Lifetime Brands Inc. - Product / Service
              • Lifetime Brands Inc. - Key offerings
            • 12.10 Nalge Nunc International Corp.
              • Nalge Nunc International Corp. - Overview
              • Nalge Nunc International Corp. - Product / Service
              • Nalge Nunc International Corp. - Key offerings
            • 12.11 Newell Brands Inc.
              • Newell Brands Inc. - Overview
              • Newell Brands Inc. - Business segments
              • Newell Brands Inc. - Key news
              • Newell Brands Inc. - Key offerings
              • Newell Brands Inc. - Segment focus
            • 12.12 Nippon Sanso Holdings Co. Ltd.
              • Nippon Sanso Holdings Co. Ltd. - Overview
              • Nippon Sanso Holdings Co. Ltd. - Product / Service
              • Nippon Sanso Holdings Co. Ltd. - Key offerings
            • 12.13 O2Cool LLC
              • O2Cool LLC - Overview
              • O2Cool LLC - Product / Service
              • O2Cool LLC - Key offerings
            • 12.14 Shock Doctor Inc.
              • Shock Doctor Inc. - Overview
              • Shock Doctor Inc. - Product / Service
              • Shock Doctor Inc. - Key offerings
            • 12.15 SIGG Switzerland Bottles AG
              • SIGG Switzerland Bottles AG - Overview
              • SIGG Switzerland Bottles AG - Product / Service
              • SIGG Switzerland Bottles AG - Key offerings
            • 12.16 The Clorox Co.
              • The Clorox Co. - Overview
              • The Clorox Co. - Business segments
              • The Clorox Co. - Key news
              • The Clorox Co. - Key offerings
              • The Clorox Co. - Segment focus
            • 12.17 Vista Outdoor Inc.
              • Vista Outdoor Inc. - Overview
              • Vista Outdoor Inc. - Business segments
              • Vista Outdoor Inc. - Key news
              • Vista Outdoor Inc. - Key offerings
              • Vista Outdoor Inc. - Segment focus

            13 Appendix

            • 13.1 Scope of the report
              • 13.2 Inclusions and exclusions checklist
                • Inclusions checklist
                • Exclusions checklist
              • 13.3 Currency conversion rates for US$
                • Currency conversion rates for US$
              • 13.4 Research methodology
                • Research methodology
              • 13.5 Data procurement
                • Information sources
              • 13.6 Data validation
                • Data validation
              • 13.7 Validation techniques employed for market sizing
                • Validation techniques employed for market sizing
              • 13.8 Data synthesis
                • Data synthesis
              • 13.9 360 degree market analysis
                • 360 degree market analysis
              • 13.10 List of abbreviations
                • List of abbreviations

              Research Methodology

              Technavio presents a detailed picture of the market by way of study, synthesis, and summation of data from multiple sources. The analysts have presented the various facets of the market with a particular focus on identifying the key industry influencers. The data thus presented is comprehensive, reliable, and the result of extensive research, both primary and secondary.

              INFORMATION SOURCES

              Primary sources

              • Manufacturers and suppliers
              • Channel partners
              • Industry experts
              • Strategic decision makers

              Secondary sources

              • Industry journals and periodicals
              • Government data
              • Financial reports of key industry players
              • Historical data
              • Press releases

              DATA ANALYSIS

              Data Synthesis

              • Collation of data
              • Estimation of key figures
              • Analysis of derived insights

              Data Validation

              • Triangulation with data models
              • Reference against proprietary databases
              • Corroboration with industry experts

              REPORT WRITING

              Qualitative

              • Market drivers
              • Market challenges
              • Market trends
              • Five forces analysis

              Quantitative

              • Market size and forecast
              • Market segmentation
              • Geographical insights
              • Competitive landscape

              Interested in this report?

              Get your sample now to see our research methodology and insights!

              Download Now

              Frequently Asked Questions

              Reusable Water Bottle market growth will increase by $ 2179.4 mn during 2024-2028.

              The Reusable Water Bottle market is expected to grow at a CAGR of 4.6% during 2024-2028.

              Reusable Water Bottle market is segmented by Distribution Channel( Offline, Online) Type( Plastic, Metal, Silicone, Glass)

              A. O. Smith Corp., Bulletin Brands Inc., Chillys Bottles Ltd., Cool Gear International LLC, Daylesford Organic Ltd., Happy and Hydrated Ltd., HYDAWAY LLC, Klean Kanteen, Lifetime Brands Inc., Nalge Nunc International Corp., Newell Brands Inc., Nippon Sanso Holdings Co. Ltd., O2Cool LLC, Re Co. SA, Shock Doctor Inc., SIGG Switzerland Bottles AG, The Clorox Co., The Ocean Bottle Ltd., Vista Outdoor Inc., VOSS of Norway AS are a few of the key vendors in the Reusable Water Bottle market.

              APAC will register the highest growth rate of 53% among the other regions. Therefore, the Reusable Water Bottle market in APAC is expected to garner significant business opportunities for the vendors during the forecast period.

              China, US, India, Germany, Japan, France, Spain, South Africa

              • Increasing demand for Eco-friendly productsConsumers are increasingly worried about the environmental impact of single-use plastic water bottles and are looking for environmentally friendly alternatives. Reusable water bottles are a convenient and practical answer to this problem because they can be used several times while reducing the quantity of plastic waste produced. The more people are becoming environmentally concerned is the driving factor this market.
              • the more the demand for eco-friendly products in general is the driving factor this market.
              • particularly reusable water bottles is the driving factor this market.
              • increasing. Companies like Lifetime Brands Inc is the driving factor this market.
              • Klean Kanteen is the driving factor this market.
              • O2CooL LLC is the driving factor this market.
              • and Nalge Nunc International Corp that make these items are responding to this trend by creating products made of environmentally friendly materials such as stainless steel is the driving factor this market.
              • glass is the driving factor this market.
              • and BPA-free plastics. Furthermore is the driving factor this market.
              • many consumers are willing to pay higher prices for environmentally friendly and socially responsible items. Companies that prioritize sustainability and environmental friendliness in their products are more likely to attract new customers and obtain a competitive advantage in the market. Thus is the driving factor this market.
              • the increase in demand for Eco-friendly products is expected to drive the growth of global reusable water bottles during the forecast period. is the driving factor this market.

              The Reusable Water Bottle market vendors should focus on grabbing business opportunities from the Offline segment as it accounted for the largest market share in the base year.