
Reverse Logistics Automation Software Market Size and Growth Forecast 2026-2030
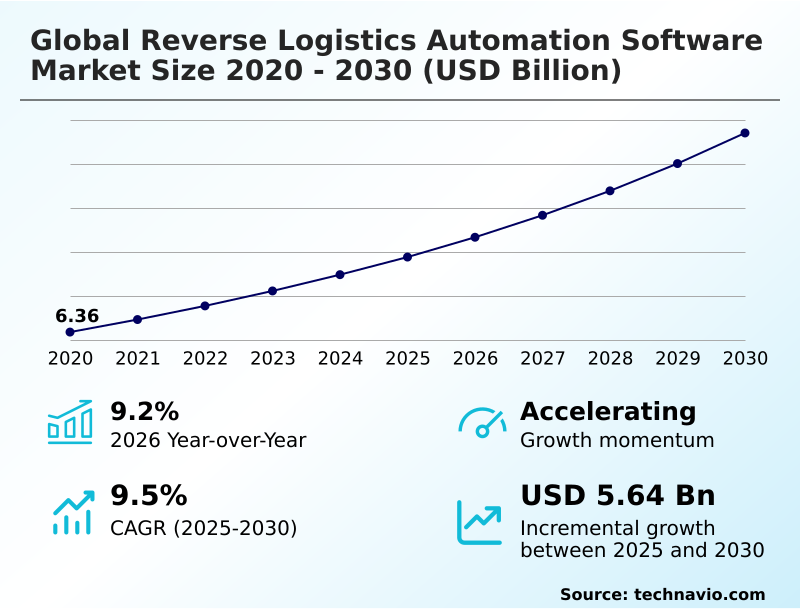
The Reverse Logistics Automation Software Market size was valued at USD 9.77 billion in 2025 growing at a CAGR of 9.5% during the forecast period 2026-2030.
North America accounts for 38.9% of incremental growth during the forecast period. The Cloud based segment by Deployment was valued at USD 5.50 billion in 2024, while the Professional services segment holds the largest revenue share by Service.
The market is projected to grow by USD 9.05 billion from 2020 to 2030, with USD 5.64 billion of the growth expected during the forecast period of 2025 to 2030.
Get Key Insights on Market Forecast (PDF) Request Free Sample
Reverse Logistics Automation Software Market Overview
The reverse logistics automation software market is defined by a consistent 9.2% year-over-year growth, driven by the need for operational transparency and cost reduction in managing the circular flow of products. North America accounts for 38.9% of the market's incremental growth, where the high cost of labor incentivizes adoption. A key application is the use of a returns management system for product returns management, which is critical in high-volume sectors. For example, a major consumer electronics manufacturer implemented an automated returns processing platform to handle warranty claims. This system uses advanced returns data analytics for automated disposition, which reduced processing time for its reverse supply chain operations. The integration of a reverse logistics platform not only streamlines the return merchandise authorization (RMA) process but also provides the data needed for returns optimization, allowing for quicker inventory reintegration and improved asset recovery. This strategic shift from manual processing is now a baseline for competitive agility.
Drivers, Trends, and Challenges in the Reverse Logistics Automation Software Market
The strategic importance of reverse logistics is growing, directly influencing decisions around the cost-benefit analysis of reverse logistics automation. Organizations are assessing the impact of automated returns on customer retention, recognizing that a seamless post-purchase experience is a key differentiator.
The technical challenge often lies in integrating reverse logistics software with WMS and existing ERP systems, which is a critical step in achieving a unified data environment. Adhering to the best practices for omnichannel returns strategy involves creating consistent processes across online and physical channels.
Forward-thinking companies are now using AI to predict and reduce return rates by analyzing purchasing patterns and offering targeted incentives. For instance, an automotive parts supplier managing core component returns must comply with strict material tracking regulations.
By implementing a system that leverages the role of blockchain in reverse logistics transparency, the supplier can create an immutable record for each part, simplifying compliance and warranty management.
This shift toward reverse logistics automation for circular economy models allows the company to reduce processing times by over 30% compared to manual methods, directly improving operational cash flow and supporting sustainability goals under frameworks like the EU Waste Shipment Regulation.
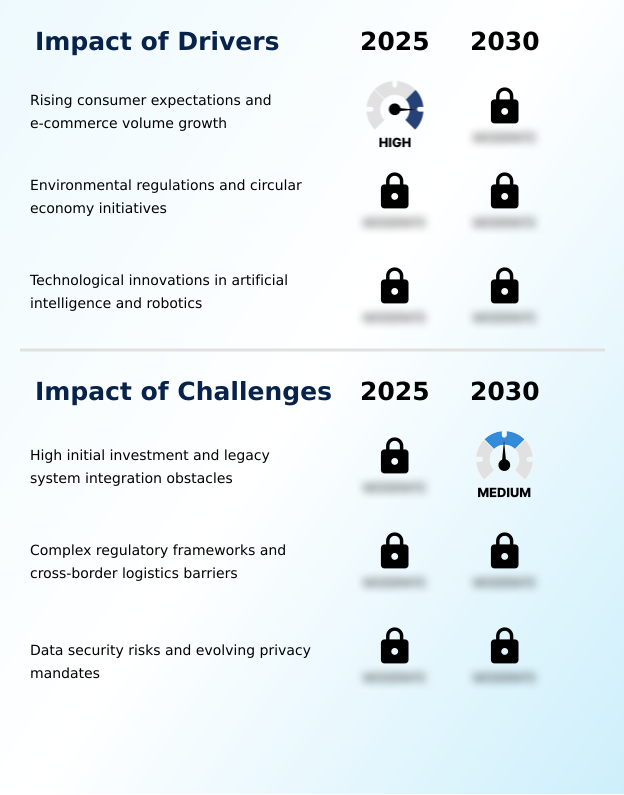
Primary Growth Driver: Rising consumer expectations for seamless post-purchase experiences, coupled with the escalating volume of e-commerce returns, are primary drivers for market adoption.
The escalating volume of e-commerce and rising consumer expectations for convenient, frictionless returns are primary market drivers.
The shift toward a customer returns portal that supports features like boxless returns is a direct response to these demands, as manual systems cannot scale to meet high-volume needs.
Concurrently, the global push toward a circular economy, reinforced by regulations like the EU's Circular Electronics Act, compels companies to adopt transparent returns lifecycle management.
This focus on sustainability is transforming the reverse supply chain from a cost center into a source of returns value recovery.
With the APAC market growing at 10.1%, the need for robust digital infrastructure to manage these complex flows is undeniable, making automation a strategic tool for customer retention and long-term brand health.
Emerging Market Trend: The integration of generative AI for dynamic dispositioning is a significant market trend. This technology enables real-time, data-driven decisions on the optimal path for returned items, maximizing value recovery.
The market is advancing through the integration of generative AI and machine learning to facilitate dynamic, automated disposition. This trend in AI-powered returns allows a system to analyze thousands of variables in real-time, including resale market value and refurbishment costs, to determine the most profitable path for a returned item.
The adoption of automated grading and sorting through computer vision modules further accelerates processing in high-volume warehouses, detecting defects without human intervention. This focus on returns optimization is supported by collaborative data exchanges that enable predictive returns forecasting, helping companies anticipate and potentially reduce return volumes.
Such intelligent systems are crucial for managing the overhead of manual inspections and maximizing returns value recovery, shifting software from a record-keeping tool to a primary decision-maker in the reverse supply chain.
Key Industry Challenge: The high initial investment required for implementation and the complexities of integrating new software with legacy systems present significant challenges to market growth.
A primary market challenge is the significant capital expenditure and technical complexity of integrating a new returns management system with legacy infrastructures, such as fragmented ERP systems not designed for a bidirectional reverse supply chain.
This obstacle is compounded by a lack of standardized APIs, which can necessitate expensive custom coding and lead to data silos that hinder exception handling automation. For many organizations, the short-term ROI is difficult to calculate, causing hesitation.
Furthermore, ensuring data security within automated return portals is a critical concern, with regulations like the California Privacy Protection Agency guidelines mandating rigorous data handling protocols for product returns management. This requires investment in advanced encryption and security audits, adding to the total cost of ownership and complicating the process of inventory reintegration and managing the return merchandise authorization (RMA).
Explore Full Market Dynamics Analysis Request Free Sample
Reverse Logistics Automation Software Market Segmentation
The reverse logistics automation software industry research report provides comprehensive data including region-wise segment analysis, with forecasts and analysis for the period 2026-2030, as well as historical data from 2020-2024 for the following segments.
Deployment Segment Analysis
The cloud based segment is estimated to witness significant growth during the forecast period.
The cloud based segment is pivotal, offering scalability to manage fluctuating return volumes without significant capital expenditure on physical servers.
This model facilitates the integration of advanced technologies, with AI-powered returns becoming standard for predictive tasks like forecasting return likelihoods based on purchasing patterns.
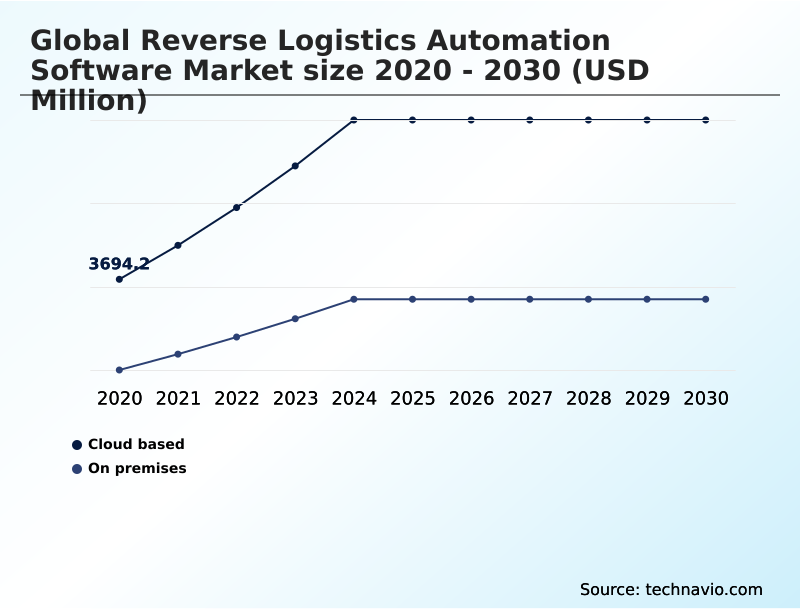
A robust returns management system deployed on the cloud enables real-time data synchronization across global databases, essential for providing a comprehensive supply chain visibility platform.
For instance, microservices architecture ensures system uptime during peak periods, while specialized software-as-a-service companies embed environmental compliance tools.
The adoption of reverse logistics workflow automation through the cloud allows smaller businesses to access capabilities previously exclusive to large corporations, driving market expansion and improving overall efficiency in returns data analytics.
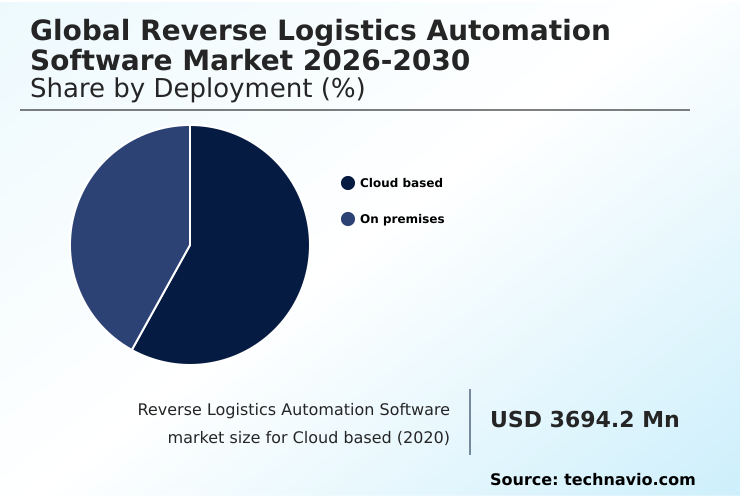
The Cloud based segment was valued at USD 5.50 billion in 2024 and showed a gradual increase during the forecast period.
Reverse Logistics Automation Software Market by Region: North America Leads with 38.9% Growth Share
North America is estimated to contribute 38.9% to the growth of the global market during the forecast period.
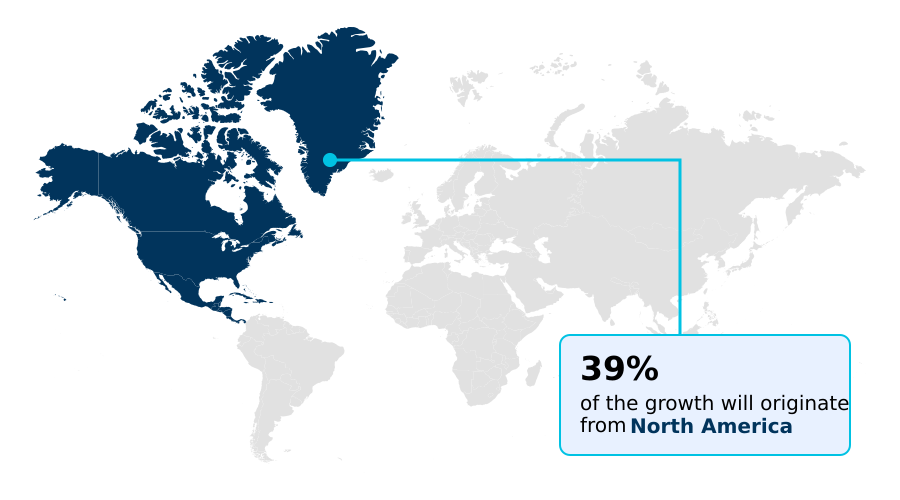
The geographic landscape is led by North America, which accounts for 38.92% of the global opportunity, driven by a mature e-commerce sector and high labor costs that favor automation.
Following is Europe at 26.83%, where adoption of a reverse logistics platform is heavily influenced by circular economy logistics mandates like the EU's Waste Shipment Regulation.
APAC contributes 25.41%, exhibiting the fastest growth as regional players scale up their omnichannel returns management capabilities. These systems provide real-time returns tracking, which is critical for managing complex supply chains.
The successful execution of a return to vendor (RTV) process in this varied landscape depends on software that can adapt to different regulatory and consumer environments, reinforcing the need for flexible, region-specific deployment strategies.
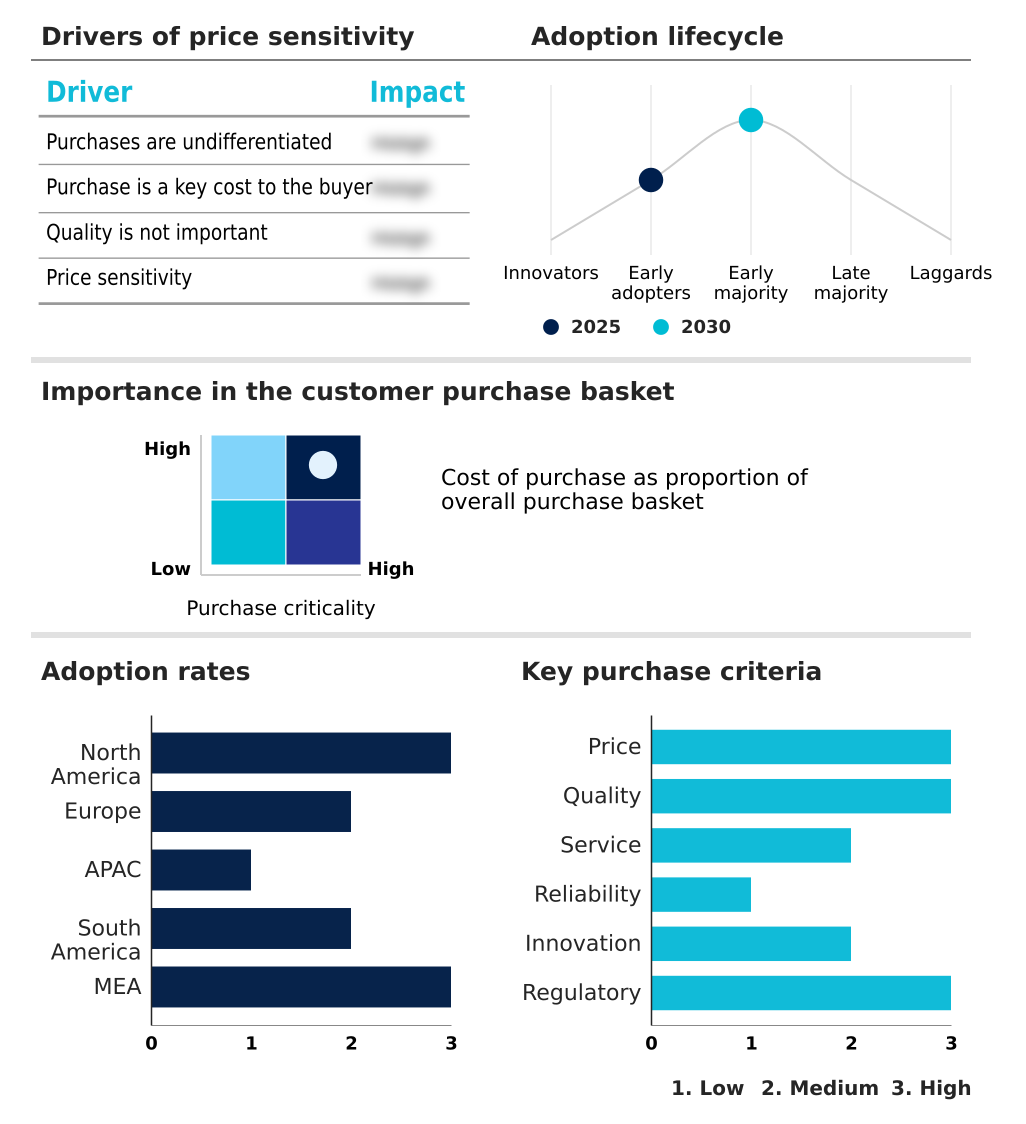
Customer Landscape Analysis for the Reverse Logistics Automation Software Market
The reverse logistics automation software market forecasting report includes the adoption lifecycle of the market, covering from the innovator’s stage to the laggard’s stage. It focuses on adoption rates in different regions based on penetration. Furthermore, the reverse logistics automation software market report also includes key purchase criteria and drivers of price sensitivity to help companies evaluate and develop their market growth analysis strategies.
Competitive Landscape of the Reverse Logistics Automation Software Market
Companies are implementing various strategies, such as strategic alliances, partnerships, mergers and acquisitions, geographical expansion, and product/service launches, to enhance their presence in the reverse logistics automation software market industry.
12return - The company delivers a reverse logistics solution designed for automated returns processing, quality verification, and efficient inventory reintegration.
The industry research and growth report includes detailed analyses of the competitive landscape of the market and information about key companies, including:
- 12return
- AfterShip Group
- Blue Yonder Group Inc.
- Descartes Systems Group Inc.
- FarEye Technologies Inc.
- Happy Returns
- Inmar Inc.
- Korber AG.
- Loop Returns
- Manhattan Associates Inc.
- Mara Labs Inc.
- Narvar Inc.
- Oracle Corp.
- Parcel Perform Pte Ltd.
- ReBound Returns
- ReturnLogic.
- ReverseLogix
- SAP SE
- ShipHero LLC Inc.
- ZigZag Global Ltd.
Qualitative and quantitative analysis of companies has been conducted to help clients understand the wider business environment as well as the strengths and weaknesses of key industry players. Data is qualitatively analyzed to categorize companies as pure play, category-focused, industry-focused, and diversified; it is quantitatively analyzed to categorize companies as dominant, leading, strong, tentative, and weak.
Recent Developments in the Reverse Logistics Automation Software Market
- In March, 2025, Blue Yonder introduced a cognitive returns management system that uses machine learning to identify the most efficient path for returned goods based on seasonal demand.
- In June, 2025, SAP updated its circular economy module to facilitate more transparent tracking of returned industrial components.
- In August, 2025, ReverseLogix established a partnership with European logistics firms to automate the documentation required for cross-border returns.
- In October, 2025, Oracle integrated new disposition logic into its cloud supply chain suite to help companies minimize the environmental impact of returned inventory.
Research Analyst Overview: Reverse Logistics Automation Software Market
The reverse logistics automation software market is evolving beyond simple return merchandise authorization (RMA) into a strategic enabler of the circular economy. The dominance of the cloud-based segment is a key indicator, providing the necessary agility for predictive returns forecasting and real-time returns tracking.
A sophisticated returns management system now acts as a central reverse logistics platform, essential for returns optimization and efficient inventory reintegration.
Boardroom decisions increasingly weigh the capital expenditure of deploying a new system for automated returns processing against the high operational costs and compliance risks of inaction, particularly with regulations like the EU Digital Product Passport demanding full returns lifecycle management. A fully integrated platform for product returns management enables omnichannel returns management and enhances the reverse supply chain.
It leverages AI-powered returns and returns data analytics for intelligent automated disposition, including automated grading and sorting. This move towards reverse logistics workflow automation, complete with a customer returns portal and features for boxless returns, is critical for returns value recovery and managing the return to vendor (RTV) process.
The goal is a comprehensive supply chain visibility platform that masters exception handling automation.
Dive into Technavio’s robust research methodology, blending expert interviews, extensive data synthesis, and validated models for unparalleled Reverse Logistics Automation Software Market insights. See full methodology.
| Market Scope | |
|---|---|
| Page number | 296 |
| Base year | 2025 |
| Historic period | 2020-2024 |
| Forecast period | 2026-2030 |
| Growth momentum & CAGR | Accelerate at a CAGR of 9.5% |
| Market growth 2026-2030 | USD 5636.7 million |
| Market structure | Fragmented |
| YoY growth 2025-2026(%) | 9.2% |
| Key countries | US, Canada, Mexico, Germany, UK, France, Italy, The Netherlands, Spain, China, India, Japan, South Korea, Australia, Indonesia, Brazil, Argentina, Colombia, Saudi Arabia, UAE, South Africa, Israel and Turkey |
| Competitive landscape | Leading Companies, Market Positioning of Companies, Competitive Strategies, and Industry Risks |
Reverse Logistics Automation Software Market: Key Questions Answered in This Report
-
What is the expected growth of the Reverse Logistics Automation Software Market between 2026 and 2030?
-
The Reverse Logistics Automation Software Market is expected to grow by USD 5.64 billion during 2026-2030, registering a CAGR of 9.5%. Year-over-year growth in 2026 is estimated at 9.2%%. This acceleration is shaped by rising consumer expectations and e-commerce volume growth, which is intensifying demand across multiple end-use verticals covered in the report.
-
-
What segmentation does the market report cover?
-
The report is segmented by Deployment (Cloud based, and On premises), Service (Professional services, and Managed services), End-user (Retail and e-commerce, Electronics and electrical, Automotive, Healthcare, and Others) and Geography (North America, Europe, APAC, South America, Middle East and Africa). Among these, the Cloud based segment is estimated to witness significant growth during the forecast period, driven by rising adoption across key application areas. Each segment includes detailed qualitative and quantitative analysis, along with historical data from 2020-2024 and forecasts through 2030 with year-over-year growth rates.
-
-
Which regions are analyzed in the report?
-
The report covers North America, Europe, APAC, South America and Middle East and Africa. North America is estimated to contribute 38.9% to market growth during the forecast period. Country-level analysis includes US, Canada, Mexico, Germany, UK, France, Italy, The Netherlands, Spain, China, India, Japan, South Korea, Australia, Indonesia, Brazil, Argentina, Colombia, Saudi Arabia, UAE, South Africa, Israel and Turkey, with dedicated market size tables and year-over-year growth for each.
-
-
What are the key growth drivers and market challenges?
-
The primary driver is rising consumer expectations and e-commerce volume growth, which is accelerating investment and industry demand. The main challenge is high initial investment and legacy system integration obstacles, creating operational barriers for key market participants. The report quantifies the impact of each driver and challenge across 2026 and 2030 with comparative analysis.
-
-
Who are the major players in the Reverse Logistics Automation Software Market?
-
Key vendors include 12return, AfterShip Group, Blue Yonder Group Inc., Descartes Systems Group Inc., FarEye Technologies Inc., Happy Returns, Inmar Inc., Korber AG., Loop Returns, Manhattan Associates Inc., Mara Labs Inc., Narvar Inc., Oracle Corp., Parcel Perform Pte Ltd., ReBound Returns, ReturnLogic., ReverseLogix, SAP SE, ShipHero LLC Inc. and ZigZag Global Ltd.. The report provides qualitative and quantitative analysis categorizing companies as dominant, leading, strong, tentative, and weak based on their market positioning. Company profiles include business segment analysis, SWOT assessment, key offerings, and recent strategic developments.
-
Reverse Logistics Automation Software Market Research Insights
Market dynamics are shaped by a pronounced geographical divergence in adoption drivers and regulatory pressures. While the APAC region exhibits the highest growth rate at 10.1%, driven by the sheer scale of e-commerce returns management, Europe's 8.9% growth is more influenced by stringent regulations like the Circular Electronics Act.
This legislation compels returns process optimization and sustainable returns management, making returns disposition management a compliance-driven necessity. Navigating these regional complexities is a key challenge, particularly when managing cross-border returns, which requires software that can handle varied documentation and tax protocols.
This environment necessitates a focus on improving returns efficiency not just for cost savings but for regulatory adherence and maintaining market access across different economic blocs.
We can help! Our analysts can customize this reverse logistics automation software market research report to meet your requirements.
 RIA -
RIA - 
