River Cruise Market Size 2026-2030
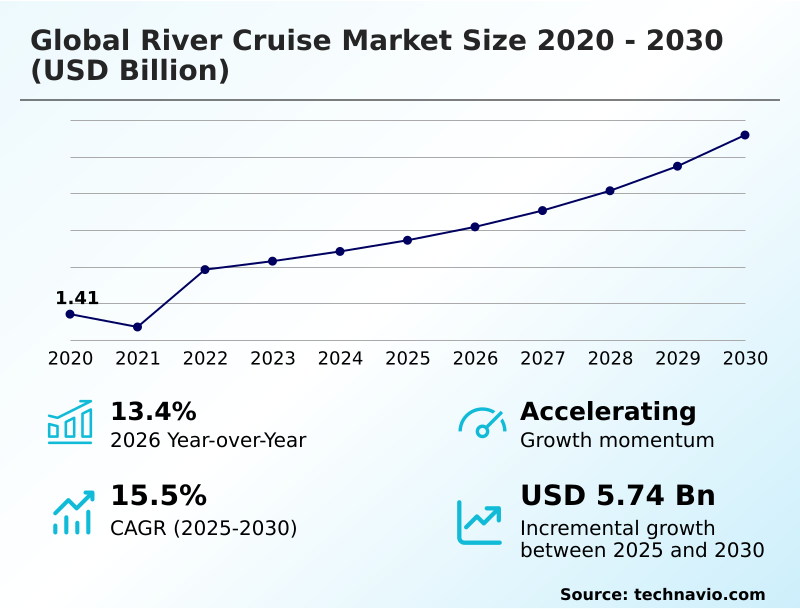
The river cruise market size is valued to increase by USD 5.74 billion, at a CAGR of 15.5% from 2025 to 2030. Rising demand for curated luxury and experiential travel will drive the river cruise market.
Major Market Trends & Insights
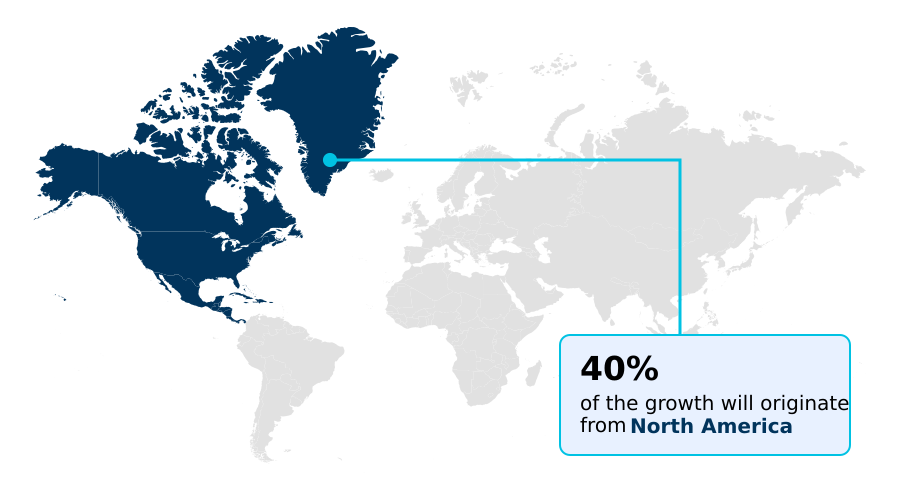
- North America dominated the market and accounted for a 40.1% growth during the forecast period.
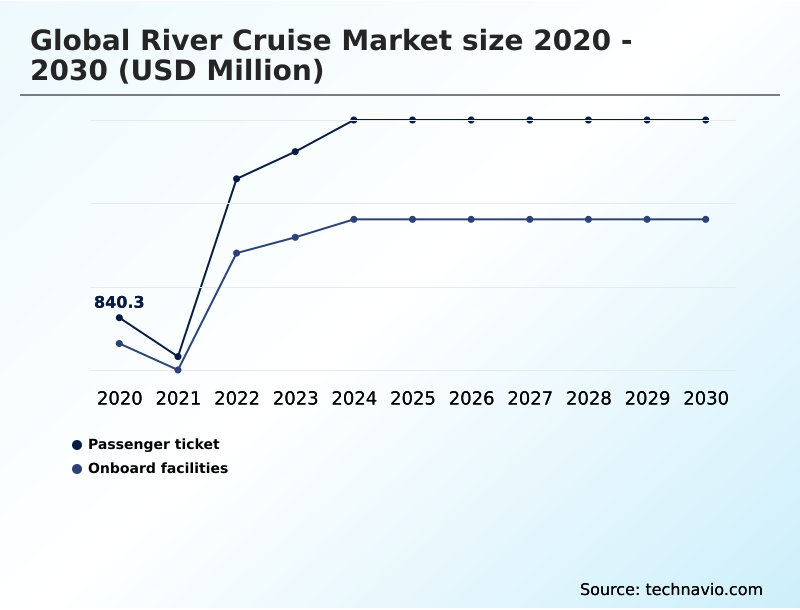
- By Type - Passenger ticket segment was valued at USD 2.94 billion in 2024
- By Age Group - 56 years and above segment accounted for the largest market revenue share in 2024
Market Size & Forecast
- Market Opportunities: USD 9.77 billion
- Market Future Opportunities: USD 5.74 billion
- CAGR from 2025 to 2030 : 15.5%
Market Summary
- The River Cruise Market is characterized by robust growth, driven by a definitive shift in consumer preference toward immersive and high-end travel. This sector is moving beyond traditional sightseeing, with operators focusing on providing curated luxury travel and unique, culturally immersive vacations.
- A significant trend is the digital transformation of the guest experience, where integrated mobile guest portals and digital concierge services are becoming standard. For instance, operators are using AI-driven weather forecasting and river-depth monitoring systems to dynamically adjust itineraries, mitigating disruptions from climate volatility and enhancing maritime safety regulations compliance.
- This improves operational efficiency and guest satisfaction, as bus transfers are minimized. The industry also faces the challenge of adhering to stringent environmental standards, pushing for investments in green engineering, such as hybrid-electric propulsion and advanced waste-to-energy systems.
- Balancing destination exclusivity with the pressures of overtourism requires strategic tourism partnerships and the development of new docking facilities in emerging regions, ensuring sustainable expansion and long-term profitability for this dynamic market.
What will be the Size of the River Cruise Market during the forecast period?
Get Key Insights on Market Forecast (PDF) Get Free Sample
How is the River Cruise Market Segmented?
The river cruise industry research report provides comprehensive data (region-wise segment analysis), with forecasts and estimates in "USD million" for the period 2026-2030, as well as historical data from 2020-2024 for the following segments.
- Type
- Passenger ticket
- Onboard facilities
- Age group
- 56 years and above
- 36-55 years
- 16-35 years
- Less than 16 years
- Product type
- International
- Domestic
- Geography
- North America
- US
- Canada
- Mexico
- Europe
- Germany
- France
- UK
- APAC
- China
- Japan
- India
- South America
- Brazil
- Argentina
- Middle East and Africa
- UAE
- Israel
- South Africa
- Rest of World (ROW)
- North America
By Type Insights
The passenger ticket segment is estimated to witness significant growth during the forecast period.
The river cruise market is segmented by type, age group, and geography, reflecting diverse consumer behaviors and operational demands. The passenger ticket segment, a primary revenue source, is evolving beyond simple fares to sophisticated, all-inclusive luxury models.
This strategy, which bundles accommodation with onboard facilities and immersive shore excursions, proves highly effective; operators leveraging data-driven personalization and predictive booking engines report premium voyages are often 86% sold out a full year in advance.
This approach caters to rising premium travel spending and the demand for experiential travel, supported by robust passenger ticket optimization.
Concurrently, strategic destination diversification into new national waterways is expanding the portfolio of curated luxury travel, driving growth across all segments.
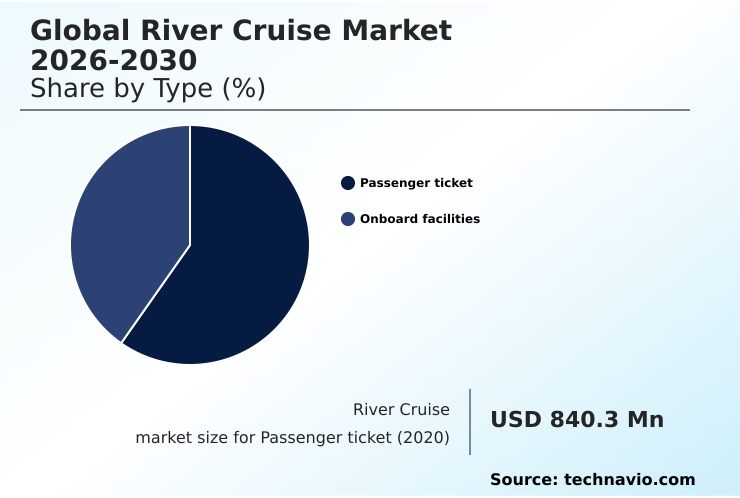
The Passenger ticket segment was valued at USD 2.94 billion in 2024 and showed a gradual increase during the forecast period.
Regional Analysis
North America is estimated to contribute 40.1% to the growth of the global market during the forecast period.Technavio’s analysts have elaborately explained the regional trends and drivers that shape the market during the forecast period.
See How River Cruise Market Demand is Rising in North America Get Free Sample
The geographic landscape of the river cruise market is expanding beyond its traditional European core, driven by strategic destination diversification.
North America commands over 40% of the incremental growth opportunity, fueled by strong domestic demand for all-suite vessels and localized travel itineraries on rivers like the Mississippi and Columbia.
In contrast, Europe, which represents 28% of new growth, is focused on fleet modernization and sustainable tourism to manage its mature and popular waterways. A key driver is the development of riverside infrastructure and new docking facilities in emerging regions.
The APAC region is a significant growth frontier, with governments actively promoting national waterways to foster cross-border travel and alleviate pressure on established routes. This global expansion is creating new opportunities for expedition-style voyages and integrated land-water itineraries.
Market Dynamics
Our researchers analyzed the data with 2025 as the base year, along with the key drivers, trends, and challenges. A holistic analysis of drivers will help companies refine their marketing strategies to gain a competitive advantage.
- Strategic planning in the global river cruise market 2026-2030 requires a multi-faceted approach, balancing technological adoption with sustainable practices. The successful implementation of river cruise market decarbonization strategies is now a primary competitive differentiator, forcing investment in green engineering for new river vessels.
- Simultaneously, the impact of AI on river cruise personalization is reshaping the guest experience, moving beyond basic service to a fully integrated digital transformation in guest cruise experience. This is part of broader river cruise fleet modernization technologies.
- On the operational front, managing overtourism in river cruise destinations has become a critical challenge, compelling operators to focus on expanding river cruise routes to new regions, a move dependent on river cruise infrastructure investment impact. To navigate climate change adaptation for river cruises, companies are investing in shallow-draft vessel design for rivers.
- Thematic cruise itinerary development strategies are also key to attracting new demographics, including a focus on multigenerational travel on luxury river cruises and integrating local culture in cruise excursions. Meanwhile, onboard facilities innovation for river cruises continues to evolve, as does the passenger ticket pricing model evolution.
- Finally, ensuring strict regulatory compliance for inland waterways and robust guest safety protocols on river cruises remains fundamental, with companies leveraging data analytics for river cruise operations to enhance safety and efficiency, achieving up to 50% fewer disruptions compared to fleets without such systems.
What are the key market drivers leading to the rise in the adoption of River Cruise Industry?
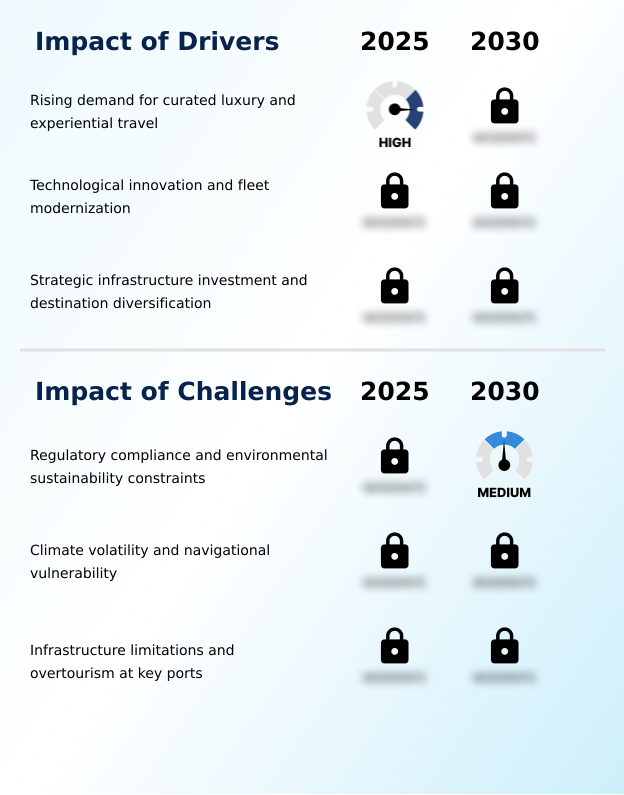
- The rising demand for curated luxury and experiential travel is a key driver propelling the growth of the river cruise market.
- Market growth is fundamentally driven by the escalating demand for curated luxury travel and deeply immersive cultural experiences. Modern travelers are seeking experiential tourism that goes beyond standard packages, favoring the all-inclusive luxury and intimacy of river cruises.
- This has led to a surge in bookings for vessels featuring twin-balcony staterooms and all-suite vessels, with some premium itineraries selling over 85% of capacity more than a year in advance.
- This robust demand is supported by strategic infrastructure investment, as the development of new docking facilities and the opening of new national waterways enable greater destination diversification.
- This synergy allows operators to offer unique, hyper-local experiences and cater to the growth in premium travel spending, solidifying the market's strong upward trajectory.
What are the market trends shaping the River Cruise Industry?
- The accelerated adoption of decarbonized propulsion systems and green engineering principles is a primary upcoming market trend. This shift is reshaping vessel design and operational standards across the industry.
- Key market trends are centered on the convergence of sustainability and technology. The accelerated adoption of decarbonized propulsion and green engineering is reshaping fleet design, with new vessels achieving up to a 20% improvement in fuel efficiency through hybrid-electric propulsion and advanced hull geometries. This commitment to sustainable tourism extends to onboard operations, with comprehensive waste-to-energy systems becoming standard.
- Simultaneously, the digital transformation is enhancing guest personalization through AI-driven cabin climate controls and high-speed satellite connectivity. This focus on operational efficiency and an eco-conscious traveler experience is evident in the development of experiential itineraries and wellness-centric travel options, where technology enables a more seamless and customized journey. The integration of these trends is critical for maintaining a competitive edge.
What challenges does the River Cruise Industry face during its growth?
- Adhering to regulatory compliance and addressing environmental sustainability constraints poses a key challenge to the river cruise industry's growth.
- The industry faces significant operational and regulatory challenges that necessitate continuous innovation. Climate volatility requires investment in advanced technological solutions; for instance, implementing shallow-draft capabilities and AI-driven weather forecasting can reduce itinerary disruptions from low water levels, which can affect up to 10% of sailings in dry seasons.
- Concurrently, evolving environmental standards and regional tourism policies are driving the costly transition toward cleaner fuels. The high capital expenditure for retrofitting fleets with battery-electric hybrids or hydrogen fuel cells is a major hurdle.
- Failure to comply with these maritime safety regulations not only risks financial penalties but also damages brand reputation, making adherence to stringent hospitality standards and forming strategic tourism partnerships essential for long-term viability and securing exclusive docking arrangements.
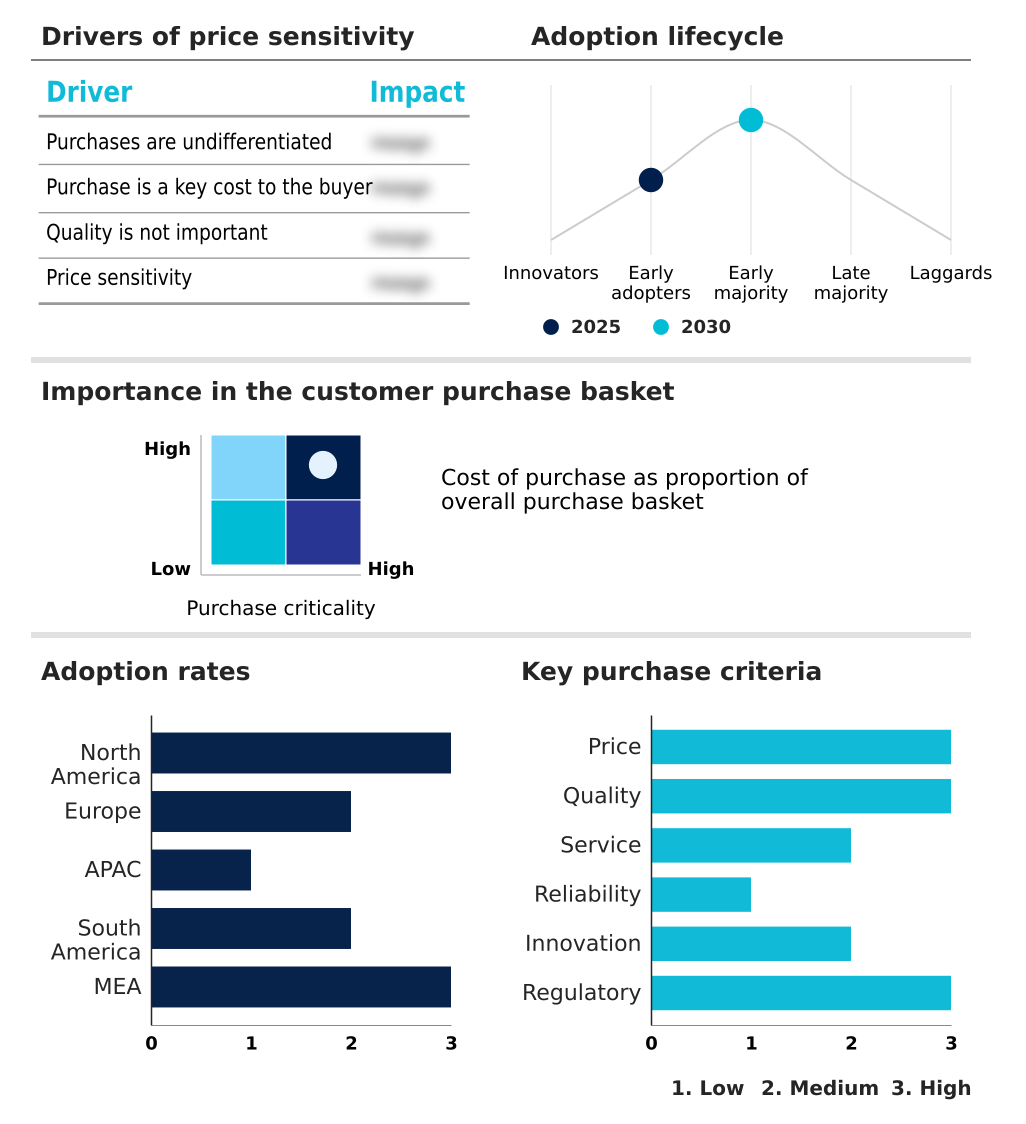
Exclusive Technavio Analysis on Customer Landscape
The river cruise market forecasting report includes the adoption lifecycle of the market, covering from the innovator’s stage to the laggard’s stage. It focuses on adoption rates in different regions based on penetration. Furthermore, the river cruise market report also includes key purchase criteria and drivers of price sensitivity to help companies evaluate and develop their market growth analysis strategies.
Customer Landscape of River Cruise Industry
Competitive Landscape
Companies are implementing various strategies, such as strategic alliances, river cruise market forecast, partnerships, mergers and acquisitions, geographical expansion, and product/service launches, to enhance their presence in the industry.
A ROSA Flussschiff GmbH - Analysis indicates a focus on premium river cruises and wellness experiences, leveraging destination diversification to capture the experiential travel segment on major European waterways.
The industry research and growth report includes detailed analyses of the competitive landscape of the market and information about key companies, including:
- A ROSA Flussschiff GmbH
- Abercrombie and Kent
- Amadeus River Cruises
- AmaWaterways
- American Cruise Lines
- Aqua Expeditions
- Australian Pacific Touring
- Avalon Waterways
- Belmond Ltd.
- CroisiEurope
- Grand Circle LLC
- nicko cruises Schiffsreisen GmbH
- Pandaw Cruises Ltd.
- Riverside Luxury Cruises
- Riviera Travel
- SAGA PLC
- Scenic Luxury Cruises Tours
- Tauck Inc.
- Uniworld Boutique River Cruise
- VIVA Cruises
Qualitative and quantitative analysis of companies has been conducted to help clients understand the wider business environment as well as the strengths and weaknesses of key industry players. Data is qualitatively analyzed to categorize companies as pure play, category-focused, industry-focused, and diversified; it is quantitatively analyzed to categorize companies as dominant, leading, strong, tentative, and weak.
Recent Development and News in River cruise market
- In May 2025, Emerald Cruises announced the launch of the Emerald Astra, a vessel featuring a suite of digital enhancements, including an integrated mobile guest portal and smart-room controls to streamline passenger service.
- In May 2025, American Cruise Lines successfully concluded the inaugural season for its contemporary riverboat, the American Encore, which is specifically designed for navigating the Chesapeake Bay and Hudson River, diversifying domestic US itineraries.
- In March 2025, Uniworld Boutique River Cruises responded to the demand for high-intent cultural travel by announcing new art-themed itineraries for its European fleet, focusing on immersive historical and artistic experiences.
- In October 2024, AmaWaterways confirmed its strategic expansion into South America, detailing plans for the 2026 launch of the AmaMagdalena on Colombia's Magdalena River, capitalizing on new government initiatives promoting river tourism.
Dive into Technavio’s robust research methodology, blending expert interviews, extensive data synthesis, and validated models for unparalleled River Cruise Market insights. See full methodology.
| Market Scope | |
|---|---|
| Page number | 290 |
| Base year | 2025 |
| Historic period | 2020-2024 |
| Forecast period | 2026-2030 |
| Growth momentum & CAGR | Accelerate at a CAGR of 15.5% |
| Market growth 2026-2030 | USD 5735.9 million |
| Market structure | Fragmented |
| YoY growth 2025-2026(%) | 13.4% |
| Key countries | US, Canada, Mexico, Germany, France, UK, Italy, Spain, The Netherlands, China, Japan, India, Australia, Singapore, South Korea, Brazil, Argentina, Chile, UAE, Israel, Egypt, South Africa and Saudi Arabia |
| Competitive landscape | Leading Companies, Market Positioning of Companies, Competitive Strategies, and Industry Risks |
Research Analyst Overview
- The river cruise market is navigating a significant transformation, driven by the dual imperatives of technological advancement and environmental responsibility. Boardroom-level decisions are increasingly centered on capital-intensive fleet renewals, prioritizing decarbonized propulsion, and green engineering. This strategic pivot is not merely about compliance but is a direct response to a market that values sustainability.
- The integration of smart-ship technologies, including AI-driven cabin climate controls and integrated mobile guest portals, is becoming a standard for all-inclusive luxury. These systems facilitate unprecedented data-driven personalization and enhance the experiential travel that consumers now demand. For instance, vessels employing advanced hull geometries and shallow-draft capabilities report up to 30% fewer itinerary disruptions from fluctuating water levels.
- Investments in hydrogen fuel cells and battery-electric hybrids, though substantial, are viewed as essential for future-proofing operations against stricter regulations. This landscape demands a focus on vessel innovation, from twin-balcony staterooms to all-suite vessels, ensuring that onboard amenities align with the expectations for curated luxury travel and destination exclusivity.
What are the Key Data Covered in this River Cruise Market Research and Growth Report?
-
What is the expected growth of the River Cruise Market between 2026 and 2030?
-
USD 5.74 billion, at a CAGR of 15.5%
-
-
What segmentation does the market report cover?
-
The report is segmented by Type (Passenger ticket, and Onboard facilities), Age Group (56 years and above, 36-55 years, 16-35 years, and Less than 16 years), Product Type (International, and Domestic) and Geography (North America, Europe, APAC, South America, Middle East and Africa)
-
-
Which regions are analyzed in the report?
-
North America, Europe, APAC, South America and Middle East and Africa
-
-
What are the key growth drivers and market challenges?
-
Rising demand for curated luxury and experiential travel, Regulatory compliance and environmental sustainability constraints
-
-
Who are the major players in the River Cruise Market?
-
A ROSA Flussschiff GmbH, Abercrombie and Kent, Amadeus River Cruises, AmaWaterways, American Cruise Lines, Aqua Expeditions, Australian Pacific Touring, Avalon Waterways, Belmond Ltd., CroisiEurope, Grand Circle LLC, nicko cruises Schiffsreisen GmbH, Pandaw Cruises Ltd., Riverside Luxury Cruises, Riviera Travel, SAGA PLC, Scenic Luxury Cruises Tours, Tauck Inc., Uniworld Boutique River Cruise and VIVA Cruises
-
Market Research Insights
- Market dynamics are shaped by the convergence of consumer demand for luxury travel and technological vessel innovation. Operators are leveraging digital transformation to enhance operational efficiency and personalize the guest journey. For instance, the adoption of data-driven personalization has been shown to increase repeat bookings by up to 15%.
- This focus on hospitality standards is critical as travelers seek more than just a destination. Concurrently, environmental stewardship is a powerful force, with fleets incorporating sustainable tourism practices achieving better brand positioning among eco-conscious travelers. Vessels equipped with hybrid-electric propulsion can reduce fuel consumption by over 20%, meeting stricter environmental standards while enhancing the passenger experience through silent sailing.
- This interplay between high-end service, technological advancement, and sustainability defines the competitive landscape.
We can help! Our analysts can customize this river cruise market research report to meet your requirements.
 RIA -
RIA - 
