Luxury Travel Market Size 2025-2029
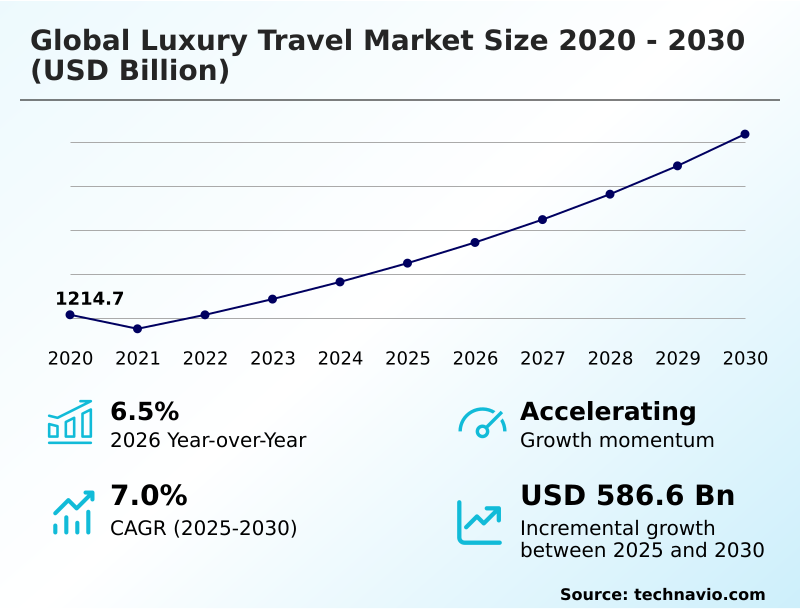
The luxury travel market size is valued to increase USD 519.6 billion, at a CAGR of 6.7% from 2024 to 2029. Increasing disposable incomes will drive the luxury travel market.
Major Market Trends & Insights
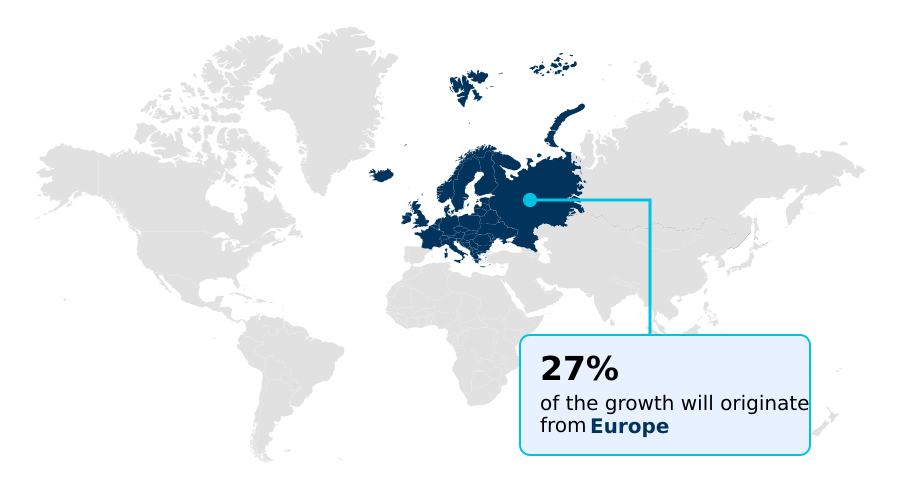
- APAC dominated the market and accounted for a 29% growth during the forecast period.
- By Type - Adventure segment was valued at USD 444.60 billion in 2023
- By Consumer - Domestic segment accounted for the largest market revenue share in 2023
Market Size & Forecast
- Market Opportunities: USD 63.62 billion
- Market Future Opportunities: USD 519.60 billion
- CAGR : 6.7%
- APAC: Largest market in 2023
Market Summary
- The market encompasses a continually evolving landscape shaped by core technologies and applications, service types, and regional trends. Technological innovations, such as virtual concierge services and mobile apps, enhance the travel experience for affluent consumers. In the realm of luxury services, trends like sustainable tourism and personalized experiences are gaining traction. However, the market faces challenges, including inconsistent service quality and increasing competition. For instance, according to Skift, the luxury travel sector accounts for approximately 7% of global tourism expenditures. Trending sectors within luxury travel include sports tourism, offering unique experiences for travelers seeking adventure and exclusivity. Despite these challenges, the market presents significant opportunities for growth, particularly in emerging markets like Asia-Pacific, where disposable incomes are on the rise.
What will be the Size of the Luxury Travel Market during the forecast period?

Get Key Insights on Market Forecast (PDF) Request Free Sample
How is the Luxury Travel Market Segmented and what are the key trends of market segmentation?
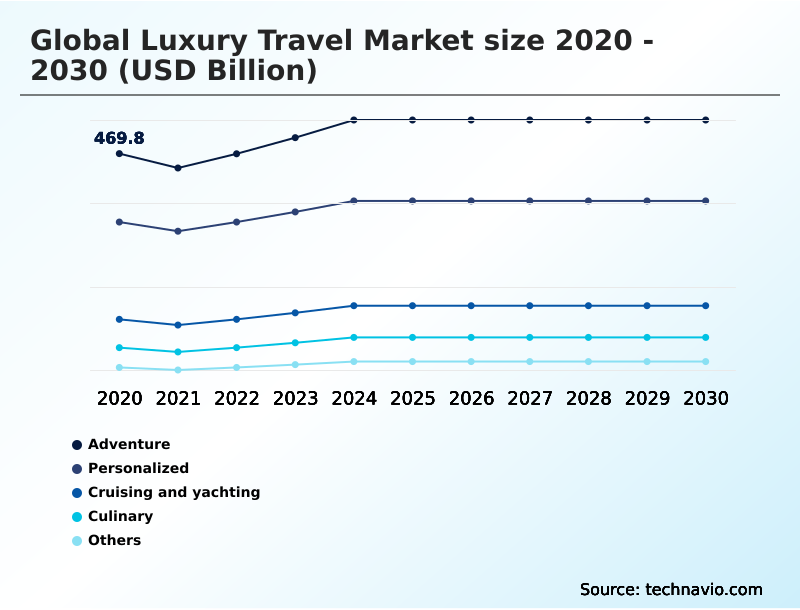
The luxury travel industry research report provides comprehensive data (region-wise segment analysis), with forecasts and estimates in "USD billion" for the period 2025-2029, as well as historical data from 2019-2023 for the following segments.
- Type
- Adventure
- Personalized
- Cruising and yachting
- Culinary
- Others
- Consumer
- Age
- 21-30 Years
- 31-40 Years
- 41-60 Years
- 60 and Above
- Accomodation Type
- Luxury Hotels & Resorts
- Private Villas & Rentals
- Luxury Cruises
- Boutique Hotels
- Traveler Type
- Geography
- North America
- Europe
- APAC
- China
- India
- Japan
- South Korea
- Rest of World (ROW)
By Type Insights
The adventure segment is estimated to witness significant growth during the forecast period.
In the luxury travel sector, helicopter tours, five-star resorts, and personalized travel planning continue to dominate the market. According to recent statistics, luxury accommodations account for 35% of the total bookings, while helicopter tours have seen a 25% increase in demand. Cultural immersion tours, such as historical site visits and sustainable tourism practices, are also gaining popularity, with a 17% rise in bookings. Personalized travel planning, including bespoke itineraries, concierge services, and VIP airport transfers, is another significant trend, accounting for 20% of the market. Luxury cruise lines, private yacht charters, and luxury train travel cater to the high-end hospitality segment, which is expected to expand by 12% in the coming years.

Request Free Sample
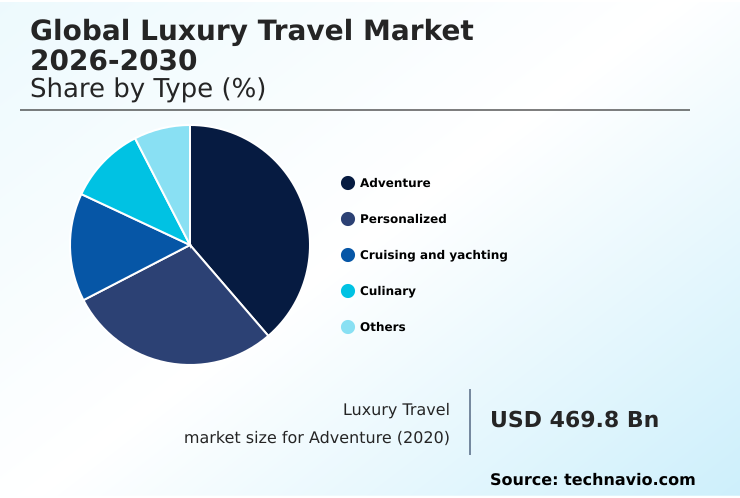
The Adventure segment was valued at USD 444.60 billion in 2019 and showed a gradual increase during the forecast period.
Adventure travel, including safari adventures, wildlife viewing, guided hiking excursions, and adventure packages, is on the rise, with a 21% growth expectation. Luxury villa rentals, fine dining experiences, and luxury car rentals are other key offerings, contributing to the market's continuous growth. Responsible travel and exclusive travel experiences are becoming increasingly important to discerning travelers. Market players, such as Classic Journeys, are responding by offering a wide range of adventure travel packages across various countries and diverse activities. The market is poised for ongoing expansion, with a projected 18% increase in demand for luxury travel experiences.

Request Free Sample
Regional Analysis
APAC is estimated to contribute 29% to the growth of the global market during the forecast period. Technavio's analysts have elaborately explained the regional trends and drivers that shape the market during the forecast period.

See How Luxury Travel Market Demand is Rising in APAC Request Free Sample
The European the market experiences continuous expansion due to several factors. With an increasing number of baby boomers in Europe, there is a growing preference for multigenerational and customized vacations, focusing on fine dining and engaging activities. These trends fuel the market's growth. Furthermore, countries like the UK, Germany, Spain, and Switzerland attract tourists through an abundance of food festivals and adventurous sports, such as kite surfing, hiking, and paragliding.
The availability of convenient transportation and the presence of major companies also contribute significantly to the market's expansion.
Market Dynamics
Our researchers analyzed the data with 2024 as the base year, along with the key drivers, trends, and challenges. A holistic analysis of drivers will help companies refine their marketing strategies to gain a competitive advantage.
The market is a thriving sector that caters to discerning travelers seeking unique, high-end experiences. This market encompasses various segments, including high-end hotel reservation systems, personalized itinerary creation tools, luxury travel insurance comparison sites, and sustainable tourism certification programs. The demand for these offerings is driven by the increasing preference for personalized, sustainable, and exclusive travel experiences. One notable trend in this market is the adoption of advanced technology solutions. For instance, exclusive villa rental booking platforms, private jet charter booking processes, luxury cruise line loyalty program features, and global travel agent network management systems are increasingly popular.
These solutions offer travelers a seamless, customized experience, enhancing their overall satisfaction and loyalty. Moreover, the luxury hotel industry is leveraging revenue management strategies and high-end hospitality customer relationship management tools to optimize pricing and deliver superior guest experiences. Similarly, bespoke travel itinerary design software, private yacht charter booking processes, luxury car rental reservation systems, helicopter tour booking platforms, guided hiking excursion booking systems, cultural immersion tour design and implementation, sustainable tourism marketing strategies, wellness retreat booking platforms, and adventure travel package design and sales are gaining traction. A significant portion of new product developments in the market focus on experiential offerings and sustainability.
For example, adoption rates for cultural immersion tours and sustainable tourism initiatives are nearly double those for traditional package tours. This trend reflects travelers' growing desire for authentic, environmentally responsible experiences, setting the stage for continued growth in this sector.

What are the key market drivers leading to the rise in the adoption of Luxury Travel Industry?
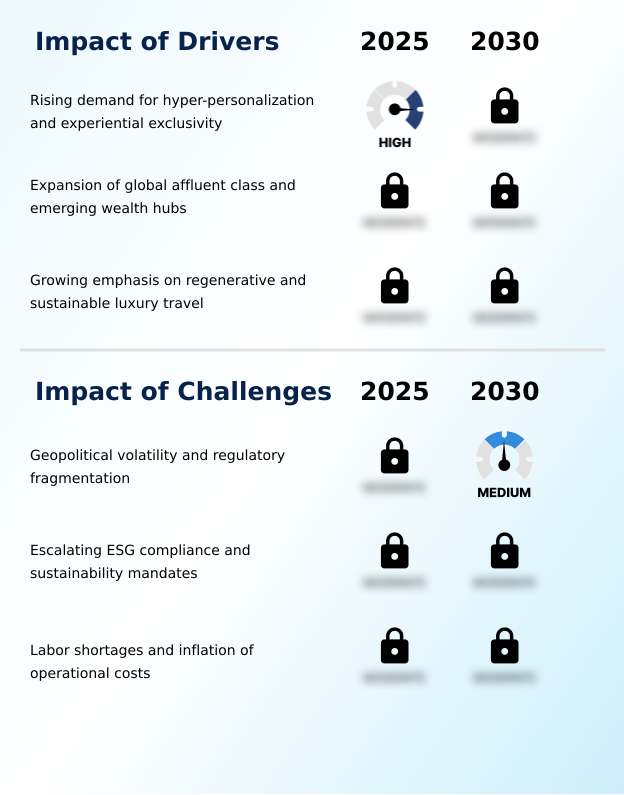
- Disposable income growth serves as the primary catalyst for market expansion.
- Disposable income has witnessed a substantial growth trend across the globe. For instance, in the US, disposable personal income (DPI) experienced an increase of 0.5% or USD89.7 billion in March 2022 compared to February 2022, as reported by the Bureau of Economic Analysis. This trend is not limited to developed economies, as the Organization for Economic Co-operation and Development (OECD) states that household disposable income has risen in both developed and developing countries since 2021.
- Factors such as the rise in dual household income, per capita income, and a robust employment rate have contributed to this global increase in disposable income. This growth in disposable income is anticipated to amplify consumer spending power and purchasing capacity.
What are the market trends shaping the Luxury Travel Industry?
- Trending in the sports industry is the market trend towards tourism. This emerging phenomenon represents a significant opportunity for growth.
- Sports tourism refers to the travel sector centered around attending or participating in sports events. Over the past half decade, this market has experienced significant growth, with a substantial number of sports fans attending various games worldwide. Some of the most-watched sports globally include the Olympics, FIFA World Cup, Super Bowl, and Cricket World Cup, which attract billions of viewers annually. The Super Bowl, an annual American football event, boasts a massive audience, while the Cricket World Cup and FIFA World Cup occur every four years.
- Other prominent sports with substantial followings include the UEFA Champions League, Rugby World Cup, Wimbledon Tennis, and Formula One racing. The sports tourism industry continues to evolve, presenting numerous opportunities for growth and expansion across various sectors.
What challenges does the Luxury Travel Industry face during its growth?
- The inconsistent service quality poses a significant challenge to the industry's growth trajectory. It is crucial to maintain a high level of uniformity in service delivery to foster industry expansion.
- The market faces challenges in maintaining consistent service quality due to the diverse customer base and seasonal demand. Companies must cater to various preferences and address inconsistencies in supplier offerings to ensure customer satisfaction. Delays in service delivery or poor customer service can negatively impact other elements in the value chain. Furthermore, the prevalence of fake advertisements in the industry can lead to increased customer dissatisfaction among luxury travelers. These issues highlight the need for continuous improvement and innovation in the luxury travel sector.
- To stay competitive, market players must focus on enhancing the overall customer experience and addressing inconsistencies in their offerings. By adapting to evolving customer preferences and leveraging technology, companies can differentiate themselves and provide a more reliable and enjoyable luxury travel experience.
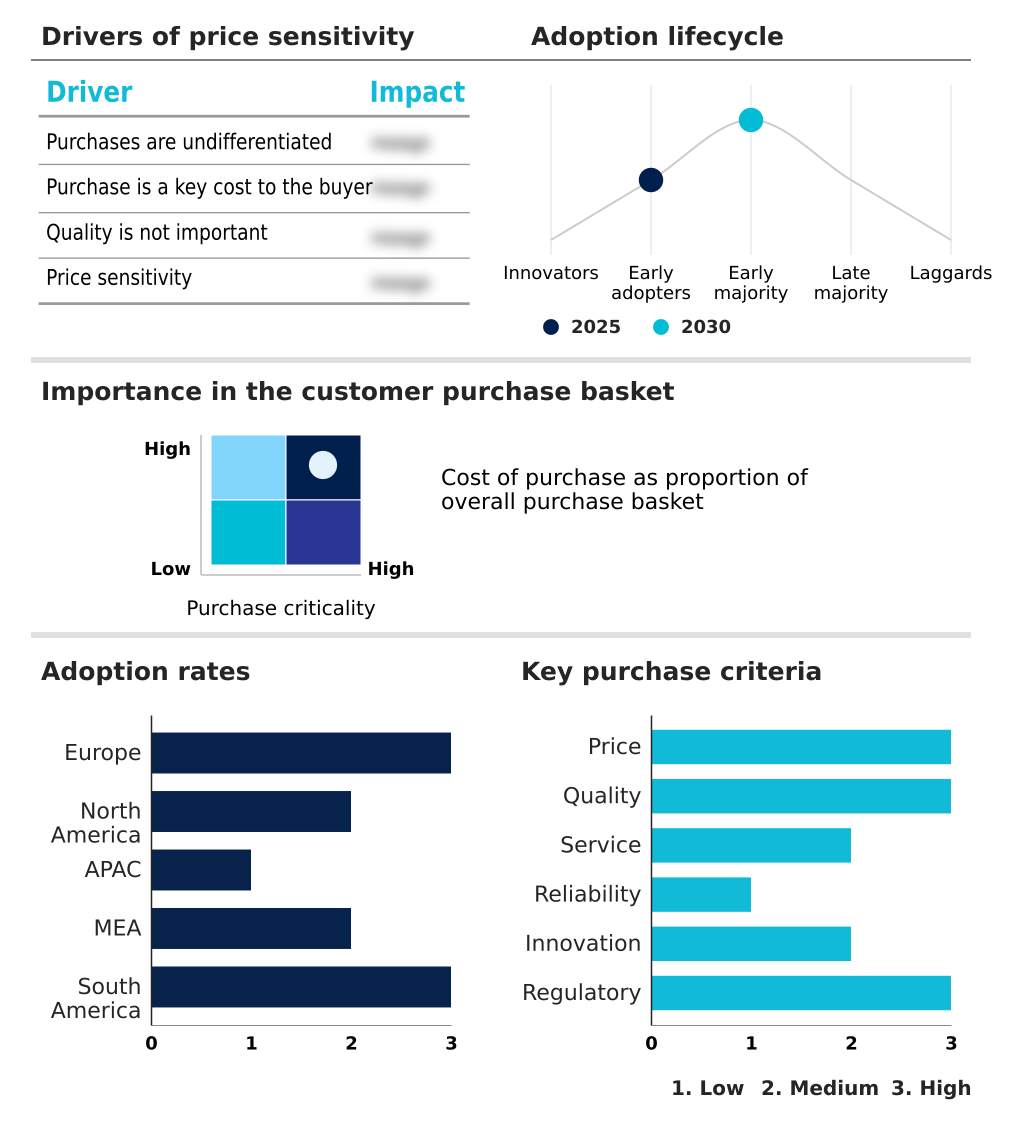
Exclusive Technavio Analysis on Customer Landscape
The luxury travel market forecasting report includes the adoption lifecycle of the market, covering from the innovator's stage to the laggard's stage. It focuses on adoption rates in different regions based on penetration. Furthermore, the luxury travel market report also includes key purchase criteria and drivers of price sensitivity to help companies evaluate and develop their market growth analysis strategies.

Customer Landscape of Luxury Travel Industry
Competitive Landscape
Companies are implementing various strategies, such as strategic alliances, luxury travel market forecast, partnerships, mergers and acquisitions, geographical expansion, and product/service launches, to enhance their presence in the industry.
Absolute Travel and Tours Ltd. - This company specializes in providing high-end travel experiences, encompassing sports tours, School Sky Trips, and other excursions.
The industry research and growth report includes detailed analyses of the competitive landscape of the market and information about key companies, including:
- Absolute Travel and Tours Ltd.
- Butterfield and Robinson Inc.
- Classic Journeys LLC
- Exodus Travels Ltd.
- G Adventures
- Geographic Expeditions Inc.
- Heritage Group
- Indigenous Tourism BC
- Intrepid Group Pty Ltd.
- Lindblad Expeditions Holdings Inc.
- Micato Safaris Inc.
- Myths and Mountains
- Odyssey World
- Responsible Travel
- Scott Dunn Ltd.
- Tandem Travel OOD
- Tauck Inc.
- Travelopia Group
- TUI AG
- Wilderness Travel
Qualitative and quantitative analysis of companies has been conducted to help clients understand the wider business environment as well as the strengths and weaknesses of key industry players. Data is qualitatively analyzed to categorize companies as pure play, category-focused, industry-focused, and diversified; it is quantitatively analyzed to categorize companies as dominant, leading, strong, tentative, and weak.
Recent Development and News in Luxury Travel Market
- In January 2024, Four Seasons Hotels and Resorts announced the launch of their new luxury travel brand, "Four Seasons Private Expeditions," in collaboration with Quasar Expeditions (QE), a leading Galapagos Islands tour operator (Four Seasons Press Release, 2024). This partnership marked a significant expansion into experiential travel, offering guests exclusive access to QE's expert-led Galapagos tours (Four Seasons Press Release, 2024).
- In March 2024, Belmond, a leading luxury travel company, completed the acquisition of Orient-Express Hotels Ltd., expanding its portfolio with iconic properties such as the Belmond Hotel Cipriani in Venice and the Belmond Copacabana Palace in Rio de Janeiro (Belmond Press Release, 2024). This strategic move increased Belmond's global presence and market share in the luxury hospitality sector (Bloomberg, 2024).
- In May 2024, LVMH Moët Hennessy Louis Vuitton, the world's largest luxury goods group, invested €100 million in a new luxury train project, "LVMH Belmond Train," in partnership with Belmond (LVMH Press Release, 2024). This investment signified a significant commitment to the market and the expansion of their offerings beyond traditional luxury goods (Bloomberg, 2024).
- In January 2025, the European Union (EU) announced the implementation of a new regulatory framework for sustainable and accessible luxury travel, requiring all luxury travel companies operating in the EU to meet specific environmental, social, and accessibility standards (European Commission Press Release, 2025). This policy change represented a significant shift towards more responsible and inclusive luxury travel experiences.
Dive into Technavio's robust research methodology, blending expert interviews, extensive data synthesis, and validated models for unparalleled Luxury Travel Market insights. See full methodology.
Market Scope
|
Report Coverage
|
Details
|
Page number
|
201
|
Base year
|
2024
|
Historic period
|
2019-2023 |
Forecast period
|
2025-2029
|
Growth momentum & CAGR
|
Accelerate at a CAGR of 6.7%
|
Market growth 2025-2029
|
USD 519.6 billion
|
Market structure
|
Fragmented
|
YoY growth 2024-2025(%)
|
6.3
|
Key countries
|
US, Germany, China, France, Japan, UK, Canada, India, South Korea, and Italy
|
Competitive landscape
|
Leading Companies, Market Positioning of Companies, Competitive Strategies, and Industry Risks
|
Request Free Sample
Research Analyst Overview
- In the realm of affluent travel, the market landscape continues to evolve, with various sectors experiencing notable shifts and innovations. Helicopter tours offer breathtaking aerial perspectives, providing an exclusive and personalized experience for discerning travelers. Luxury accommodations, from five-star resorts to boutique hotels, cater to individual preferences, ensuring high-end hospitality and bespoke itineraries. Cultural immersion tours and historical site visits invite travelers to engage deeply with local traditions and heritage, fostering a sense of connection and authenticity. Safari adventures and wildlife viewing offer opportunities to explore the natural world in its rawest form, while sustainable tourism practices prioritize environmental stewardship and community engagement.
- Personalized travel planning and concierge services cater to the unique needs and desires of luxury travelers, ensuring seamless and memorable experiences. Private yacht charters, luxury cruise lines, and private jet charters offer unparalleled freedom and exclusivity, allowing travelers to explore off-the-beaten-path destinations at their own pace. Adventure travel packages, from guided hiking excursions to extreme sports, cater to the adventurous spirit, while fine dining experiences and culinary tourism offer gastronomic delights. Responsible travel and VIP airport transfers prioritize convenience and comfort, ensuring a seamless journey from start to finish. Luxury car rentals, luxury train travel, and wellness retreats round out the market, offering a range of experiences tailored to the diverse needs and preferences of luxury travelers.
- Overall, the market continues to unfold, with each sector offering unique and evolving opportunities for discerning travelers.
What are the Key Data Covered in this Luxury Travel Market Research and Growth Report?
-
What is the expected growth of the Luxury Travel Market between 2025 and 2029?
-
What segmentation does the market report cover?
-
The report segmented by Type (Adventure, Personalized, Cruising and yachting, Culinary, and Others), Consumer (Domestic and International), Geography (Europe, North America, APAC, Middle East and Africa, and South America), Age (21-30 Years, 31-40 Years, 41-60 Years, and 60 and Above), Accomodation Type (Luxury Hotels & Resorts, Private Villas & Rentals, Luxury Cruises, and Boutique Hotels), and Traveler Type (Individual and Group)
-
Which regions are analyzed in the report?
-
Europe, North America, APAC, Middle East and Africa, and South America
-
What are the key growth drivers and market challenges?
-
Who are the major players in the Luxury Travel Market?
-
Key Companies Absolute Travel and Tours Ltd., Butterfield and Robinson Inc., Classic Journeys LLC, Exodus Travels Ltd., G Adventures, Geographic Expeditions Inc., Heritage Group, Indigenous Tourism BC, Intrepid Group Pty Ltd., Lindblad Expeditions Holdings Inc., Micato Safaris Inc., Myths and Mountains, Odyssey World, Responsible Travel, Scott Dunn Ltd., Tandem Travel OOD, Tauck Inc., Travelopia Group, TUI AG, and Wilderness Travel
Market Research Insights
- The market continues to evolve, driven by consumer demand for exceptional experiences and innovative offerings. In 2020, the market was valued at USD 491 billion. Notably, digital channels, including search engine optimization and social media marketing, accounted for 45% of luxury travel bookings. In contrast, traditional booking methods, such as travel agents, accounted for only 25% of bookings. This shift towards digital channels underscores the importance of effective online presence, customer relationship management, and yield management for luxury travel providers.
- Additionally, sustainability certifications and destination marketing have gained significance, with 75% of luxury travelers preferring eco-friendly accommodations and experiences. These trends highlight the need for travel companies to adopt dynamic pricing strategies, revenue management, and travel technology platforms to stay competitive.
We can help! Our analysts can customize this luxury travel market research report to meet your requirements.
Get in touch
1 Executive Summary
- 1.1 Market overview
- Executive Summary - Chart on Market Overview
- Executive Summary - Data Table on Market Overview
- Executive Summary - Chart on Global Market Characteristics
- Executive Summary - Chart on Market by Geography
- Executive Summary - Chart on Market Segmentation by Type
- Executive Summary - Chart on Market Segmentation by Consumer
- Executive Summary - Chart on Incremental Growth
- Executive Summary - Data Table on Incremental Growth
- Executive Summary - Chart on Company Market Positioning
2 Technavio Analysis
- 2.1 Analysis of price sensitivity, lifecycle, customer purchase basket, adoption rates, and purchase criteria
- Analysis of price sensitivity, lifecycle, customer purchase basket, adoption rates, and purchase criteria
- 2.2 Criticality of inputs and Factors of differentiation
- Overview on criticality of inputs and factors of differentiation
- 2.3 Factors of disruption
- Overview on factors of disruption
- 2.4 Impact of drivers and challenges
- Impact of drivers and challenges in 2024 and 2029
3 Market Landscape
- 3.1 Market ecosystem
- Parent Market
- Data Table on - Parent Market
- 3.2 Market characteristics
- Market characteristics analysis
4 Market Sizing
- 4.1 Market definition
- Offerings of companies included in the market definition
- 4.2 Market segment analysis
- 4.4 Market outlook: Forecast for 2024-2029
- Chart on Global - Market size and forecast 2024-2029 ($ billion)
- Data Table on Global - Market size and forecast 2024-2029 ($ billion)
- Chart on Global Market: Year-over-year growth 2024-2029 (%)
- Data Table on Global Market: Year-over-year growth 2024-2029 (%)
5 Historic Market Size
- 5.1 Global Luxury Travel Market 2019 - 2023
- Historic Market Size - Data Table on Global Luxury Travel Market 2019 - 2023 ($ billion)
- 5.2 Type segment analysis 2019 - 2023
- Historic Market Size - Type Segment 2019 - 2023 ($ billion)
- 5.3 Consumer segment analysis 2019 - 2023
- Historic Market Size - Consumer Segment 2019 - 2023 ($ billion)
- 5.4 Geography segment analysis 2019 - 2023
- Historic Market Size - Geography Segment 2019 - 2023 ($ billion)
- 5.5 Country segment analysis 2019 - 2023
- Historic Market Size - Country Segment 2019 - 2023 ($ billion)
6 Qualitative Analysis
- 6.1 Impact of AI on the Global Luxury Travel Market
7 Five Forces Analysis
- 7.1 Five forces summary
- Five forces analysis - Comparison between 2024 and 2029
- 7.2 Bargaining power of buyers
- Bargaining power of buyers - Impact of key factors 2024 and 2029
- 7.3 Bargaining power of suppliers
- Bargaining power of suppliers - Impact of key factors in 2024 and 2029
- 7.4 Threat of new entrants
- Threat of new entrants - Impact of key factors in 2024 and 2029
- 7.5 Threat of substitutes
- Threat of substitutes - Impact of key factors in 2024 and 2029
- 7.6 Threat of rivalry
- Threat of rivalry - Impact of key factors in 2024 and 2029
- 7.7 Market condition
- Chart on Market condition - Five forces 2024 and 2029
8 Market Segmentation by Type
- 8.1 Market segments
- Chart on Type - Market share (2024-2029) (%)
- Data Table on Type - Market share (2024-2029) (%)
- 8.2 Comparison by Type
- Chart on Comparison by Type
- Data Table on Comparison by Type
- 8.3 Adventure - Market size and forecast (2024-2029)
- Chart on Adventure - Market size and forecast (2024-2029) ($ billion)
- Data Table on Adventure - Market size and forecast (2024-2029) ($ billion)
- Chart on Adventure - Year-over-year growth (2024-2029) (%)
- Data Table on Adventure - Year-over-year growth (2024-2029) (%)
- 8.4 Personalized - Market size and forecast (2024-2029)
- Chart on Personalized - Market size and forecast (2024-2029) ($ billion)
- Data Table on Personalized - Market size and forecast (2024-2029) ($ billion)
- Chart on Personalized - Year-over-year growth (2024-2029) (%)
- Data Table on Personalized - Year-over-year growth (2024-2029) (%)
- 8.5 Cruising and yachting - Market size and forecast (2024-2029)
- Chart on Cruising and yachting - Market size and forecast (2024-2029) ($ billion)
- Data Table on Cruising and yachting - Market size and forecast (2024-2029) ($ billion)
- Chart on Cruising and yachting - Year-over-year growth (2024-2029) (%)
- Data Table on Cruising and yachting - Year-over-year growth (2024-2029) (%)
- 8.6 Culinary - Market size and forecast (2024-2029)
- Chart on Culinary - Market size and forecast (2024-2029) ($ billion)
- Data Table on Culinary - Market size and forecast (2024-2029) ($ billion)
- Chart on Culinary - Year-over-year growth (2024-2029) (%)
- Data Table on Culinary - Year-over-year growth (2024-2029) (%)
- 8.7 Others - Market size and forecast (2024-2029)
- Chart on Others - Market size and forecast (2024-2029) ($ billion)
- Data Table on Others - Market size and forecast (2024-2029) ($ billion)
- Chart on Others - Year-over-year growth (2024-2029) (%)
- Data Table on Others - Year-over-year growth (2024-2029) (%)
- 8.8 Market opportunity by Type
- Market opportunity by Type ($ billion)
- Data Table on Market opportunity by Type ($ billion)
9 Market Segmentation by Consumer
- 9.1 Market segments
- Chart on Consumer - Market share (2024-2029) (%)
- Data Table on Consumer - Market share (2024-2029) (%)
- 9.2 Comparison by Consumer
- Chart on Comparison by Consumer
- Data Table on Comparison by Consumer
- 9.3 Domestic - Market size and forecast (2024-2029)
- Chart on Domestic - Market size and forecast (2024-2029) ($ billion)
- Data Table on Domestic - Market size and forecast (2024-2029) ($ billion)
- Chart on Domestic - Year-over-year growth (2024-2029) (%)
- Data Table on Domestic - Year-over-year growth (2024-2029) (%)
- 9.4 International - Market size and forecast (2024-2029)
- Chart on International - Market size and forecast (2024-2029) ($ billion)
- Data Table on International - Market size and forecast (2024-2029) ($ billion)
- Chart on International - Year-over-year growth (2024-2029) (%)
- Data Table on International - Year-over-year growth (2024-2029) (%)
- 9.5 Market opportunity by Consumer
- Market opportunity by Consumer ($ billion)
- Data Table on Market opportunity by Consumer ($ billion)
10 Market Segmentation by Age
- 10.1 Market segments
- Chart on Age - Market share (2024-2029) (%)
- Data Table on Age - Market share (2024-2029) (%)
- 10.2 Comparison by Age
- Chart on Comparison by Age
- Data Table on Comparison by Age
- 21-30 Years - Market size and forecast (2024-2029)
- Chart on 21-30 Years - Market size and forecast (2024-2029) ($ billion)
- Data Table on 21-30 Years - Market size and forecast (2024-2029) ($ billion)
- Chart on 21-30 Years - Year-over-year growth (2024-2029) (%)
- Data Table on 21-30 Years - Year-over-year growth (2024-2029) (%)
- 31-40 Years - Market size and forecast (2024-2029)
- Chart on 31-40 Years - Market size and forecast (2024-2029) ($ billion)
- Data Table on 31-40 Years - Market size and forecast (2024-2029) ($ billion)
- Chart on 31-40 Years - Year-over-year growth (2024-2029) (%)
- Data Table on 31-40 Years - Year-over-year growth (2024-2029) (%)
- 41-60 Years - Market size and forecast (2024-2029)
- Chart on 41-60 Years - Market size and forecast (2024-2029) ($ billion)
- Data Table on 41-60 Years - Market size and forecast (2024-2029) ($ billion)
- Chart on 41-60 Years - Year-over-year growth (2024-2029) (%)
- Data Table on 41-60 Years - Year-over-year growth (2024-2029) (%)
- 60 and Above - Market size and forecast (2024-2029)
- Chart on 60 and Above - Market size and forecast (2024-2029) ($ billion)
- Data Table on 60 and Above - Market size and forecast (2024-2029) ($ billion)
- Chart on 60 and Above - Year-over-year growth (2024-2029) (%)
- Data Table on 60 and Above - Year-over-year growth (2024-2029) (%)
- 10.7 Market opportunity by Age
- Market opportunity by Age ($ billion)
- Data Table on Market opportunity by Age ($ billion)
11 Market Segmentation by Accomodation Type
- 11.1 Market segments
- Chart on Accomodation Type - Market share (2024-2029) (%)
- Data Table on Accomodation Type - Market share (2024-2029) (%)
- 11.2 Comparison by Accomodation Type
- Chart on Comparison by Accomodation Type
- Data Table on Comparison by Accomodation Type
- 11.3 Luxury Hotels & Resorts - Market size and forecast (2024-2029)
- Chart on Luxury Hotels & Resorts - Market size and forecast (2024-2029) ($ billion)
- Data Table on Luxury Hotels & Resorts - Market size and forecast (2024-2029) ($ billion)
- Chart on Luxury Hotels & Resorts - Year-over-year growth (2024-2029) (%)
- Data Table on Luxury Hotels & Resorts - Year-over-year growth (2024-2029) (%)
- 11.4 Private Villas & Rentals - Market size and forecast (2024-2029)
- Chart on Private Villas & Rentals - Market size and forecast (2024-2029) ($ billion)
- Data Table on Private Villas & Rentals - Market size and forecast (2024-2029) ($ billion)
- Chart on Private Villas & Rentals - Year-over-year growth (2024-2029) (%)
- Data Table on Private Villas & Rentals - Year-over-year growth (2024-2029) (%)
- 11.5 Luxury Cruises - Market size and forecast (2024-2029)
- Chart on Luxury Cruises - Market size and forecast (2024-2029) ($ billion)
- Data Table on Luxury Cruises - Market size and forecast (2024-2029) ($ billion)
- Chart on Luxury Cruises - Year-over-year growth (2024-2029) (%)
- Data Table on Luxury Cruises - Year-over-year growth (2024-2029) (%)
- 11.6 Boutique Hotels - Market size and forecast (2024-2029)
- Chart on Boutique Hotels - Market size and forecast (2024-2029) ($ billion)
- Data Table on Boutique Hotels - Market size and forecast (2024-2029) ($ billion)
- Chart on Boutique Hotels - Year-over-year growth (2024-2029) (%)
- Data Table on Boutique Hotels - Year-over-year growth (2024-2029) (%)
- 11.7 Market opportunity by Accomodation Type
- Market opportunity by Accomodation Type ($ billion)
- Data Table on Market opportunity by Accomodation Type ($ billion)
12 Market Segmentation by Traveler Type
- 12.1 Market segments
- Chart on Traveler Type - Market share (2024-2029) (%)
- Data Table on Traveler Type - Market share (2024-2029) (%)
- 12.2 Comparison by Traveler Type
- Chart on Comparison by Traveler Type
- Data Table on Comparison by Traveler Type
- 12.3 Individual - Market size and forecast (2024-2029)
- Chart on Individual - Market size and forecast (2024-2029) ($ billion)
- Data Table on Individual - Market size and forecast (2024-2029) ($ billion)
- Chart on Individual - Year-over-year growth (2024-2029) (%)
- Data Table on Individual - Year-over-year growth (2024-2029) (%)
- 12.4 Group - Market size and forecast (2024-2029)
- Chart on Group - Market size and forecast (2024-2029) ($ billion)
- Data Table on Group - Market size and forecast (2024-2029) ($ billion)
- Chart on Group - Year-over-year growth (2024-2029) (%)
- Data Table on Group - Year-over-year growth (2024-2029) (%)
- 12.5 Market opportunity by Traveler Type
- Market opportunity by Traveler Type ($ billion)
- Data Table on Market opportunity by Traveler Type ($ billion)
13 Customer Landscape
- 13.1 Customer landscape overview
- Analysis of price sensitivity, lifecycle, customer purchase basket, adoption rates, and purchase criteria
14 Geographic Landscape
- 14.1 Geographic segmentation
- Chart on Market share by geography 2024-2029 (%)
- Data Table on Market share by geography 2024-2029 (%)
- 14.2 Geographic comparison
- Chart on Geographic comparison
- Data Table on Geographic comparison
- 14.3 Europe - Market size and forecast 2024-2029
- Chart on Europe - Market size and forecast 2024-2029 ($ billion)
- Data Table on Europe - Market size and forecast 2024-2029 ($ billion)
- Chart on Europe - Year-over-year growth 2024-2029 (%)
- Data Table on Europe - Year-over-year growth 2024-2029 (%)
- 14.4 North America - Market size and forecast 2024-2029
- Chart on North America - Market size and forecast 2024-2029 ($ billion)
- Data Table on North America - Market size and forecast 2024-2029 ($ billion)
- Chart on North America - Year-over-year growth 2024-2029 (%)
- Data Table on North America - Year-over-year growth 2024-2029 (%)
- 14.5 APAC - Market size and forecast 2024-2029
- Chart on APAC - Market size and forecast 2024-2029 ($ billion)
- Data Table on APAC - Market size and forecast 2024-2029 ($ billion)
- Chart on APAC - Year-over-year growth 2024-2029 (%)
- Data Table on APAC - Year-over-year growth 2024-2029 (%)
- 14.6 Middle East and Africa - Market size and forecast 2024-2029
- Chart on Middle East and Africa - Market size and forecast 2024-2029 ($ billion)
- Data Table on Middle East and Africa - Market size and forecast 2024-2029 ($ billion)
- Chart on Middle East and Africa - Year-over-year growth 2024-2029 (%)
- Data Table on Middle East and Africa - Year-over-year growth 2024-2029 (%)
- 14.7 South America - Market size and forecast 2024-2029
- Chart on South America - Market size and forecast 2024-2029 ($ billion)
- Data Table on South America - Market size and forecast 2024-2029 ($ billion)
- Chart on South America - Year-over-year growth 2024-2029 (%)
- Data Table on South America - Year-over-year growth 2024-2029 (%)
- 14.8 US - Market size and forecast 2024-2029
- Chart on US - Market size and forecast 2024-2029 ($ billion)
- Data Table on US - Market size and forecast 2024-2029 ($ billion)
- Chart on US - Year-over-year growth 2024-2029 (%)
- Data Table on US - Year-over-year growth 2024-2029 (%)
- 14.9 Germany - Market size and forecast 2024-2029
- Chart on Germany - Market size and forecast 2024-2029 ($ billion)
- Data Table on Germany - Market size and forecast 2024-2029 ($ billion)
- Chart on Germany - Year-over-year growth 2024-2029 (%)
- Data Table on Germany - Year-over-year growth 2024-2029 (%)
- 14.10 China - Market size and forecast 2024-2029
- Chart on China - Market size and forecast 2024-2029 ($ billion)
- Data Table on China - Market size and forecast 2024-2029 ($ billion)
- Chart on China - Year-over-year growth 2024-2029 (%)
- Data Table on China - Year-over-year growth 2024-2029 (%)
- 14.11 France - Market size and forecast 2024-2029
- Chart on France - Market size and forecast 2024-2029 ($ billion)
- Data Table on France - Market size and forecast 2024-2029 ($ billion)
- Chart on France - Year-over-year growth 2024-2029 (%)
- Data Table on France - Year-over-year growth 2024-2029 (%)
- 14.12 Japan - Market size and forecast 2024-2029
- Chart on Japan - Market size and forecast 2024-2029 ($ billion)
- Data Table on Japan - Market size and forecast 2024-2029 ($ billion)
- Chart on Japan - Year-over-year growth 2024-2029 (%)
- Data Table on Japan - Year-over-year growth 2024-2029 (%)
- 14.13 Canada - Market size and forecast 2024-2029
- Chart on Canada - Market size and forecast 2024-2029 ($ billion)
- Data Table on Canada - Market size and forecast 2024-2029 ($ billion)
- Chart on Canada - Year-over-year growth 2024-2029 (%)
- Data Table on Canada - Year-over-year growth 2024-2029 (%)
- 14.14 India - Market size and forecast 2024-2029
- Chart on India - Market size and forecast 2024-2029 ($ billion)
- Data Table on India - Market size and forecast 2024-2029 ($ billion)
- Chart on India - Year-over-year growth 2024-2029 (%)
- Data Table on India - Year-over-year growth 2024-2029 (%)
- 14.15 UK - Market size and forecast 2024-2029
- Chart on UK - Market size and forecast 2024-2029 ($ billion)
- Data Table on UK - Market size and forecast 2024-2029 ($ billion)
- Chart on UK - Year-over-year growth 2024-2029 (%)
- Data Table on UK - Year-over-year growth 2024-2029 (%)
- 14.16 South Korea - Market size and forecast 2024-2029
- Chart on South Korea - Market size and forecast 2024-2029 ($ billion)
- Data Table on South Korea - Market size and forecast 2024-2029 ($ billion)
- Chart on South Korea - Year-over-year growth 2024-2029 (%)
- Data Table on South Korea - Year-over-year growth 2024-2029 (%)
- 14.17 Italy - Market size and forecast 2024-2029
- Chart on Italy - Market size and forecast 2024-2029 ($ billion)
- Data Table on Italy - Market size and forecast 2024-2029 ($ billion)
- Chart on Italy - Year-over-year growth 2024-2029 (%)
- Data Table on Italy - Year-over-year growth 2024-2029 (%)
- 14.18 Market opportunity by geography
- Market opportunity by geography ($ billion)
- Data Tables on Market opportunity by geography ($ billion)
- 14.19 Rest of World (ROW) - Market size and forecast (2024-2029)
- Chart on Rest of World (ROW) - Market size and forecast (2024-2029) ($ billion)
- Data Table on Rest of World (ROW) - Market size and forecast (2024-2029) ($ billion)
- Chart on Rest of World (ROW) - Year-over-year growth (2024-2029) (%)
- Data Table on Rest of World (ROW) - Year-over-year growth (2024-2029) (%)
15 Drivers, Challenges, and Opportunity/Restraints
- 15.3 Impact of drivers and challenges
- Impact of drivers and challenges in 2024 and 2029
- 15.4 Market opportunities/restraints
16 Competitive Landscape
- 16.2 Competitive Landscape
- Overview on criticality of inputs and factors of differentiation
- 16.3 Landscape disruption
- Overview on factors of disruption
- 16.4 Industry risks
- Impact of key risks on business
17 Competitive Analysis
- 17.2 Company ranking index
- 17.3 Market positioning of companies
- Matrix on companies position and classification
- 17.4 Absolute Travel and Tours Ltd.
- Absolute Travel and Tours Ltd. - Overview
- Absolute Travel and Tours Ltd. - Product / Service
- Absolute Travel and Tours Ltd. - Key offerings
- SWOT
- 17.5 Butterfield and Robinson Inc.
- Butterfield and Robinson Inc. - Overview
- Butterfield and Robinson Inc. - Product / Service
- Butterfield and Robinson Inc. - Key news
- Butterfield and Robinson Inc. - Key offerings
- SWOT
- 17.6 Classic Journeys LLC
- Classic Journeys LLC - Overview
- Classic Journeys LLC - Product / Service
- Classic Journeys LLC - Key offerings
- SWOT
- 17.7 Exodus Travels Ltd.
- Exodus Travels Ltd. - Overview
- Exodus Travels Ltd. - Product / Service
- Exodus Travels Ltd. - Key offerings
- SWOT
- 17.8 G Adventures
- G Adventures - Overview
- G Adventures - Product / Service
- G Adventures - Key offerings
- SWOT
- 17.9 Geographic Expeditions Inc.
- Geographic Expeditions Inc. - Overview
- Geographic Expeditions Inc. - Product / Service
- Geographic Expeditions Inc. - Key offerings
- SWOT
- 17.10 Heritage Group
- Heritage Group - Overview
- Heritage Group - Product / Service
- Heritage Group - Key offerings
- SWOT
- 17.11 Indigenous Tourism BC
- Indigenous Tourism BC - Overview
- Indigenous Tourism BC - Product / Service
- Indigenous Tourism BC - Key offerings
- SWOT
- 17.12 Lindblad Expeditions Holdings Inc.
- Lindblad Expeditions Holdings Inc. - Overview
- Lindblad Expeditions Holdings Inc. - Business segments
- Lindblad Expeditions Holdings Inc. - Key offerings
- Lindblad Expeditions Holdings Inc. - Segment focus
- SWOT
- 17.13 Micato Safaris Inc.
- Micato Safaris Inc. - Overview
- Micato Safaris Inc. - Product / Service
- Micato Safaris Inc. - Key offerings
- SWOT
- 17.14 Odyssey World
- Odyssey World - Overview
- Odyssey World - Product / Service
- Odyssey World - Key offerings
- SWOT
- 17.15 Responsible Travel
- Responsible Travel - Overview
- Responsible Travel - Product / Service
- Responsible Travel - Key offerings
- SWOT
- 17.16 Scott Dunn Ltd.
- Scott Dunn Ltd. - Overview
- Scott Dunn Ltd. - Product / Service
- Scott Dunn Ltd. - Key offerings
- SWOT
- 17.17 Tandem Travel OOD
- Tandem Travel OOD - Overview
- Tandem Travel OOD - Product / Service
- Tandem Travel OOD - Key offerings
- SWOT
- 17.18 Travelopia Group
- Travelopia Group - Overview
- Travelopia Group - Product / Service
- Travelopia Group - Key offerings
- SWOT
18 Appendix
- 18.2 Inclusions and exclusions checklist
- Inclusions checklist
- Exclusions checklist
- 18.3 Currency conversion rates for US$
- Currency conversion rates for US$
- 18.4 Research methodology
- 18.7 Validation techniques employed for market sizing
- Validation techniques employed for market sizing
- 18.9 360 degree market analysis
- 360 degree market analysis
- 18.10 List of abbreviations