Robo Advisory Services Market Analysis North America, Europe, APAC, South America, Middle East and Africa - US, Japan, India, UK, Germany - Size and Forecast 2024-2028

Robo Advisory Services Market Analysis North America, Europe, APAC, South America, Middle East and Africa - US, Japan, India, UK, Germany - Size and Forecast 2024-2028

Published: Feb 2024 155 Pages SKU: IRTNTR77531

Market Overview at a Glance

$1306.37 B
Market Opportunity
9.16%
CAGR
8.45
YoY growth 2023-2024(%)

Robo Advisory Services Market Size 2024-2028

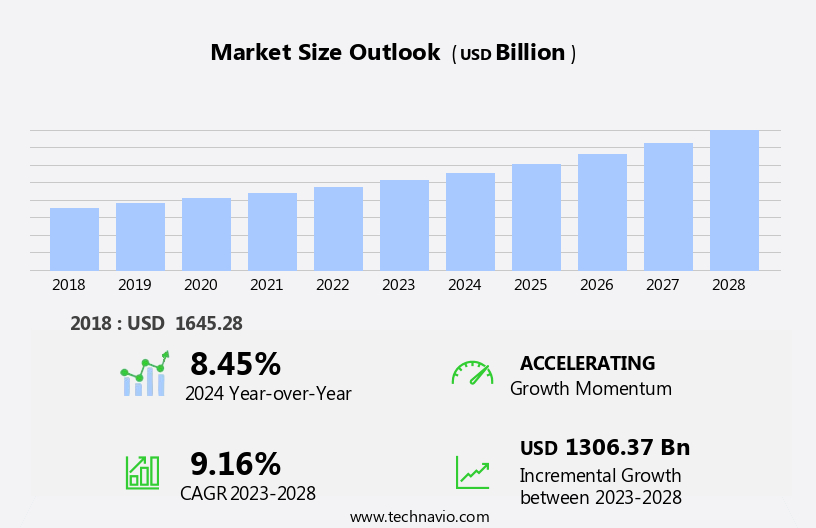
The robo advisory services market size is forecast to increase by USD 1306.37 billion, at a CAGR of 9.16% between 2023 and 2028.

  • The market is witnessing significant growth, driven by the increasing adoption of artificial intelligence (AI) and machine learning (ML) technologies. These advanced technologies enable robo advisors to offer personalized investment recommendations based on an individual's financial goals, risk tolerance, and investment history. Furthermore, the emergence of hybrid robo advisory models, which combine human financial advisors with AI algorithms, is gaining popularity as it offers the benefits of both human expertise and automated investment management. However, the market faces challenges related to data security and privacy concerns. With the increasing use of digital platforms for managing financial information, ensuring the security and privacy of sensitive customer data is paramount.
  • Breaches can lead to significant reputational damage and financial losses for both the robo advisory firms and their clients. As such, companies must invest in robust cybersecurity measures and adhere to stringent data protection regulations to mitigate these risks and build trust with their customers.

What will be the Size of the Robo Advisory Services Market during the forecast period?

Robo Advisory Services Market Size

Explore in-depth regional segment analysis with market size data - historical 2018-2022 and forecasts 2024-2028 - in the full report.  
Request Free Sample

The robo-advisory services market continues to evolve, integrating advanced financial technologies to cater to diverse client needs. Robo-advisors seamlessly blend financial education, insurance planning, account balances, risk-adjusted return, and robo-advisor platforms to deliver personalized financial advice. These platforms utilize data analytics to understand clients' financial goals, tax-loss harvesting, investment strategies, historical data, and risk tolerance, enabling automated investment and tax optimization. Robo-advisors prioritize user experience (UX) and user interface (UI) design, ensuring seamless account opening and funding. API integration facilitates data exchange with external sources, enhancing investment research and goal setting. Compliance regulations are meticulously addressed, ensuring privacy regulations and security protocols protect clients' data.

Performance tracking, portfolio optimization, and rebalancing are essential components of robo-advisory services. Fees and charges, including transaction fees and machine learning algorithms, are transparently disclosed. Retirement projections, estate planning, and goal setting are integrated into the robo-advisor platform, providing clients with comprehensive financial planning. Robo-advisors employ artificial intelligence (AI) and machine learning to offer investment recommendations and asset allocation, optimizing investment performance and risk management based on clients' investment horizon and reporting capabilities. ETF selection and retirement planning are also available, addressing various investment goals and tax implications. Customer support and financial education are integral to robo-advisory services, ensuring clients are well-informed about their investments and financial planning.

Digital wealth management offers a convenient and accessible solution for managing accounts and tracking investment performance. Overall, the robo-advisory services market is a dynamic and evolving landscape, continually adapting to meet the changing needs of clients.

How is this Robo Advisory Services Industry segmented?

The robo advisory services industry research report provides comprehensive data (region-wise segment analysis), with forecasts and estimates in "USD billion" for the period 2024-2028, as well as historical data from 2018-2022 for the following segments.

  • End-user
    • High net worth individuals
    • Retail investors
  • Service Type
    • Portfolio management
    • Tax optimization
    • Retirement planning
    • Others
  • Geography
    • North America
      • US
    • Europe
      • Germany
      • UK
    • APAC
      • India
      • Japan
    • Rest of World (ROW)

By End-user Insights

The high net worth individuals segment is estimated to witness significant growth during the forecast period.

High net worth individuals (HNWIs) increasingly turn to robo advisory services for cost-effective, personalized investment management solutions. These platforms offer lower fees than traditional wealth management firms, providing HNWIs with 24/7 access to tools and services. Robo advisors employ user-friendly interfaces and seamless API integrations for account funding, enabling HNWIs to easily open and manage accounts. Financial technology (fintech) and data analytics power these platforms, allowing for customized investment strategies based on individual financial goals, risk tolerance, and preferences. HNWIs value transparency and control, which robo advisors deliver through clear reporting and analytics. Tax optimization, portfolio rebalancing, and automated investment management further appeal to HNWIs, who can monitor their investments closely and make informed decisions.

Robo advisors prioritize security protocols, data security, and regulatory compliance to ensure client privacy and peace of mind. Personalized financial advice, investment research, and goal setting are also available, offering HNWIs a comprehensive digital wealth management experience. Account management, financial education, and insurance planning are additional features that cater to HNWIs' complex financial needs. By leveraging artificial intelligence (AI), machine learning, and algorithmic trading, robo advisors optimize risk-adjusted returns and manage investment performance, asset allocation, mutual fund selection, and ETF selection. Robo advisors also offer tax implications analysis and financial news updates, keeping HNWIs informed and in control of their investments.

Robo Advisory Services Market Size

Request Free Sample

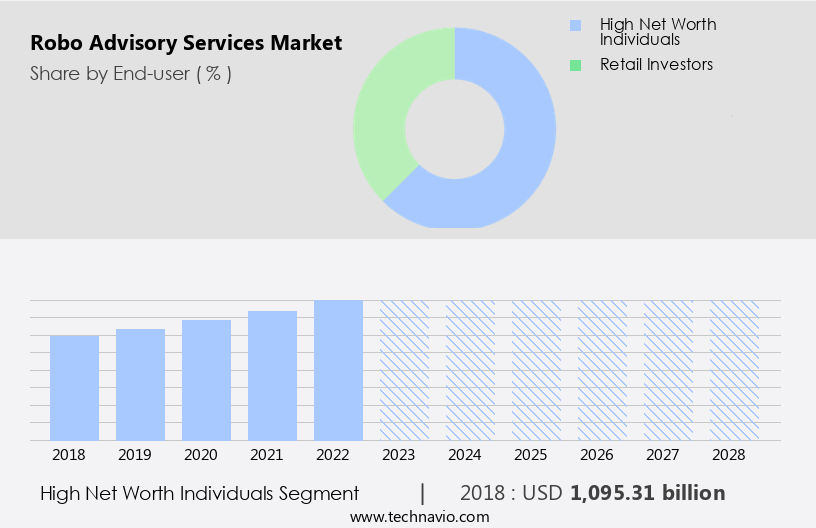
The High net worth individuals segment was valued at USD 1095.31 billion in 2018 and showed a gradual increase during the forecast period.

Regional Analysis

North America is estimated to contribute 37% to the growth of the global market during the forecast period. Technavio’s analysts have elaborately explained the regional trends and drivers that shape the market during the forecast period.

Robo Advisory Services Market Share by Geography

 Request Free Sample

In North America, the demand for digital financial services is on the rise, fueled by tech-savvy consumers seeking convenient and accessible investment solutions. Robo advisory services, with their lower fees compared to traditional financial advisors, are particularly attractive to cost-conscious investors in this region. As fees become an increasingly significant consideration for investors, the affordability of robo advisors is driving their adoption. A significant portion of the North American population, the millennial demographic, is turning to robo advisory services for their investment needs. These digital natives value the convenience, transparency, and low costs offered by robo advisors, making them a major growth factor for the regional market.

The popularity of passive investing strategies, such as index funds and exchange-traded funds (ETFs), is also contributing to the growing adoption of robo advisory services. User experience and interface design play crucial roles in attracting and retaining clients, with API integration and account funding streamlining the onboarding process. Financial technology (fintech) and data analytics enable personalized financial advice, investment recommendations, and automated investment management. Tax optimization, risk tolerance assessment, and algorithmic trading are essential features for many investors, while privacy regulations ensure data security. Compliance regulations, performance analysis, and reporting capabilities are also important considerations for both robo advisors and their clients.

Digital wealth management, portfolio optimization, and risk management are key services offered by robo advisors, with performance tracking and asset allocation crucial for investment success. Transaction fees, machine learning, and artificial intelligence are essential components of robo advisory platforms, providing investors with real-time insights and automated investment strategies. Investment goals, estate planning, goal setting, and financial education are also essential services offered by robo advisors, catering to the diverse needs of their client base. In summary, the North American robo advisory market is experiencing significant growth, driven by the tech-savvy demographic, the affordability of robo advisors, and the popularity of passive investing strategies.

Robo advisors offer a range of services, from investment goals and financial education to portfolio optimization and risk management, making them an attractive alternative to traditional financial advisors.

Market Dynamics

Our researchers analyzed the data with 2023 as the base year, along with the key drivers, trends, and challenges. A holistic analysis of drivers will help companies refine their marketing strategies to gain a competitive advantage.

What are the key market drivers leading to the rise in the adoption of Robo Advisory Services Industry?

  • The increasing implementation of Artificial Intelligence (AI) and Machine Learning (ML) technologies in robo-advisory services is the primary catalyst fueling market growth. 
  • Robo advisory services have gained significant traction in the financial technology (fintech) sector due to the integration of advanced AI and ML algorithms. These technologies enable platforms to analyze vast amounts of financial data, identifying trends, patterns, and correlations for more informed investment decisions. By leveraging historical data and predictive models, robo advisors can anticipate market shifts and optimize portfolio returns, while minimizing risks. Client segmentation is a crucial aspect of robo advisory services, ensuring a user-centric approach. User experience (UX) and user interface (UI) design play a pivotal role in attracting and retaining clients. API integration streamlines account funding and investment strategies, enhancing the overall user experience.
  • Data analytics is a key component of robo advisory services, allowing for personalized financial goals and investment recommendations based on individual risk tolerance and preferences. Tax-loss harvesting is another valuable feature, optimizing tax liabilities and maximizing returns. Account opening and investment strategies are automated, making the process efficient and convenient for clients. In conclusion, the robo advisory market continues to evolve, driven by technological advancements and evolving client needs. AI and ML algorithms are at the forefront of this evolution, enabling personalized investment recommendations, improved performance, and enhanced user experience.

What are the market trends shaping the Robo Advisory Services Industry?

  • The growing adoption of hybrid robo-advisory models represents a significant market trend in the financial industry. Hybrid models combine the benefits of automated investment management with the personalized advice of human financial professionals.
  • Robo advisory services have gained popularity due to their automated investment management and personalized financial recommendations. Hybrid models, in particular, combine the advantages of technology-driven automation and human guidance. These models cater to investors' unique requirements, considering their risk tolerance, investment goals, and preferences. The use of algorithmic trading, artificial intelligence (AI), and machine learning enables efficient portfolio management and tax optimization. However, investors may still need human advisors for complex financial decisions, such as retirement projections and estate planning. Hybrid robo advisory services offer both automated investment and human expertise, ensuring a harmonious balance between technology and personalized guidance.
  • Security protocols and privacy regulations are essential considerations, ensuring investors' data remains secure. Transaction fees and charges are also crucial factors, with varying models offering different fee structures. Overall, hybrid robo advisory services provide comprehensive wealth management solutions, addressing investors' multifaceted financial needs while offering access to human advisors for emotional support and complex financial matters.

What challenges does the Robo Advisory Services Industry face during its growth?

  • The growth of the robo-advisory industry is significantly impacted by concerns surrounding data security and privacy, which represent a major challenge that must be addressed to maintain client trust and ensure regulatory compliance. 
  • Robo advisory services have gained popularity in the digital wealth management industry due to their convenience and affordability. These platforms offer personalized financial advice, portfolio optimization, performance tracking, risk-adjusted return, and investment options based on individual financial goals and risk tolerance. However, with the increasing adoption of robo advisory services comes the heightened risk of cybersecurity threats. Robo advisory platforms store vast amounts of sensitive financial information and personal data, making them attractive targets for cybercriminals. Data breaches, hacking attempts, malware attacks, and phishing scams pose significant risks to both robo advisory firms and their clients. Unauthorized access to client information, including account credentials, financial transactions, and personal details, can lead to financial fraud, identity theft, and reputational damage.
  • Moreover, robo advisory firms often rely on third-party service providers to support their operations. Ensuring data security and compliance regulations are met by these providers is crucial to mitigate risks and protect client information. Performance analysis and compliance regulations are essential components of robo advisory services, ensuring that clients receive optimal investment returns while adhering to regulatory requirements. In conclusion, while robo advisory services offer numerous benefits, including financial education, insurance planning, account management, and performance analysis, it is essential to prioritize data security and compliance regulations to protect client information and maintain trust in the industry.

Exclusive Customer Landscape

The robo advisory services market forecasting report includes the adoption lifecycle of the market, covering from the innovator’s stage to the laggard’s stage. It focuses on adoption rates in different regions based on penetration. Furthermore, the robo advisory services market report also includes key purchase criteria and drivers of price sensitivity to help companies evaluate and develop their market growth analysis strategies.

Robo Advisory Services Market Share by Geography

 Customer Landscape

Key Companies & Market Insights

Companies are implementing various strategies, such as strategic alliances, robo advisory services market forecast, partnerships, mergers and acquisitions, geographical expansion, and product/service launches, to enhance their presence in the industry.

ACORNS ADVISERS LLC - This company specializes in robo-advisory services, utilizing advanced technology to automate investment management.

The industry research and growth report includes detailed analyses of the competitive landscape of the market and information about key companies, including:

  • ACORNS ADVISERS LLC
  • Axos Financial Inc.
  • Betterment LLC
  • Fincite GmbH
  • FMR LLC
  • Ginmon Vermogensverwaltung GmbH
  • JPMorgan Chase and Co.
  • M1 Holdings Inc.
  • MFM Investment Ltd.
  • Robinhood Financial LLC
  • Scalable Capital GmbH
  • SigFig Wealth Management LLC 
  • SoFi Technologies Inc.
  • Stash Financial Inc.
  • The Charles Schwab Corp.
  • The Vanguard Group Inc.
  • Wealthfront Corp.
  • Wealthify Ltd.
  • Bank of America Corp.
  • BlackRock Inc.

Qualitative and quantitative analysis of companies has been conducted to help clients understand the wider business environment as well as the strengths and weaknesses of key industry players. Data is qualitatively analyzed to categorize companies as pure play, category-focused, industry-focused, and diversified; it is quantitatively analyzed to categorize companies as dominant, leading, strong, tentative, and weak.

Recent Development and News in Robo Advisory Services Market

  • In January 2024, Betterment, a leading robo-advisory firm, announced the launch of its new socially responsible investing (SRI) portfolio, catering to clients seeking to align their investments with their values (Betterment Press Release). This expansion marked a significant strategic move to cater to the growing demand for socially responsible investment options.
  • In March 2024, BlackRock, the world's largest asset manager, entered into a partnership with iShares and Charles Schwab to offer its digital investing platform, Aladdin, to Schwab clients. This collaboration aimed to combine BlackRock's investment expertise with Schwab's digital capabilities, creating a more comprehensive offering for investors (BlackRock Press Release).
  • In May 2024, Wealthfront, another major robo-advisor, raised USD 210 million in a Series E funding round, led by Durable Capital Partners. This investment brought Wealthfront's total funding to over USD 700 million, further solidifying its position as a key player in the robo-advisory market (TechCrunch).
  • In April 2025, the Securities and Exchange Commission (SEC) approved the first rule change allowing robo-advisors to use target-date funds in their automated investment portfolios. This approval opened the door for robo-advisors to offer more diversified investment options and better risk management tools to their clients (SEC Press Release).

Research Analyst Overview

  • The robo-advisory services market is experiencing dynamic growth, driven by the increasing adoption of technology in income investing and alternative investments. Data visualization tools enable investors to make informed decisions based on complex financial data. Financial regulations continue to shape the industry, with compliance audits and anti-money laundering (AML) measures being crucial. Real estate investing, value investing, and private equity are popular investment strategies, while sentiment analysis and predictive analytics offer insights into market trends. Data encryption and blockchain technology ensure secure transactions and transparency. Alternative investments, such as cryptocurrency, are integrated into robo-advisory platforms, expanding investment opportunities.
  • Content marketing, customer onboarding, and user engagement strategies are essential for attracting and retaining clients. Mobile app development and email marketing are key channels for reaching investors, while marketing automation enhances customer acquisition and lead generation. Behavioral finance and quantitative analysis inform investment decisions, while ESG investing aligns investments with ethical values. Social media marketing and referral programs boost brand awareness and customer acquisition. Growth investing and customer retention strategies ensure long-term success in the competitive robo-advisory landscape.

Dive into Technavio’s robust research methodology, blending expert interviews, extensive data synthesis, and validated models for unparalleled Robo Advisory Services Market insights. See full methodology.

Market Scope

Report Coverage

Details

Page number

155

Base year

2023

Historic period

2018-2022

Forecast period

2024-2028

Growth momentum & CAGR

Accelerate at a CAGR of 9.16%

Market growth 2024-2028

USD 1306.37 billion

Market structure

Fragmented

YoY growth 2023-2024(%)

8.45

Key countries

US, Japan, India, UK, and Germany

Competitive landscape

Leading Companies, Market Positioning of Companies, Competitive Strategies, and Industry Risks

Request Free Sample

What are the Key Data Covered in this Robo Advisory Services Market Research and Growth Report?

  • CAGR of the Robo Advisory Services industry during the forecast period
  • Detailed information on factors that will drive the growth and forecasting between 2024 and 2028
  • Precise estimation of the size of the market and its contribution of the industry in focus to the parent market
  • Accurate predictions about upcoming growth and trends and changes in consumer behaviour
  • Growth of the market across North America, Europe, APAC, South America, and Middle East and Africa
  • Thorough analysis of the market’s competitive landscape and detailed information about companies
  • Comprehensive analysis of factors that will challenge the robo advisory services market growth of industry companies

We can help! Our analysts can customize this robo advisory services market research report to meet your requirements.

Get in touch

1 Executive Summary

  • 1.1 Market overview
    • Exhibit 01: Executive Summary – Chart on Market Overview
    • Exhibit 02: Executive Summary – Data Table on Market Overview
    • Exhibit 03: Executive Summary – Chart on Global Market Characteristics
    • Exhibit 04: Executive Summary – Chart on Market by Geography
    • Exhibit 05: Executive Summary – Chart on Market Segmentation by End-user
    • Exhibit 06: Executive Summary – Chart on Market Segmentation by Service Type
    • Exhibit 07: Executive Summary – Chart on Incremental Growth
    • Exhibit 08: Executive Summary – Data Table on Incremental Growth
    • Exhibit 09: Executive Summary – Chart on Vendor Market Positioning

2 Market Landscape

  • 2.1 Market ecosystem
    • Exhibit 10: Parent market
    • Exhibit 11: Market Characteristics

3 Market Sizing

  • 3.1 Market definition
    • Exhibit 12: Offerings of vendors included in the market definition
  • 3.2 Market segment analysis
    • Exhibit 13: Market segments
  • 3.3 Market size 2023
    • 3.4 Market outlook: Forecast for 2023-2028
      • Exhibit 14: Chart on Global - Market size and forecast 2023-2028 ($ billion)
      • Exhibit 15: Data Table on Global - Market size and forecast 2023-2028 ($ billion)
      • Exhibit 16: Chart on Global Market: Year-over-year growth 2023-2028 (%)
      • Exhibit 17: Data Table on Global Market: Year-over-year growth 2023-2028 (%)

    4 Historic Market Size

    • 4.1 Global robo advisory services market 2018 - 2022
      • Exhibit 18: Historic Market Size – Data Table on global robo advisory services market 2018 - 2022 ($ billion)
    • 4.2 End-user Segment Analysis 2018 - 2022
      • Exhibit 19: Historic Market Size – End-user Segment 2018 - 2022 ($ billion)
    • 4.3 Service type Segment Analysis 2018 - 2022
      • Exhibit 20: Historic Market Size – Service type Segment 2018 - 2022 ($ billion)
    • 4.4 Geography Segment Analysis 2018 - 2022
      • Exhibit 21: Historic Market Size – Geography Segment 2018 - 2022 ($ billion)
    • 4.5 Country Segment Analysis 2018 - 2022
      • Exhibit 22: Historic Market Size – Country Segment 2018 - 2022 ($ billion)

    5 Five Forces Analysis

    • 5.1 Five forces summary
      • Exhibit 23: Five forces analysis - Comparison between 2023 and 2028
    • 5.2 Bargaining power of buyers
      • Exhibit 24: Chart on Bargaining power of buyers – Impact of key factors 2023 and 2028
    • 5.3 Bargaining power of suppliers
      • Exhibit 25: Bargaining power of suppliers – Impact of key factors in 2023 and 2028
    • 5.4 Threat of new entrants
      • Exhibit 26: Threat of new entrants – Impact of key factors in 2023 and 2028
    • 5.5 Threat of substitutes
      • Exhibit 27: Threat of substitutes – Impact of key factors in 2023 and 2028
    • 5.6 Threat of rivalry
      • Exhibit 28: Threat of rivalry – Impact of key factors in 2023 and 2028
    • 5.7 Market condition
      • Exhibit 29: Chart on Market condition - Five forces 2023 and 2028

    6 Market Segmentation by End-user

    • 6.1 Market segments
      • Exhibit 30: Chart on End-user - Market share 2023-2028 (%)
      • Exhibit 31: Data Table on End-user - Market share 2023-2028 (%)
    • 6.2 Comparison by End-user
      • Exhibit 32: Chart on Comparison by End-user
      • Exhibit 33: Data Table on Comparison by End-user
    • 6.3 High net worth individuals - Market size and forecast 2023-2028
      • Exhibit 34: Chart on High net worth individuals - Market size and forecast 2023-2028 ($ billion)
      • Exhibit 35: Data Table on High net worth individuals - Market size and forecast 2023-2028 ($ billion)
      • Exhibit 36: Chart on High net worth individuals - Year-over-year growth 2023-2028 (%)
      • Exhibit 37: Data Table on High net worth individuals - Year-over-year growth 2023-2028 (%)
    • 6.4 Retail investors - Market size and forecast 2023-2028
      • Exhibit 38: Chart on Retail investors - Market size and forecast 2023-2028 ($ billion)
      • Exhibit 39: Data Table on Retail investors - Market size and forecast 2023-2028 ($ billion)
      • Exhibit 40: Chart on Retail investors - Year-over-year growth 2023-2028 (%)
      • Exhibit 41: Data Table on Retail investors - Year-over-year growth 2023-2028 (%)
    • 6.5 Market opportunity by End-user
      • Exhibit 42: Market opportunity by End-user ($ billion)
      • Exhibit 43: Data Table on Market opportunity by End-user ($ billion)

    7 Market Segmentation by Service Type

    • 7.1 Market segments
      • Exhibit 44: Chart on Service Type - Market share 2023-2028 (%)
      • Exhibit 45: Data Table on Service Type - Market share 2023-2028 (%)
    • 7.2 Comparison by Service Type
      • Exhibit 46: Chart on Comparison by Service Type
      • Exhibit 47: Data Table on Comparison by Service Type
    • 7.3 Portfolio management - Market size and forecast 2023-2028
      • Exhibit 48: Chart on Portfolio management - Market size and forecast 2023-2028 ($ billion)
      • Exhibit 49: Data Table on Portfolio management - Market size and forecast 2023-2028 ($ billion)
      • Exhibit 50: Chart on Portfolio management - Year-over-year growth 2023-2028 (%)
      • Exhibit 51: Data Table on Portfolio management - Year-over-year growth 2023-2028 (%)
    • 7.4 Tax optimization - Market size and forecast 2023-2028
      • Exhibit 52: Chart on Tax optimization - Market size and forecast 2023-2028 ($ billion)
      • Exhibit 53: Data Table on Tax optimization - Market size and forecast 2023-2028 ($ billion)
      • Exhibit 54: Chart on Tax optimization - Year-over-year growth 2023-2028 (%)
      • Exhibit 55: Data Table on Tax optimization - Year-over-year growth 2023-2028 (%)
    • 7.5 Retirement planning - Market size and forecast 2023-2028
      • Exhibit 56: Chart on Retirement planning - Market size and forecast 2023-2028 ($ billion)
      • Exhibit 57: Data Table on Retirement planning - Market size and forecast 2023-2028 ($ billion)
      • Exhibit 58: Chart on Retirement planning - Year-over-year growth 2023-2028 (%)
      • Exhibit 59: Data Table on Retirement planning - Year-over-year growth 2023-2028 (%)
    • 7.6 Others - Market size and forecast 2023-2028
      • Exhibit 60: Chart on Others - Market size and forecast 2023-2028 ($ billion)
      • Exhibit 61: Data Table on Others - Market size and forecast 2023-2028 ($ billion)
      • Exhibit 62: Chart on Others - Year-over-year growth 2023-2028 (%)
      • Exhibit 63: Data Table on Others - Year-over-year growth 2023-2028 (%)
    • 7.7 Market opportunity by Service Type
      • Exhibit 64: Market opportunity by Service Type ($ billion)
      • Exhibit 65: Data Table on Market opportunity by Service Type ($ billion)

    8 Customer Landscape

    • 8.1 Customer landscape overview
      • Exhibit 66: Analysis of price sensitivity, lifecycle, customer purchase basket, adoption rates, and purchase criteria

    9 Geographic Landscape

    • 9.1 Geographic segmentation
      • Exhibit 67: Chart on Market share by geography 2023-2028 (%)
      • Exhibit 68: Data Table on Market share by geography 2023-2028 (%)
    • 9.2 Geographic comparison
      • Exhibit 69: Chart on Geographic comparison
      • Exhibit 70: Data Table on Geographic comparison
    • 9.3 North America - Market size and forecast 2023-2028
      • Exhibit 71: Chart on North America - Market size and forecast 2023-2028 ($ billion)
      • Exhibit 72: Data Table on North America - Market size and forecast 2023-2028 ($ billion)
      • Exhibit 73: Chart on North America - Year-over-year growth 2023-2028 (%)
      • Exhibit 74: Data Table on North America - Year-over-year growth 2023-2028 (%)
    • 9.4 Europe - Market size and forecast 2023-2028
      • Exhibit 75: Chart on Europe - Market size and forecast 2023-2028 ($ billion)
      • Exhibit 76: Data Table on Europe - Market size and forecast 2023-2028 ($ billion)
      • Exhibit 77: Chart on Europe - Year-over-year growth 2023-2028 (%)
      • Exhibit 78: Data Table on Europe - Year-over-year growth 2023-2028 (%)
    • 9.5 APAC - Market size and forecast 2023-2028
      • Exhibit 79: Chart on APAC - Market size and forecast 2023-2028 ($ billion)
      • Exhibit 80: Data Table on APAC - Market size and forecast 2023-2028 ($ billion)
      • Exhibit 81: Chart on APAC - Year-over-year growth 2023-2028 (%)
      • Exhibit 82: Data Table on APAC - Year-over-year growth 2023-2028 (%)
    • 9.6 South America - Market size and forecast 2023-2028
      • Exhibit 83: Chart on South America - Market size and forecast 2023-2028 ($ billion)
      • Exhibit 84: Data Table on South America - Market size and forecast 2023-2028 ($ billion)
      • Exhibit 85: Chart on South America - Year-over-year growth 2023-2028 (%)
      • Exhibit 86: Data Table on South America - Year-over-year growth 2023-2028 (%)
    • 9.7 Middle East and Africa - Market size and forecast 2023-2028
      • Exhibit 87: Chart on Middle East and Africa - Market size and forecast 2023-2028 ($ billion)
      • Exhibit 88: Data Table on Middle East and Africa - Market size and forecast 2023-2028 ($ billion)
      • Exhibit 89: Chart on Middle East and Africa - Year-over-year growth 2023-2028 (%)
      • Exhibit 90: Data Table on Middle East and Africa - Year-over-year growth 2023-2028 (%)
    • 9.8 US - Market size and forecast 2023-2028
      • Exhibit 91: Chart on US - Market size and forecast 2023-2028 ($ billion)
      • Exhibit 92: Data Table on US - Market size and forecast 2023-2028 ($ billion)
      • Exhibit 93: Chart on US - Year-over-year growth 2023-2028 (%)
      • Exhibit 94: Data Table on US - Year-over-year growth 2023-2028 (%)
    • 9.9 UK - Market size and forecast 2023-2028
      • Exhibit 95: Chart on UK - Market size and forecast 2023-2028 ($ billion)
      • Exhibit 96: Data Table on UK - Market size and forecast 2023-2028 ($ billion)
      • Exhibit 97: Chart on UK - Year-over-year growth 2023-2028 (%)
      • Exhibit 98: Data Table on UK - Year-over-year growth 2023-2028 (%)
    • 9.10 Germany - Market size and forecast 2023-2028
      • Exhibit 99: Chart on Germany - Market size and forecast 2023-2028 ($ billion)
      • Exhibit 100: Data Table on Germany - Market size and forecast 2023-2028 ($ billion)
      • Exhibit 101: Chart on Germany - Year-over-year growth 2023-2028 (%)
      • Exhibit 102: Data Table on Germany - Year-over-year growth 2023-2028 (%)
    • 9.11 Japan - Market size and forecast 2023-2028
      • Exhibit 103: Chart on Japan - Market size and forecast 2023-2028 ($ billion)
      • Exhibit 104: Data Table on Japan - Market size and forecast 2023-2028 ($ billion)
      • Exhibit 105: Chart on Japan - Year-over-year growth 2023-2028 (%)
      • Exhibit 106: Data Table on Japan - Year-over-year growth 2023-2028 (%)
    • 9.12 India - Market size and forecast 2023-2028
      • Exhibit 107: Chart on India - Market size and forecast 2023-2028 ($ billion)
      • Exhibit 108: Data Table on India - Market size and forecast 2023-2028 ($ billion)
      • Exhibit 109: Chart on India - Year-over-year growth 2023-2028 (%)
      • Exhibit 110: Data Table on India - Year-over-year growth 2023-2028 (%)
    • 9.13 Market opportunity by geography
      • Exhibit 111: Market opportunity by geography ($ billion)
      • Exhibit 112: Data Tables on Market opportunity by geography ($ billion)

    10 Drivers, Challenges, and Trends

    • 10.1 Market drivers
      • 10.2 Market challenges
        • 10.3 Impact of drivers and challenges
          • Exhibit 113: Impact of drivers and challenges in 2023 and 2028
        • 10.4 Market trends

          11 Vendor Landscape

          • 11.1 Overview
            • 11.2 Vendor landscape
              • Exhibit 114: Overview on Criticality of inputs and Factors of differentiation
            • 11.3 Landscape disruption
              • Exhibit 115: Overview on factors of disruption
            • 11.4 Industry risks
              • Exhibit 116: Impact of key risks on business

            12 Vendor Analysis

            • 12.1 Vendors covered
              • Exhibit 117: Vendors covered
            • 12.2 Market positioning of vendors
              • Exhibit 118: Matrix on vendor position and classification
            • 12.3 ACORNS ADVISERS LLC
              • Exhibit 119: ACORNS ADVISERS LLC - Overview
              • Exhibit 120: ACORNS ADVISERS LLC - Product / Service
              • Exhibit 121: ACORNS ADVISERS LLC - Key offerings
            • 12.4 Betterment LLC
              • Exhibit 122: Betterment LLC - Overview
              • Exhibit 123: Betterment LLC - Product / Service
              • Exhibit 124: Betterment LLC - Key offerings
            • 12.5 Fincite GmbH
              • Exhibit 125: Fincite GmbH - Overview
              • Exhibit 126: Fincite GmbH - Product / Service
              • Exhibit 127: Fincite GmbH - Key offerings
            • 12.6 FMR LLC
              • Exhibit 128: FMR LLC - Overview
              • Exhibit 129: FMR LLC - Product / Service
              • Exhibit 130: FMR LLC - Key offerings
            • 12.7 Ginmon Vermogensverwaltung GmbH
              • Exhibit 131: Ginmon Vermogensverwaltung GmbH - Overview
              • Exhibit 132: Ginmon Vermogensverwaltung GmbH - Product / Service
              • Exhibit 133: Ginmon Vermogensverwaltung GmbH - Key offerings
            • 12.8 M1 Holdings Inc.
              • Exhibit 134: M1 Holdings Inc. - Overview
              • Exhibit 135: M1 Holdings Inc. - Product / Service
              • Exhibit 136: M1 Holdings Inc. - Key offerings
            • 12.9 MFM Investment Ltd.
              • Exhibit 137: MFM Investment Ltd. - Overview
              • Exhibit 138: MFM Investment Ltd. - Product / Service
              • Exhibit 139: MFM Investment Ltd. - Key offerings
            • 12.10 Robinhood Financial LLC
              • Exhibit 140: Robinhood Financial LLC - Overview
              • Exhibit 141: Robinhood Financial LLC - Product / Service
              • Exhibit 142: Robinhood Financial LLC - Key offerings
            • 12.11 Scalable Capital GmbH
              • Exhibit 143: Scalable Capital GmbH - Overview
              • Exhibit 144: Scalable Capital GmbH - Product / Service
              • Exhibit 145: Scalable Capital GmbH - Key offerings
            • 12.12 SigFig Wealth Management LLC
              • Exhibit 146: SigFig Wealth Management LLC  - Overview
              • Exhibit 147: SigFig Wealth Management LLC  - Product / Service
              • Exhibit 148: SigFig Wealth Management LLC  - Key offerings
            • 12.13 SoFi Technologies Inc.
              • Exhibit 149: SoFi Technologies Inc. - Overview
              • Exhibit 150: SoFi Technologies Inc. - Product / Service
              • Exhibit 151: SoFi Technologies Inc. - Key offerings
            • 12.14 The Charles Schwab Corp.
              • Exhibit 152: The Charles Schwab Corp. - Overview
              • Exhibit 153: The Charles Schwab Corp. - Business segments
              • Exhibit 154: The Charles Schwab Corp. - Key offerings
              • Exhibit 155: The Charles Schwab Corp. - Segment focus
            • 12.15 The Vanguard Group Inc.
              • Exhibit 156: The Vanguard Group Inc. - Overview
              • Exhibit 157: The Vanguard Group Inc. - Product / Service
              • Exhibit 158: The Vanguard Group Inc. - Key offerings
            • 12.16 Wealthfront Corp.
              • Exhibit 159: Wealthfront Corp. - Overview
              • Exhibit 160: Wealthfront Corp. - Product / Service
              • Exhibit 161: Wealthfront Corp. - Key offerings
            • 12.17 Wealthify Ltd.
              • Exhibit 162: Wealthify Ltd. - Overview
              • Exhibit 163: Wealthify Ltd. - Product / Service
              • Exhibit 164: Wealthify Ltd. - Key offerings

            13 Appendix

            • 13.1 Scope of the report
              • 13.2 Inclusions and exclusions checklist
                • Exhibit 165: Inclusions checklist
                • Exhibit 166: Exclusions checklist
              • 13.3 Currency conversion rates for US$
                • Exhibit 167: Currency conversion rates for US$
              • 13.4 Research methodology
                • Exhibit 168: Research methodology
                • Exhibit 169: Validation techniques employed for market sizing
                • Exhibit 170: Information sources
              • 13.5 List of abbreviations
                • Exhibit 171: List of abbreviations

              Research Methodology

              Technavio presents a detailed picture of the market by way of study, synthesis, and summation of data from multiple sources. The analysts have presented the various facets of the market with a particular focus on identifying the key industry influencers. The data thus presented is comprehensive, reliable, and the result of extensive research, both primary and secondary.

              INFORMATION SOURCES

              Primary sources

              • Manufacturers and suppliers
              • Channel partners
              • Industry experts
              • Strategic decision makers

              Secondary sources

              • Industry journals and periodicals
              • Government data
              • Financial reports of key industry players
              • Historical data
              • Press releases

              DATA ANALYSIS

              Data Synthesis

              • Collation of data
              • Estimation of key figures
              • Analysis of derived insights

              Data Validation

              • Triangulation with data models
              • Reference against proprietary databases
              • Corroboration with industry experts

              REPORT WRITING

              Qualitative

              • Market drivers
              • Market challenges
              • Market trends
              • Five forces analysis

              Quantitative

              • Market size and forecast
              • Market segmentation
              • Geographical insights
              • Competitive landscape

              Interested in this report?

              Get your sample now to see our research methodology and insights!

              Download Now

              Frequently Asked Questions

              Robo Advisory Services market growth will increase by $ 1306.37 bn during 2024-2028 .

              The Robo Advisory Services market is expected to grow at a CAGR of 9.16% during 2024-2028 .

              Robo Advisory Services market is segmented by End-user( High net worth individuals, Retail investors) Service Type( Portfolio management, Tax optimization, Retirement planning, Others)

              ACORNS ADVISERS LLC, Axos Financial Inc., Betterment LLC, Fincite GmbH, FMR LLC, Ginmon Vermogensverwaltung GmbH, JPMorgan Chase and Co., M1 Holdings Inc., MFM Investment Ltd., Robinhood Financial LLC, Scalable Capital GmbH, SigFig Wealth Management LLC , SoFi Technologies Inc., Stash Financial Inc., The Charles Schwab Corp., The Vanguard Group Inc., Wealthfront Corp., Wealthify Ltd., Bank of America Corp., BlackRock Inc. are a few of the key vendors in the Robo Advisory Services market.

              North America will register the highest growth rate of 37% among the other regions. Therefore, the Robo Advisory Services market in North America is expected to garner significant business opportunities for the vendors during the forecast period.

              US, Japan, India, UK, Germany

              • Growing adoption of AI and ML in robo advisory servicesAI and ML algorithms enable robo advisory platforms to analyze large volumes of financial data quickly and efficiently. These technologies can identify patterns is the driving factor this market.
              • trends is the driving factor this market.
              • and correlations in data that may not be apparent to human analysts is the driving factor this market.
              • leading to more informed investment decisions and improved portfolio performance. AI and ML algorithms can be used to develop predictive models that forecast market trends is the driving factor this market.
              • asset price movements is the driving factor this market.
              • and portfolio performance. By analyzing historical data and identifying relevant patterns is the driving factor this market.
              • these models help robo advisors anticipate market shifts and make proactive investment decisions to optimize portfolio returns and mitigate risks. Moreover is the driving factor this market.
              • AI and ML algorithms enable robo advisory platforms to provide personalized investment recommendations tailored to individual investors goals is the driving factor this market.
              • risk tolerance is the driving factor this market.
              • and preferences. By analyzing client data and behavior patterns is the driving factor this market.
              • these algorithms can recommend investment strategies and asset allocations that align with each investors unique financial situation and objectives. AI and ML algorithms enable dynamic portfolio management is the driving factor this market.
              • allowing robo advisors to continuously monitor market conditions and adjust investment strategies in real time. These algorithms can automatically rebalance portfolios is the driving factor this market.
              • optimize asset allocations is the driving factor this market.
              • and implement tax-efficient trading strategies to maximize returns while minimizing risks. Moreover is the driving factor this market.
              • AI and ML technologies can analyze investor behavior and sentiment to better understand their emotions is the driving factor this market.
              • biases is the driving factor this market.
              • and decision-making processes. By incorporating behavioral finance insights into investment strategies is the driving factor this market.
              • robo advisors can help investors overcome cognitive biases and make more rational financial decisions. Furthermore is the driving factor this market.
              • AI and ML algorithms can learn from past investment decisions is the driving factor this market.
              • client interactions is the driving factor this market.
              • and market outcomes to continuously improve their performance over time. By incorporating feedback loops and adaptive learning mechanisms is the driving factor this market.
              • robo advisory platforms can evolve and refine their algorithms to deliver better outcomes for investors. Thus is the driving factor this market.
              • the use of AI and ML empowers robo advisors to deliver more sophisticated is the driving factor this market.
              • efficient is the driving factor this market.
              • and personalized investment solutions is the driving factor this market.
              • which will enhance the growth of the global robo advisory services market during the forecast period. is the driving factor this market.

              The Robo Advisory Services market vendors should focus on grabbing business opportunities from the High net worth individuals segment as it accounted for the largest market share in the base year.