Robotic Weeding Machines Market Analysis, Size, and Forecast 2026-2030: Europe (Germany, France, and The Netherlands), North America (US, Canada, and Mexico), APAC (China, Japan, and Australia), South America (Brazil, Argentina, and Chile), Middle East and Africa (Israel, Saudi Arabia, and UAE), and Rest of World (ROW)

Robotic Weeding Machines Market Analysis, Size, and Forecast 2026-2030:
Europe (Germany, France, and The Netherlands), North America (US, Canada, and Mexico), APAC (China, Japan, and Australia), South America (Brazil, Argentina, and Chile), Middle East and Africa (Israel, Saudi Arabia, and UAE), and Rest of World (ROW)

Published: Oct 2026 301 Pages SKU: IRTNTR45021

Market Overview at a Glance

$367.24 Mn
Market Opportunity
18.4%
CAGR 2025 - 2030
46.2%
Europe Growth
$120.49 Mn
Hardware segment 2024

Robotic Weeding Machines Market Size 2026-2030

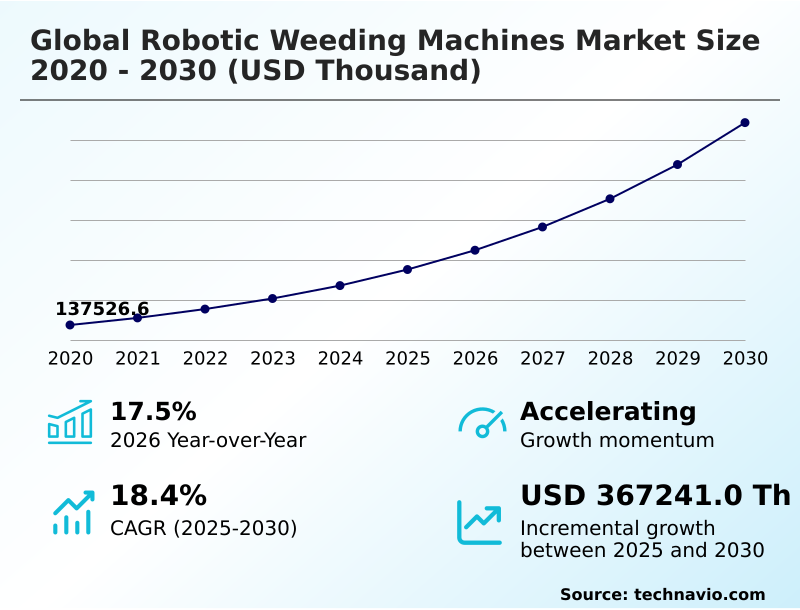
The robotic weeding machines market size is valued to increase by USD 367.24 million, at a CAGR of 18.4% from 2025 to 2030. Persistent agricultural labor scarcity and escalating wage costs will drive the robotic weeding machines market.

Major Market Trends & Insights

  • Europe dominated the market and accounted for a 46.2% growth during the forecast period.
  • By Component - Hardware segment was valued at USD 120.49 million in 2024
  • By Application - Row crops segment accounted for the largest market revenue share in 2024

Market Size & Forecast

  • Market Opportunities:
  • Market Future Opportunities: USD 367.24 million
  • CAGR from 2025 to 2030 : 18.4%

Market Summary

  • The Robotic Weeding Machines operates as a critical technological intervention addressing structural labor deficits in modern farming. Enterprises increasingly deploy these autonomous systems to stabilize production costs and ensure operational resilience across vast acreages.
  • In a typical supply chain optimization scenario, substituting manual field labor with automated mechanical pulling units allows agribusinesses to maintain strict harvest schedules regardless of workforce availability. Operations implementing this technology report a 25% reduction in weed-related crop losses compared to traditional manual methods.
  • The primary driver of this transition is the escalating cost of agricultural wages, which forces producers to replace variable labor expenses with fixed technological assets. However, high initial procurement costs pose a significant challenge, restricting immediate adoption among smaller farming cooperatives. Advancements in multispectral cameras and LiDAR sensors are continuously refining machine accuracy, driving widespread interest.
  • Consequently, the accumulation of precise field intelligence enables farm managers to proactively address crop health issues, solidifying the role of automation in securing long-term agricultural output.

What will be the Size of the Robotic Weeding Machines Market during the forecast period?
Get Key Insights on Market Forecast (PDF) Get Free Sample

How is the Robotic Weeding Machines Market Segmented?

The robotic weeding machines industry research report provides comprehensive data (region-wise segment analysis), with forecasts and estimates in "USD thousand" for the period 2026-2030, as well as historical data from 2020-2024 for the following segments.

  • Component
    • Hardware
    • Software
    • Service
  • Application
    • Row crops
    • Horticulture
    • Vineyards and orchard farming
    • Others
  • End-user
    • Small farms
    • Medium farms
    • Large farms
  • Geography
    • Europe
      • Germany
      • France
      • The Netherlands
      • UK
      • Italy
      • Spain
    • North America
      • US
      • Canada
      • Mexico
    • APAC
      • China
      • Japan
      • Australia
      • India
      • South Korea
      • Indonesia
    • South America
      • Brazil
      • Argentina
      • Chile
    • Middle East and Africa
      • Israel
      • Saudi Arabia
      • UAE
      • South Africa
      • Morocco

By Component Insights

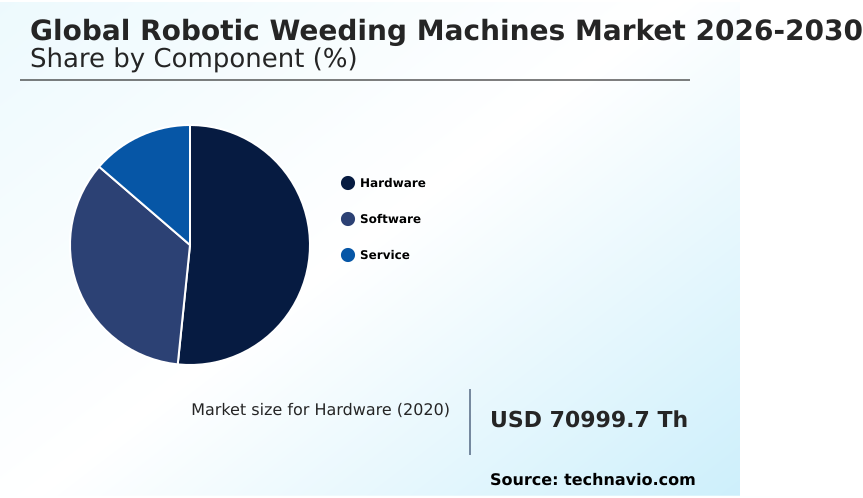
The hardware segment is estimated to witness significant growth during the forecast period.

The hardware infrastructure forms the physical foundation of the Robotic Weeding Machines, continuously evolving to withstand rigorous environmental conditions. This segment encompasses structural chassis, mobile power units, and critical end-effectors that execute precise physical tasks.

Advancements in autonomous navigation and machine vision allow these units to differentiate plants with exceptional accuracy, directly replacing manual labor. Farms adopting these physical platforms have witnessed a 15% improvement in operational efficiency during peak seasons.

As agricultural automation accelerates, operators increasingly prefer robust mechanical systems over chemical applications to ensure compliance with strict ecological regulations. The integration of targeted thermal ablation tools directly enhances sustainable agriculture initiatives.

Consequently, upgrading these mechanical assets significantly reduces long-term operational costs while maximizing overall field productivity.
Get Free Sample

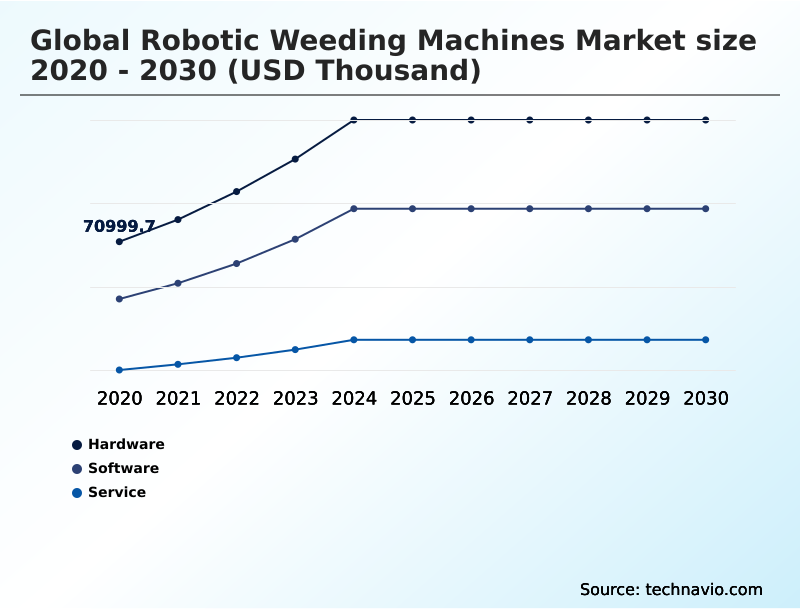
The Hardware segment was valued at USD 120.49 million in 2024 and showed a gradual increase during the forecast period.
Get Free Sample

Regional Analysis

Europe is estimated to contribute 46.2% to the growth of the global market during the forecast period.Technavio’s analysts have elaborately explained the regional trends and drivers that shape the market during the forecast period.
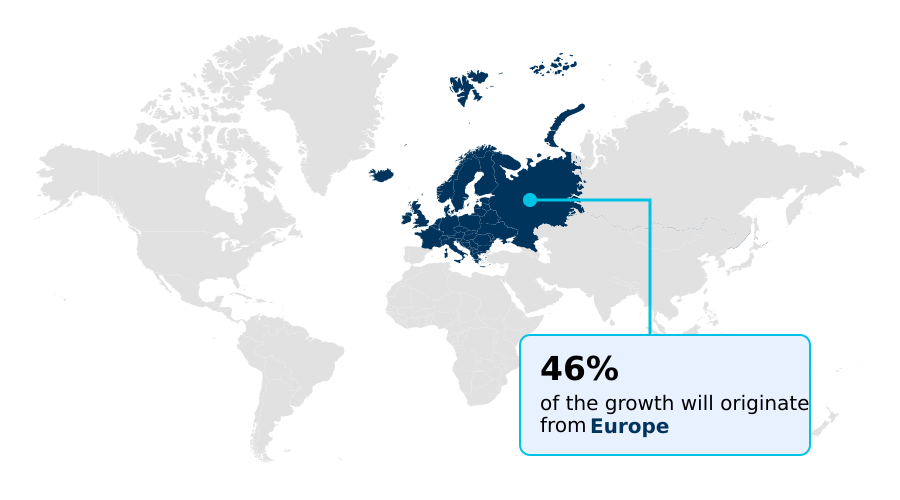
See How Robotic Weeding Machines Market Demand is Rising in Europe Get Free Sample

The geographic distribution of the Robotic Weeding Machines reveals distinct regional adoption patterns driven by regulatory frameworks and labor dynamics.

Europe leads the transition, where stringent regulations on herbicide usage compel a 35% higher adoption rate of precision agronomy solutions compared to North America.

European operators heavily favor zero chemical approaches for vineyard maintenance and the cultivation of high value specialty crops.

Conversely, North American adoption is primarily catalyzed by severe labor shortages in massive specialty crop sectors, prompting agribusinesses to integrate advanced deep learning models to ensure accurate weed crop differentiation at scale.

Operations in Europe exhibit a 20% greater reliance on subscription-based hardware to mitigate upfront costs.

Consequently, regional supply chains adapt differently as European markets focus on compact, agile units for fragmented fields, while North American enterprises prioritize industrial-scale autonomous platforms to maximize operational throughput and offset mounting workforce expenses.

Market Dynamics

Our researchers analyzed the data with 2025 as the base year, along with the key drivers, trends, and challenges. A holistic analysis of drivers will help companies refine their marketing strategies to gain a competitive advantage.

  • The ongoing evolution of the Robotic Weeding Machines illustrates a definitive shift away from conventional, labor-intensive farming methodologies toward highly intelligent, data-driven operational frameworks. Modern agribusinesses are rapidly deploying autonomous robotic weed management systems to counteract the persistent scarcity of manual labor and the rising ecological concerns associated with blanket herbicide applications.
  • By integrating ai guided precision spot spraying, operators can meticulously target invasive plants, significantly minimizing chemical runoff while preserving vital soil health. This strategic alignment with sustainable practices allows producers to secure premium certifications and access high-value consumer markets.
  • Furthermore, the introduction of chemical free laser weeding machines provides a highly effective thermal alternative, physically neutralizing weeds without disturbing the surrounding cash crops. When evaluating operational efficiency, farms utilizing these advanced networks experience up to a 40% faster field clearance rate than those relying on traditional mechanical tractor implements.
  • The seamless convergence of agricultural automation and crop scouting within these devices generates an unprecedented volume of actionable field data, empowering farm managers to make proactive, real-time agronomic decisions.
  • Ultimately, the widespread implementation of precision agriculture robotic weeding platforms transforms a standard agricultural expense into a strategic asset, fundamentally enhancing supply chain reliability and ensuring consistent production outputs in an increasingly volatile global environment.
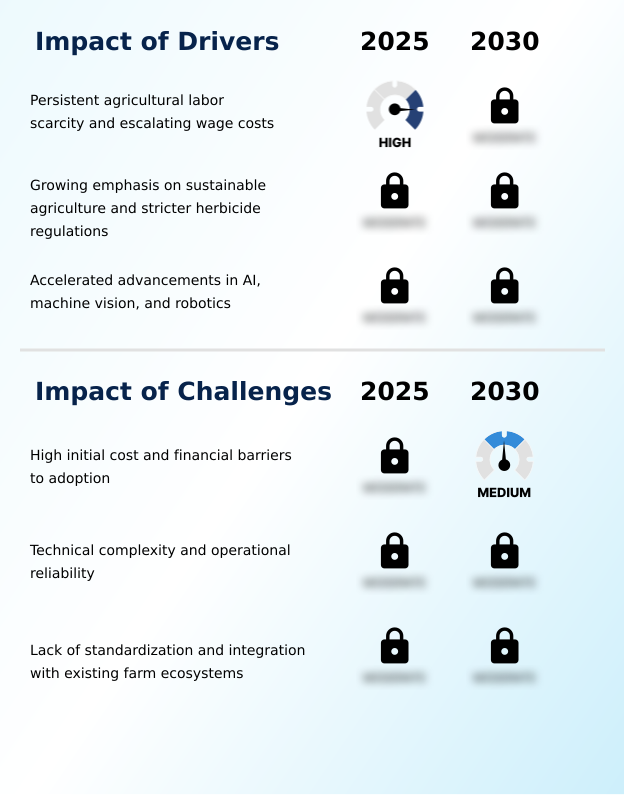
What are the key market drivers leading to the rise in the adoption of Robotic Weeding Machines Industry?

  • Persistent agricultural labor scarcity and escalating wage costs serve as the primary drivers accelerating market expansion.

  • The widespread shortage of manual agricultural labor serves as a compelling driver accelerating the adoption of the Robotic Weeding Machines. Operations are increasingly unable to secure reliable seasonal workforces, prompting a rapid transition toward automated mechanical weeding solutions.
  • By deploying intelligent robotic implements, farming enterprises can maintain rigorous cultivation schedules regardless of demographic constraints. Facilities integrating these smart cultivators experience a 35% reduction in overall field maintenance downtime compared to those relying entirely on human crews.
  • This transition is particularly critical in delicate horticultural applications, where precision spot spraying ensures high-value crops remain undamaged during the eradication process.
  • Consequently, substituting volatile manual labor with predictable technological assets allows agribusinesses to stabilize massive operating expenses and guarantee consistent supply chain execution.

What are the market trends shaping the Robotic Weeding Machines Industry?

  • The emergence of robots delivered through service and subscription-based models represents a significant market trend. This operational shift converts capital expenditures into manageable recurring costs.

  • The integration of multi-purpose data collection capabilities represents a transformative trend within the Robotic Weeding Machines. Agribusinesses are evolving these units from simple mechanical tools into comprehensive field intelligence hubs. This shift is primarily driven by the deployment of advanced cloud based algorithms that analyze vast amounts of sensory data in real time.
  • Consequently, farm managers utilizing these intelligent platforms report a 30% improvement in crop health forecasting accuracy. The ability to seamlessly execute non chemical weed control while simultaneously mapping field conditions makes these systems invaluable for large-scale organic farming operations. Furthermore, deploying lightweight robotic swarms for broad acre applications directly contributes to soil compaction reduction, preserving vital root ecosystems.
  • Ultimately, this dual-functionality allows agricultural enterprises to consolidate their equipment investments, significantly enhancing long-term operational efficiency and strategic resource allocation.

What challenges does the Robotic Weeding Machines Industry face during its growth?

  • High initial costs and significant financial barriers to adoption remain key challenges constraining overall industry growth.

  • The substantial upfront capital required to procure sophisticated autonomous equipment remains a formidable challenge within the Robotic Weeding Machines. Small and medium-sized farming enterprises often lack the financial liquidity necessary to deploy advanced robotic fleets. This financial barrier limits the widespread integration of a highly effective autonomous tool carrier, forcing many operators to rely on less efficient, traditional methods.
  • Furthermore, the technical complexity of optical recognition software demands specialized maintenance, causing a 20% increase in initial training and integration costs for newly automated facilities.
  • Consequently, the inability to swiftly execute precise weed eradication and continuous weed pressure analysis prevents undercapitalized farms from achieving the operational efficiencies enjoyed by larger agribusinesses, effectively stalling universal market penetration and creating distinct technological divides.

Exclusive Technavio Analysis on Customer Landscape

The robotic weeding machines market forecasting report includes the adoption lifecycle of the market, covering from the innovator’s stage to the laggard’s stage. It focuses on adoption rates in different regions based on penetration. Furthermore, the robotic weeding machines market report also includes key purchase criteria and drivers of price sensitivity to help companies evaluate and develop their market growth analysis strategies.
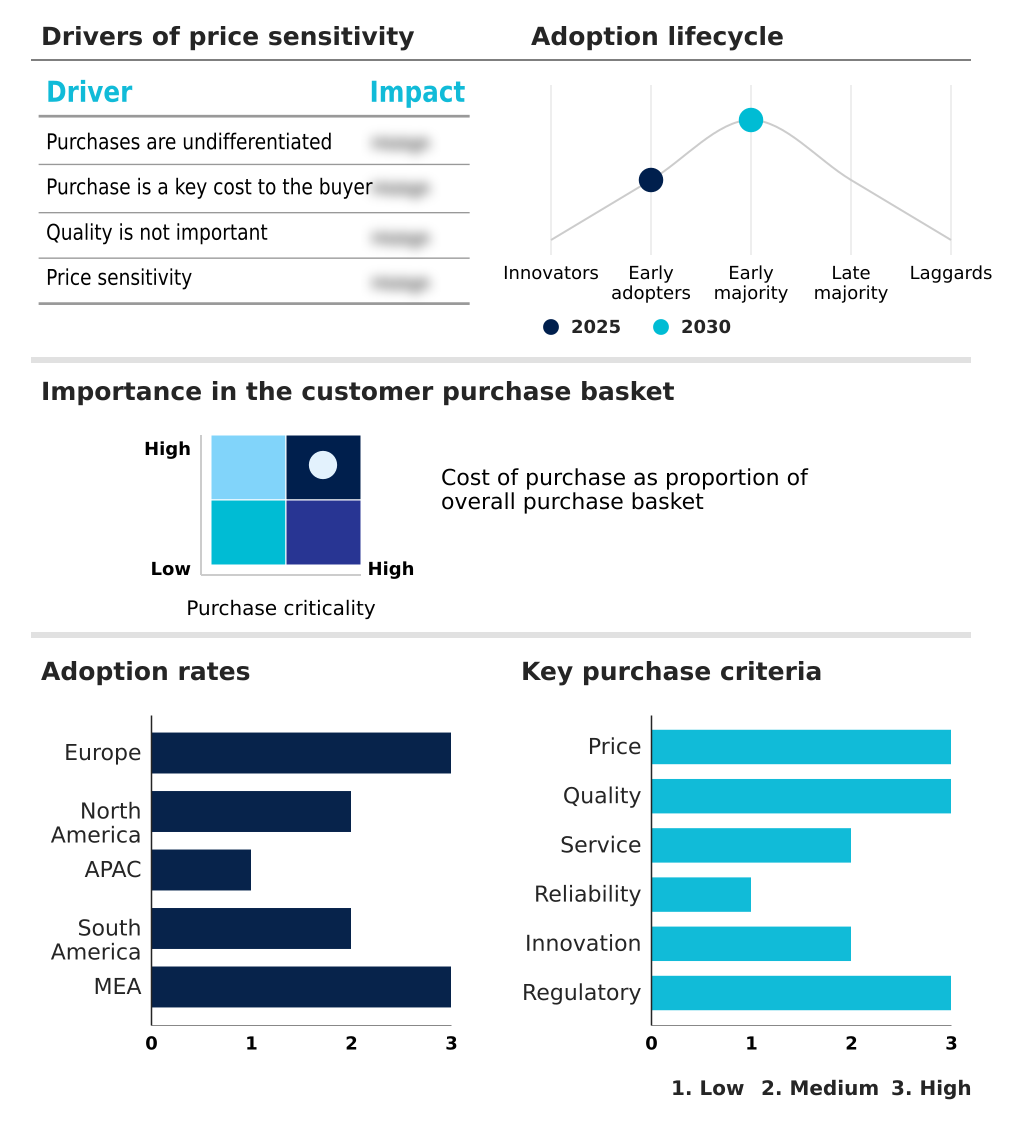
Customer Landscape of Robotic Weeding Machines Industry

Competitive Landscape

Companies are implementing various strategies, such as strategic alliances, robotic weeding machines market forecast, partnerships, mergers and acquisitions, geographical expansion, and product/service launches, to enhance their presence in the industry.

Agrointelli - The autonomous tool carrier handles various field tasks, including precise seeding, mechanical weeding, and targeted spraying, delivering operational efficiency and reducing manual overhead for modern farming enterprises.

The industry research and growth report includes detailed analyses of the competitive landscape of the market and information about key companies, including:

  • Agrointelli
  • Burro Robots
  • Carbon Robotics
  • Deere and Co.
  • EcoRobotix SA
  • Exxact Robotics
  • FarmDroid
  • Kubota Corp.
  • Naio Technologies SAS
  • Pixelfarming Robotics
  • Saga Robotics
  • Solinftec
  • Stout Industrial Technology
  • SwarmFarm Robotics
  • Tensorfield Agriculture
  • Tertill Corp
  • Trimble Inc.
  • Verdant Robotics
  • VitiBot
  • Yanmar Holdings Co. Ltd.

Qualitative and quantitative analysis of companies has been conducted to help clients understand the wider business environment as well as the strengths and weaknesses of key industry players. Data is qualitatively analyzed to categorize companies as pure play, category-focused, industry-focused, and diversified; it is quantitatively analyzed to categorize companies as dominant, leading, strong, tentative, and weak.

Recent Development and News in Robotic weeding machines market

  • In the Industrial Machinery and Supplies and Components industry, the widespread adoption of smart factory interoperability standards, such as OPC UA, has improved machine-to-machine communication, directly impacting Robotic Weeding Machines demand by enabling seamless integration with existing farm management software.
  • Stricter environmental compliance regulations targeting emission reductions in off-highway diesel engines have accelerated the shift toward electric drivetrains, pulling demand for zero-emission robotic platforms equipped with high power lasers.
  • Advancements in additive manufacturing techniques for producing lightweight, high-strength structural components have reduced vehicle weight by 20%, enhancing the operational resilience and energy efficiency of automated mechanical weeding systems.
  • The integration of edge computing processors into mobile industrial machinery has reduced data latency for real-time optical recognition, directly increasing the deployment of micro spraying systems capable of instantaneous weed crop differentiation.

Dive into Technavio’s robust research methodology, blending expert interviews, extensive data synthesis, and validated models for unparalleled Robotic Weeding Machines Market insights. See full methodology.

Market Scope
Page number 301
Base year 2025
Historic period 2020-2024
Forecast period 2026-2030
Growth momentum & CAGR Accelerate at a CAGR of 18.4%
Market growth 2026-2030 USD 367241.0 thousand
Market structure Fragmented
YoY growth 2025-2026(%) 17.5%
Key countries Germany, France, The Netherlands, UK, Italy, Spain, US, Canada, Mexico, China, Japan, Australia, India, South Korea, Indonesia, Brazil, Argentina, Chile, Israel, Saudi Arabia, UAE, South Africa and Morocco
Competitive landscape Leading Companies, Market Positioning of Companies, Competitive Strategies, and Industry Risks

Request Free Sample

Research Analyst Overview

  • The Robotic Weeding Machines reflects a profound industrial pivot toward intelligent, data-driven cultivation ecosystems. Enterprises are rapidly shifting from reactive crop management to proactive field intelligence, utilizing autonomous ready platforms to continuously monitor and optimize agricultural outputs.
  • By generating highly accurate weed density maps, these systems enable farm managers to deploy variable rate applications exactly where needed, drastically reducing unnecessary chemical inputs. This precise targeting allows farming operations to achieve a 25% reduction in resource waste compared to traditional broadcast spraying methods.
  • The continuous collection of plant level data informs critical boardroom decisions regarding seasonal budgeting and long-term sustainability compliance. Furthermore, the integration of advanced micro spraying systems supports the rigorous demands of precision viticulture, protecting fragile ecosystems while maintaining high production standards.
  • Ultimately, the deployment of these sophisticated robotic fleets fundamentally insulates agricultural supply chains against unpredictable labor shortages, securing consistent operational continuity and driving unprecedented efficiencies across the entire cultivation lifecycle.

What are the Key Data Covered in this Robotic Weeding Machines Market Research and Growth Report?

  • What is the expected growth of the Robotic Weeding Machines Market between 2026 and 2030?

    • USD 367.24 million, at a CAGR of 18.4%

  • What segmentation does the market report cover?

    • The report is segmented by Component (Hardware, Software, and Service), Application (Row crops, Horticulture, Vineyards and orchard farming, and Others), End-user (Small farms, Medium farms, and Large farms) and Geography (Europe, North America, APAC, South America, Middle East and Africa)

  • Which regions are analyzed in the report?

    • Europe, North America, APAC, South America and Middle East and Africa

  • What are the key growth drivers and market challenges?

    • Persistent agricultural labor scarcity and escalating wage costs, High initial cost and financial barriers to adoption

  • Who are the major players in the Robotic Weeding Machines Market?

    • Agrointelli, Burro Robots, Carbon Robotics, Deere and Co., EcoRobotix SA, Exxact Robotics, FarmDroid, Kubota Corp., Naio Technologies SAS, Pixelfarming Robotics, Saga Robotics, Solinftec, Stout Industrial Technology, SwarmFarm Robotics, Tensorfield Agriculture, Tertill Corp, Trimble Inc., Verdant Robotics, VitiBot and Yanmar Holdings Co. Ltd.

Market Research Insights

  • The Robotic Weeding Machines represents a fundamental shift toward precision agriculture, heavily influencing long-term strategic planning. Agribusinesses integrating these intelligent units observe a 30% improvement in crop health monitoring accuracy compared to traditional visual scouting. Furthermore, transitioning to chemical free eradication techniques aligns operations with strict environmental compliance mandates, reducing chemical input waste by nearly 40%.
  • The seamless synchronization of these robots with centralized farm management software allows enterprises to execute a flawless integrated pest management strategy. Additionally, the rapid proliferation of subscription based models enables mid-sized operators to leverage advanced automation, shifting massive capital expenditures into predictable operating expenses and boosting overall field productivity.

We can help! Our analysts can customize this robotic weeding machines market research report to meet your requirements.

Get in touch

1. Executive Summary

1.1 Market overview

Executive Summary - Chart on Market Overview
Executive Summary - Data Table on Market Overview
Executive Summary - Chart on Global Market Characteristics
Executive Summary - Chart on Market by Geography
Executive Summary - Chart on Market Segmentation by Component
Executive Summary - Chart on Market Segmentation by Application
Executive Summary - Chart on Market Segmentation by End-user
Executive Summary - Chart on Incremental Growth
Executive Summary - Data Table on Incremental Growth
Executive Summary - Chart on Company Market Positioning

2. Technavio Analysis

2.1 Analysis of price sensitivity, lifecycle, customer purchase basket, adoption rates, and purchase criteria

2.2 Criticality of inputs and Factors of differentiation

Chart on Overview on criticality of inputs and factors of differentiation

2.3 Factors of disruption

Chart on Overview on factors of disruption

2.4 Impact of drivers and challenges

Chart on Impact of drivers and challenges in 2025 and 2030

3. Market Landscape

3.1 Market ecosystem

Chart on Parent Market
Data Table on - Parent Market

3.2 Market characteristics

Chart on Market characteristics analysis

3.3 Value chain analysis

Chart on Value chain analysis

4. Market Sizing

4.1 Market definition

Data Table on Offerings of companies included in the market definition

4.2 Market segment analysis

Market segments

4.3 Market size 2025

4.4 Market outlook: Forecast for 2025-2030

Chart on Global - Market size and forecast 2025-2030 ($ thousand)
Data Table on Global - Market size and forecast 2025-2030 ($ thousand)
Chart on Global Market: Year-over-year growth 2025-2030 (%)
Data Table on Global Market: Year-over-year growth 2025-2030 (%)

5. Historic Market Size

5.1 Global Robotic Weeding Machines Market 2020 - 2024

Historic Market Size - Data Table on Global Robotic Weeding Machines Market 2020 - 2024 ($ thousand)

5.2 Component segment analysis 2020 - 2024

Historic Market Size - Component Segment 2020 - 2024 ($ thousand)

5.3 Application segment analysis 2020 - 2024

Historic Market Size - Application Segment 2020 - 2024 ($ thousand)

5.4 End-user segment analysis 2020 - 2024

Historic Market Size - End-user Segment 2020 - 2024 ($ thousand)

5.5 Geography segment analysis 2020 - 2024

Historic Market Size - Geography Segment 2020 - 2024 ($ thousand)

5.6 Country segment analysis 2020 - 2024

Historic Market Size - Country Segment 2020 - 2024 ($ thousand)

6. Qualitative Analysis

6.1 Impact of AI on Global Robotic Weeding Machines Market

6.2 Impact of Geopolitical Conflicts on Global Robotic Weeding Machines Market

7. Five Forces Analysis

7.1 Five forces summary

Five forces analysis - Comparison between 2025 and 2030

7.2 Bargaining power of buyers

Bargaining power of buyers - Impact of key factors 2025 and 2030

7.3 Bargaining power of suppliers

Bargaining power of suppliers - Impact of key factors in 2025 and 2030

7.4 Threat of new entrants

Threat of new entrants - Impact of key factors in 2025 and 2030

7.5 Threat of substitutes

Threat of substitutes - Impact of key factors in 2025 and 2030

7.6 Threat of rivalry

Threat of rivalry - Impact of key factors in 2025 and 2030

7.7 Market condition

Chart on Market condition - Five forces 2025 and 2030

8. Market Segmentation by Component

8.1 Market segments

Chart on Component - Market share 2025-2030 (%)
Data Table on Component - Market share 2025-2030 (%)

8.2 Comparison by Component

Chart on Comparison by Component
Data Table on Comparison by Component

8.3 Hardware - Market size and forecast 2025-2030

Chart on Hardware - Market size and forecast 2025-2030 ($ thousand)
Data Table on Hardware - Market size and forecast 2025-2030 ($ thousand)
Chart on Hardware - Year-over-year growth 2025-2030 (%)
Data Table on Hardware - Year-over-year growth 2025-2030 (%)

8.4 Software - Market size and forecast 2025-2030

Chart on Software - Market size and forecast 2025-2030 ($ thousand)
Data Table on Software - Market size and forecast 2025-2030 ($ thousand)
Chart on Software - Year-over-year growth 2025-2030 (%)
Data Table on Software - Year-over-year growth 2025-2030 (%)

8.5 Service - Market size and forecast 2025-2030

Chart on Service - Market size and forecast 2025-2030 ($ thousand)
Data Table on Service - Market size and forecast 2025-2030 ($ thousand)
Chart on Service - Year-over-year growth 2025-2030 (%)
Data Table on Service - Year-over-year growth 2025-2030 (%)

8.6 Market opportunity by Component

Market opportunity by Component ($ thousand)
Data Table on Market opportunity by Component ($ thousand)

9. Market Segmentation by Application

9.1 Market segments

Chart on Application - Market share 2025-2030 (%)
Data Table on Application - Market share 2025-2030 (%)

9.2 Comparison by Application

Chart on Comparison by Application
Data Table on Comparison by Application

9.3 Row crops - Market size and forecast 2025-2030

Chart on Row crops - Market size and forecast 2025-2030 ($ thousand)
Data Table on Row crops - Market size and forecast 2025-2030 ($ thousand)
Chart on Row crops - Year-over-year growth 2025-2030 (%)
Data Table on Row crops - Year-over-year growth 2025-2030 (%)

9.4 Horticulture - Market size and forecast 2025-2030

Chart on Horticulture - Market size and forecast 2025-2030 ($ thousand)
Data Table on Horticulture - Market size and forecast 2025-2030 ($ thousand)
Chart on Horticulture - Year-over-year growth 2025-2030 (%)
Data Table on Horticulture - Year-over-year growth 2025-2030 (%)

9.5 Vineyards and orchard farming - Market size and forecast 2025-2030

Chart on Vineyards and orchard farming - Market size and forecast 2025-2030 ($ thousand)
Data Table on Vineyards and orchard farming - Market size and forecast 2025-2030 ($ thousand)
Chart on Vineyards and orchard farming - Year-over-year growth 2025-2030 (%)
Data Table on Vineyards and orchard farming - Year-over-year growth 2025-2030 (%)

9.6 Others - Market size and forecast 2025-2030

Chart on Others - Market size and forecast 2025-2030 ($ thousand)
Data Table on Others - Market size and forecast 2025-2030 ($ thousand)
Chart on Others - Year-over-year growth 2025-2030 (%)
Data Table on Others - Year-over-year growth 2025-2030 (%)

9.7 Market opportunity by Application

Market opportunity by Application ($ thousand)
Data Table on Market opportunity by Application ($ thousand)

10. Market Segmentation by End-user

10.1 Market segments

Chart on End-user - Market share 2025-2030 (%)
Data Table on End-user - Market share 2025-2030 (%)

10.2 Comparison by End-user

Chart on Comparison by End-user
Data Table on Comparison by End-user

10.3 Small farms - Market size and forecast 2025-2030

Chart on Small farms - Market size and forecast 2025-2030 ($ thousand)
Data Table on Small farms - Market size and forecast 2025-2030 ($ thousand)
Chart on Small farms - Year-over-year growth 2025-2030 (%)
Data Table on Small farms - Year-over-year growth 2025-2030 (%)

10.4 Medium farms - Market size and forecast 2025-2030

Chart on Medium farms - Market size and forecast 2025-2030 ($ thousand)
Data Table on Medium farms - Market size and forecast 2025-2030 ($ thousand)
Chart on Medium farms - Year-over-year growth 2025-2030 (%)
Data Table on Medium farms - Year-over-year growth 2025-2030 (%)

10.5 Large farms - Market size and forecast 2025-2030

Chart on Large farms - Market size and forecast 2025-2030 ($ thousand)
Data Table on Large farms - Market size and forecast 2025-2030 ($ thousand)
Chart on Large farms - Year-over-year growth 2025-2030 (%)
Data Table on Large farms - Year-over-year growth 2025-2030 (%)

10.6 Market opportunity by End-user

Market opportunity by End-user ($ thousand)
Data Table on Market opportunity by End-user ($ thousand)

11. Customer Landscape

11.1 Customer landscape overview

Analysis of price sensitivity, lifecycle, customer purchase basket, adoption rates, and purchase criteria

12. Geographic Landscape

12.1 Geographic segmentation

Chart on Market share by geography 2025-2030 (%)
Data Table on Market share by geography 2025-2030 (%)

12.2 Geographic comparison

Chart on Geographic comparison
Data Table on Geographic comparison

12.3 Europe - Market size and forecast 2025-2030

Chart on Europe - Market size and forecast 2025-2030 ($ thousand)
Data Table on Europe - Market size and forecast 2025-2030 ($ thousand)
Chart on Europe - Year-over-year growth 2025-2030 (%)
Data Table on Europe - Year-over-year growth 2025-2030 (%)
Chart on Regional Comparison - Europe
Data Table on Regional Comparison - Europe

12.3.1 Germany - Market size and forecast 2025-2030

Chart on Germany - Market size and forecast 2025-2030 ($ thousand)
Data Table on Germany - Market size and forecast 2025-2030 ($ thousand)
Chart on Germany - Year-over-year growth 2025-2030 (%)
Data Table on Germany - Year-over-year growth 2025-2030 (%)

12.3.2 France - Market size and forecast 2025-2030

Chart on France - Market size and forecast 2025-2030 ($ thousand)
Data Table on France - Market size and forecast 2025-2030 ($ thousand)
Chart on France - Year-over-year growth 2025-2030 (%)
Data Table on France - Year-over-year growth 2025-2030 (%)

12.3.3 The Netherlands - Market size and forecast 2025-2030

Chart on The Netherlands - Market size and forecast 2025-2030 ($ thousand)
Data Table on The Netherlands - Market size and forecast 2025-2030 ($ thousand)
Chart on The Netherlands - Year-over-year growth 2025-2030 (%)
Data Table on The Netherlands - Year-over-year growth 2025-2030 (%)

12.3.4 UK - Market size and forecast 2025-2030

Chart on UK - Market size and forecast 2025-2030 ($ thousand)
Data Table on UK - Market size and forecast 2025-2030 ($ thousand)
Chart on UK - Year-over-year growth 2025-2030 (%)
Data Table on UK - Year-over-year growth 2025-2030 (%)

12.3.5 Italy - Market size and forecast 2025-2030

Chart on Italy - Market size and forecast 2025-2030 ($ thousand)
Data Table on Italy - Market size and forecast 2025-2030 ($ thousand)
Chart on Italy - Year-over-year growth 2025-2030 (%)
Data Table on Italy - Year-over-year growth 2025-2030 (%)

12.3.6 Spain - Market size and forecast 2025-2030

Chart on Spain - Market size and forecast 2025-2030 ($ thousand)
Data Table on Spain - Market size and forecast 2025-2030 ($ thousand)
Chart on Spain - Year-over-year growth 2025-2030 (%)
Data Table on Spain - Year-over-year growth 2025-2030 (%)

12.4 North America - Market size and forecast 2025-2030

Chart on North America - Market size and forecast 2025-2030 ($ thousand)
Data Table on North America - Market size and forecast 2025-2030 ($ thousand)
Chart on North America - Year-over-year growth 2025-2030 (%)
Data Table on North America - Year-over-year growth 2025-2030 (%)
Chart on Regional Comparison - North America
Data Table on Regional Comparison - North America

12.4.1 US - Market size and forecast 2025-2030

Chart on US - Market size and forecast 2025-2030 ($ thousand)
Data Table on US - Market size and forecast 2025-2030 ($ thousand)
Chart on US - Year-over-year growth 2025-2030 (%)
Data Table on US - Year-over-year growth 2025-2030 (%)

12.4.2 Canada - Market size and forecast 2025-2030

Chart on Canada - Market size and forecast 2025-2030 ($ thousand)
Data Table on Canada - Market size and forecast 2025-2030 ($ thousand)
Chart on Canada - Year-over-year growth 2025-2030 (%)
Data Table on Canada - Year-over-year growth 2025-2030 (%)

12.4.3 Mexico - Market size and forecast 2025-2030

Chart on Mexico - Market size and forecast 2025-2030 ($ thousand)
Data Table on Mexico - Market size and forecast 2025-2030 ($ thousand)
Chart on Mexico - Year-over-year growth 2025-2030 (%)
Data Table on Mexico - Year-over-year growth 2025-2030 (%)

12.5 APAC - Market size and forecast 2025-2030

Chart on APAC - Market size and forecast 2025-2030 ($ thousand)
Data Table on APAC - Market size and forecast 2025-2030 ($ thousand)
Chart on APAC - Year-over-year growth 2025-2030 (%)
Data Table on APAC - Year-over-year growth 2025-2030 (%)
Chart on Regional Comparison - APAC
Data Table on Regional Comparison - APAC

12.5.1 China - Market size and forecast 2025-2030

Chart on China - Market size and forecast 2025-2030 ($ thousand)
Data Table on China - Market size and forecast 2025-2030 ($ thousand)
Chart on China - Year-over-year growth 2025-2030 (%)
Data Table on China - Year-over-year growth 2025-2030 (%)

12.5.2 Japan - Market size and forecast 2025-2030

Chart on Japan - Market size and forecast 2025-2030 ($ thousand)
Data Table on Japan - Market size and forecast 2025-2030 ($ thousand)
Chart on Japan - Year-over-year growth 2025-2030 (%)
Data Table on Japan - Year-over-year growth 2025-2030 (%)

12.5.3 Australia - Market size and forecast 2025-2030

Chart on Australia - Market size and forecast 2025-2030 ($ thousand)
Data Table on Australia - Market size and forecast 2025-2030 ($ thousand)
Chart on Australia - Year-over-year growth 2025-2030 (%)
Data Table on Australia - Year-over-year growth 2025-2030 (%)

12.5.4 India - Market size and forecast 2025-2030

Chart on India - Market size and forecast 2025-2030 ($ thousand)
Data Table on India - Market size and forecast 2025-2030 ($ thousand)
Chart on India - Year-over-year growth 2025-2030 (%)
Data Table on India - Year-over-year growth 2025-2030 (%)

12.5.5 South Korea - Market size and forecast 2025-2030

Chart on South Korea - Market size and forecast 2025-2030 ($ thousand)
Data Table on South Korea - Market size and forecast 2025-2030 ($ thousand)
Chart on South Korea - Year-over-year growth 2025-2030 (%)
Data Table on South Korea - Year-over-year growth 2025-2030 (%)

12.5.6 Indonesia - Market size and forecast 2025-2030

Chart on Indonesia - Market size and forecast 2025-2030 ($ thousand)
Data Table on Indonesia - Market size and forecast 2025-2030 ($ thousand)
Chart on Indonesia - Year-over-year growth 2025-2030 (%)
Data Table on Indonesia - Year-over-year growth 2025-2030 (%)

12.6 South America - Market size and forecast 2025-2030

Chart on South America - Market size and forecast 2025-2030 ($ thousand)
Data Table on South America - Market size and forecast 2025-2030 ($ thousand)
Chart on South America - Year-over-year growth 2025-2030 (%)
Data Table on South America - Year-over-year growth 2025-2030 (%)
Chart on Regional Comparison - South America
Data Table on Regional Comparison - South America

12.6.1 Brazil - Market size and forecast 2025-2030

Chart on Brazil - Market size and forecast 2025-2030 ($ thousand)
Data Table on Brazil - Market size and forecast 2025-2030 ($ thousand)
Chart on Brazil - Year-over-year growth 2025-2030 (%)
Data Table on Brazil - Year-over-year growth 2025-2030 (%)

12.6.2 Argentina - Market size and forecast 2025-2030

Chart on Argentina - Market size and forecast 2025-2030 ($ thousand)
Data Table on Argentina - Market size and forecast 2025-2030 ($ thousand)
Chart on Argentina - Year-over-year growth 2025-2030 (%)
Data Table on Argentina - Year-over-year growth 2025-2030 (%)

12.6.3 Chile - Market size and forecast 2025-2030

Chart on Chile - Market size and forecast 2025-2030 ($ thousand)
Data Table on Chile - Market size and forecast 2025-2030 ($ thousand)
Chart on Chile - Year-over-year growth 2025-2030 (%)
Data Table on Chile - Year-over-year growth 2025-2030 (%)

12.7 Middle East and Africa - Market size and forecast 2025-2030

Chart on Middle East and Africa - Market size and forecast 2025-2030 ($ thousand)
Data Table on Middle East and Africa - Market size and forecast 2025-2030 ($ thousand)
Chart on Middle East and Africa - Year-over-year growth 2025-2030 (%)
Data Table on Middle East and Africa - Year-over-year growth 2025-2030 (%)
Chart on Regional Comparison - Middle East and Africa
Data Table on Regional Comparison - Middle East and Africa

12.7.1 Israel - Market size and forecast 2025-2030

Chart on Israel - Market size and forecast 2025-2030 ($ thousand)
Data Table on Israel - Market size and forecast 2025-2030 ($ thousand)
Chart on Israel - Year-over-year growth 2025-2030 (%)
Data Table on Israel - Year-over-year growth 2025-2030 (%)

12.7.2 Saudi Arabia - Market size and forecast 2025-2030

Chart on Saudi Arabia - Market size and forecast 2025-2030 ($ thousand)
Data Table on Saudi Arabia - Market size and forecast 2025-2030 ($ thousand)
Chart on Saudi Arabia - Year-over-year growth 2025-2030 (%)
Data Table on Saudi Arabia - Year-over-year growth 2025-2030 (%)

12.7.3 UAE - Market size and forecast 2025-2030

Chart on UAE - Market size and forecast 2025-2030 ($ thousand)
Data Table on UAE - Market size and forecast 2025-2030 ($ thousand)
Chart on UAE - Year-over-year growth 2025-2030 (%)
Data Table on UAE - Year-over-year growth 2025-2030 (%)

12.7.4 South Africa - Market size and forecast 2025-2030

Chart on South Africa - Market size and forecast 2025-2030 ($ thousand)
Data Table on South Africa - Market size and forecast 2025-2030 ($ thousand)
Chart on South Africa - Year-over-year growth 2025-2030 (%)
Data Table on South Africa - Year-over-year growth 2025-2030 (%)

12.7.5 Morocco - Market size and forecast 2025-2030

Chart on Morocco - Market size and forecast 2025-2030 ($ thousand)
Data Table on Morocco - Market size and forecast 2025-2030 ($ thousand)
Chart on Morocco - Year-over-year growth 2025-2030 (%)
Data Table on Morocco - Year-over-year growth 2025-2030 (%)

12.8 Market opportunity by geography

Market opportunity by geography ($ thousand)
Data Tables on Market opportunity by geography ($ thousand)

13. Drivers, Challenges, and Opportunity

13.1 Market drivers

Persistent agricultural labor scarcity and escalating wage costs
Growing emphasis on sustainable agriculture and stricter herbicide regulations
Accelerated advancements in AI, machine vision, and robotics

13.2 Market challenges

High initial cost and financial barriers to adoption
Technical complexity and operational reliability
Lack of standardization and integration with existing farm ecosystems

13.3 Impact of drivers and challenges

Impact of drivers and challenges in 2025 and 2030

13.4 Market opportunities

Emergence of robots as service and subscription-based models
Integration of data analytics for precision agronomy
Development of modular and autonomous-ready platforms

14. Competitive Landscape

14.1 Overview

14.2

Overview on criticality of inputs and factors of differentiation

14.3 Landscape disruption

Overview on factors of disruption

14.4 Industry risks

Impact of key risks on business

15. Competitive Analysis

15.1 Companies profiled

Companies covered

15.2 Company ranking index

15.3 Market positioning of companies

Matrix on companies position and classification

15.4 Burro Robots

Burro Robots - Overview
Burro Robots - Product / Service
Burro Robots - Key offerings
SWOT

15.5 Carbon Robotics

Carbon Robotics - Overview
Carbon Robotics - Product / Service
Carbon Robotics - Key offerings
SWOT

15.6 Deere and Co.

Deere and Co. - Overview
Deere and Co. - Business segments
Deere and Co. - Key offerings
Deere and Co. - Segment focus
SWOT

15.7 EcoRobotix SA

EcoRobotix SA - Overview
EcoRobotix SA - Product / Service
EcoRobotix SA - Key offerings
SWOT

15.8 FarmDroid

FarmDroid - Overview
FarmDroid - Product / Service
FarmDroid - Key offerings
SWOT

15.9 Kubota Corp.

Kubota Corp. - Overview
Kubota Corp. - Business segments
Kubota Corp. - Key offerings
Kubota Corp. - Segment focus
SWOT

15.10 Naio Technologies SAS

Naio Technologies SAS - Overview
Naio Technologies SAS - Product / Service
Naio Technologies SAS - Key offerings
SWOT

15.11 Saga Robotics

Saga Robotics - Overview
Saga Robotics - Product / Service
Saga Robotics - Key offerings
SWOT

15.12 Solinftec

Solinftec - Overview
Solinftec - Product / Service
Solinftec - Key offerings
SWOT

15.13 SwarmFarm Robotics

SwarmFarm Robotics - Overview
SwarmFarm Robotics - Product / Service
SwarmFarm Robotics - Key offerings
SWOT

15.14 Tertill Corp

Tertill Corp - Overview
Tertill Corp - Product / Service
Tertill Corp - Key offerings
SWOT

15.15 Trimble Inc.

Trimble Inc. - Overview
Trimble Inc. - Business segments
Trimble Inc. - Key offerings
Trimble Inc. - Segment focus
SWOT

15.16 Verdant Robotics

Verdant Robotics - Overview
Verdant Robotics - Product / Service
Verdant Robotics - Key offerings
SWOT

15.17 VitiBot

VitiBot - Overview
VitiBot - Product / Service
VitiBot - Key offerings
SWOT

15.18 Yanmar Holdings Co. Ltd.

Yanmar Holdings Co. Ltd. - Overview
Yanmar Holdings Co. Ltd. - Product / Service
Yanmar Holdings Co. Ltd. - Key offerings
SWOT

16. Appendix

16.1 Scope of the report

Market definition
Objectives
Notes and caveats

16.2 Inclusions and exclusions checklist

Inclusions checklist
Exclusions checklist

16.3 Currency conversion rates for US$

16.4 Research methodology

16.5 Data procurement

Information sources

16.6 Data validation

16.7 Validation techniques employed for market sizing

16.8 Data synthesis

16.9 360 degree market analysis

16.10 List of abbreviations

Research Methodology

Technavio presents a detailed picture of the market by way of study, synthesis, and summation of data from multiple sources. The analysts have presented the various facets of the market with a particular focus on identifying the key industry influencers. The data thus presented is comprehensive, reliable, and the result of extensive research, both primary and secondary.

INFORMATION SOURCES

Primary sources

  • Manufacturers and suppliers
  • Channel partners
  • Industry experts
  • Strategic decision makers

Secondary sources

  • Industry journals and periodicals
  • Government data
  • Financial reports of key industry players
  • Historical data
  • Press releases

DATA ANALYSIS

Data Synthesis

  • Collation of data
  • Estimation of key figures
  • Analysis of derived insights

Data Validation

  • Triangulation with data models
  • Reference against proprietary databases
  • Corroboration with industry experts

REPORT WRITING

Qualitative

  • Market drivers
  • Market challenges
  • Market trends
  • Five forces analysis

Quantitative

  • Market size and forecast
  • Market segmentation
  • Geographical insights
  • Competitive landscape

Interested in this report?

Get your sample now to see our research methodology and insights!

Download Now

Frequently Asked Questions

Robotic Weeding Machines market growth will increase by USD 367241.0 thousand thousand during 2026-2030.

The Robotic Weeding Machines market is expected to grow at a CAGR of 18.4% during 2026-2030.

Robotic Weeding Machines market is segmented by Component (Hardware, Software, Service) Application (Row crops, Horticulture, Vineyards and orchard farming, Others) End-user (Small farms, Medium farms, Large farms)

Agrointelli, Burro Robots, Carbon Robotics, Deere and Co., EcoRobotix SA, Exxact Robotics, FarmDroid, Kubota Corp., Naio Technologies SAS, Pixelfarming Robotics, Saga Robotics, Solinftec, Stout Industrial Technology, SwarmFarm Robotics, Tensorfield Agriculture, Tertill Corp, Trimble Inc., Verdant Robotics, VitiBot, Yanmar Holdings Co. Ltd. are a few of the key vendors in the Robotic Weeding Machines market.

Europe will register the highest growth rate of 46.2% among the other regions. Therefore, the Robotic Weeding Machines market in Europe is expected to garner significant business opportunities for the vendors during the forecast period.

Germany, France, The Netherlands, UK, Italy, Spain, US, Canada, Mexico, China, Japan, Australia, India, South Korea, Indonesia, Brazil, Argentina, Chile, Israel, Saudi Arabia, UAE, South Africa, Morocco

  • Persistent agricultural labor scarcity and escalating wage costs is the driving factor this market.

The Robotic Weeding Machines market vendors should focus on grabbing business opportunities from the Component segment as it accounted for the largest market share in the base year.
RIA - Research AI Assistant
Ask RIA
