Agriculture Equipment Market Analysis, Size, and Forecast 2024-2028: North America (US and Canada), Europe (France, Germany, Italy, and UK), Middle East and Africa (Egypt, KSA, Oman, and UAE), APAC (China, India, and Japan), South America (Argentina and Brazil), and Rest of World (ROW)

Agriculture Equipment Market Analysis, Size, and Forecast 2024-2028:
North America (US and Canada), Europe (France, Germany, Italy, and UK), Middle East and Africa (Egypt, KSA, Oman, and UAE), APAC (China, India, and Japan), South America (Argentina and Brazil), and Rest of World (ROW)

Published: Mar 2024 160 Pages SKU: IRTNTR77819

Market Overview at a Glance

$66.53 B
Market Opportunity
6.05%
CAGR
5.02
YoY growth 2023-2024(%)

Agriculture Equipment Market Size 2024-2028

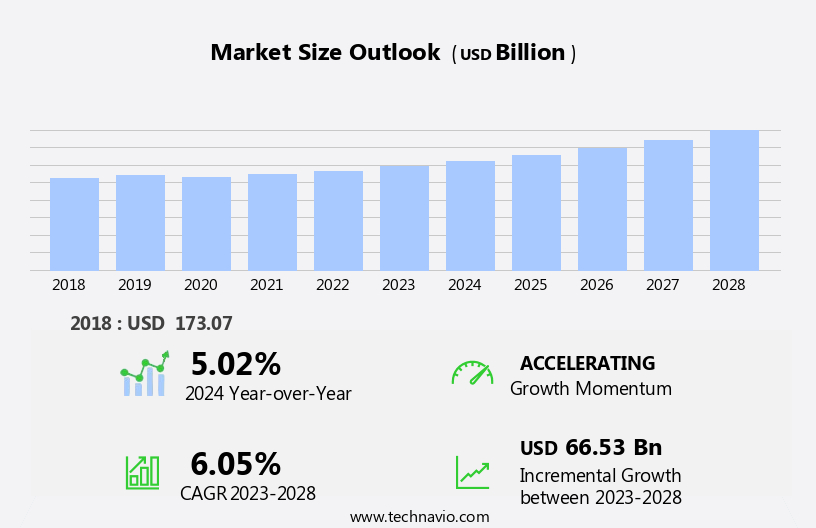
The agriculture equipment market size is forecast to increase by USD 66.53 billion at a CAGR of 6.05% between 2023 and 2028.

  • The market is experiencing significant growth due to the increasing demand for labor-saving technologies as a result of the persistent labor shortage in the agricultural sector. This trend is driving the market as farmers seek to increase productivity and efficiency on their farms. Another key driver is the implementation of Artificial Intelligence (AI) in agriculture equipment, which is revolutionizing farming practices by enabling precision farming, automated crop monitoring, and real-time analysis of soil and weather conditions. Furthermore, the growing availability of rental agricultural equipment is providing farmers with flexible access to advanced technology and reducing the upfront costs of equipment ownership.
  • However, the market faces challenges such as high initial investment costs for advanced technology and the need for significant infrastructure upgrades to support the integration of AI in farming operations. Additionally, regulatory compliance and data security concerns pose challenges for market players, requiring them to invest in robust IT systems and adhere to strict data privacy regulations. Companies seeking to capitalize on market opportunities and navigate challenges effectively should focus on developing innovative solutions that address the specific needs of farmers, while also ensuring compliance with regulatory requirements and maintaining strong cybersecurity measures.

What will be the Size of the Agriculture Equipment Market during the forecast period?

Agriculture Equipment Market Size

 Request Free Sample

  • The market continues to evolve, driven by advancements in technology and shifting farming practices. Commercial farms and small-scale operations alike embrace precision agriculture technology, integrating GPS guidance, variable rate application, and satellite imagery for optimized crop production. Organic farming practices gain traction, with the adoption of no-till farming and conservation tillage promoting soil health and sustainability. Remote sensing and agricultural robotics revolutionize land management, enabling real-time crop health monitoring and emissions reduction. Irrigation systems and crop science advancements contribute to increased farm efficiency and food security. The dealer network adapts to these changes, offering financing options and parts and service for the latest equipment.
  • Farm labor and agricultural finance remain crucial components, with farm management software streamlining operations and agricultural research driving innovation. Sustainable farming practices, including sustainable agriculture and sustainable farming practices, gain importance in the face of evolving regulations and consumer demand. Emissions reduction and fuel efficiency are key concerns, with the integration of machine learning and artificial intelligence in agricultural development. The ongoing unfolding of market activities reveals a dynamic industry that seamlessly integrates crop science, farm efficiency, and agricultural research to meet the needs of modern farming operations.

How is this Agriculture Equipment Industry segmented?

The agriculture equipment industry research report provides comprehensive data (region-wise segment analysis), with forecasts and estimates in "USD billion" for the period 2024-2028, as well as historical data from 2018-2022 for the following segments.

  • Type
    • Tractors
    • Harvesters machinery
    • Planting equipment
    • Others
  • Product Type
    • Manual
    • Automatic
    • Semi-automatic
  • Application
    • Land Development
    • Crop Cultivation
    • Harvesting
    • Post-Harvest Processing
  • End-User
    • Large-Scale Farms
    • Small and Medium Farms
    • Agricultural Cooperatives
  • Geography
    • North America
      • US
      • Canada
    • Europe
      • France
      • Germany
      • Italy
      • UK
    • Middle East and Africa
      • Egypt
      • KSA
      • Oman
      • UAE
    • APAC
      • China
      • India
      • Japan
    • South America
      • Argentina
      • Brazil
    • Rest of World (ROW)

By Type Insights

The tractors segment is estimated to witness significant growth during the forecast period.

The market is witnessing significant trends as farmers adopt advanced technologies to enhance crop health monitoring, comply with agricultural regulations, and improve weather forecasting for optimal land management. Small farms are increasingly adopting precision agriculture practices, including variable rate application, GPS guidance, satellite imagery, and conservation tillage, to boost farm efficiency and reduce emissions. Commercial farms are investing in large-scale equipment for planting, harvesting, and irrigation systems, while family farms focus on sustainable agriculture practices, such as organic farming and crop rotation, to maintain farmland values and promote food security. Advancements in precision farming technology, including remote sensing, agricultural robotics, and farm management software, are driving the demand for sophisticated, larger, and more powerful tractors.

However, the market is also witnessing a rise in demand for smaller, specialized tractors for specific applications, such as no-till farming and hay equipment, which can fit into tight spaces and narrow rows. These tractors, including wheeled and crawler types, offer advantages in certain conditions due to their simplicity and maneuverability. Farmers are also adopting new technologies to optimize crop production, such as genetically modified organisms, seed technology, and yield monitoring, to enhance crop science and improve yield optimization. Additionally, farmers are focusing on reducing fuel efficiency and implementing sustainable farming practices, such as conservation tillage and crop rotation, to minimize their environmental footprint and promote long-term agricultural development.

The dealer network plays a crucial role in the market, providing parts and service to farmers and ensuring equipment maintenance and safety. Agricultural finance and lease agreements are also essential for farmers to acquire the latest equipment and technology, enabling them to remain competitive and profitable in the industry. Overall, the market is evolving to meet the changing needs of farmers, with a focus on innovation, sustainability, and efficiency.

Agriculture Equipment Market Size

Request Free Sample

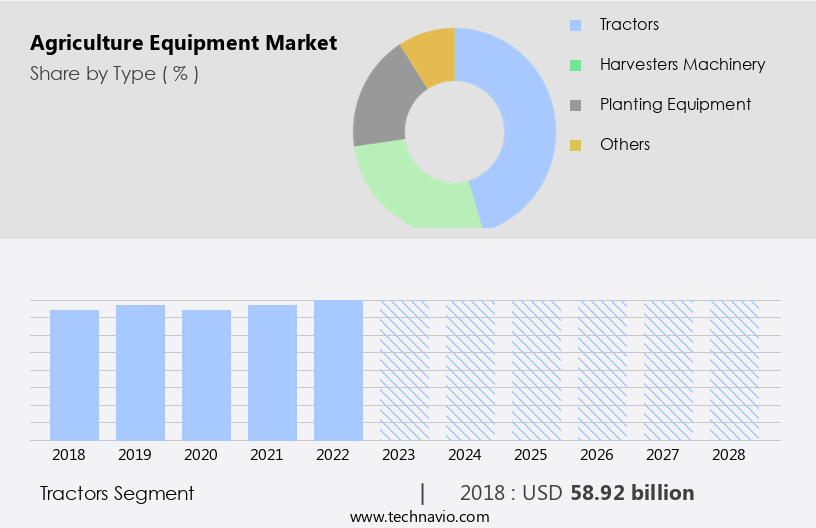
The Tractors segment was valued at USD 58.92 billion in 2018 and showed a gradual increase during the forecast period.

Regional Analysis

North America is estimated to contribute 31% to the growth of the global market during the forecast period.Technavio's analysts have elaborately explained the regional trends and drivers that shape the market during the forecast period.

Agriculture Equipment Market Share by Geography

 Request Free Sample

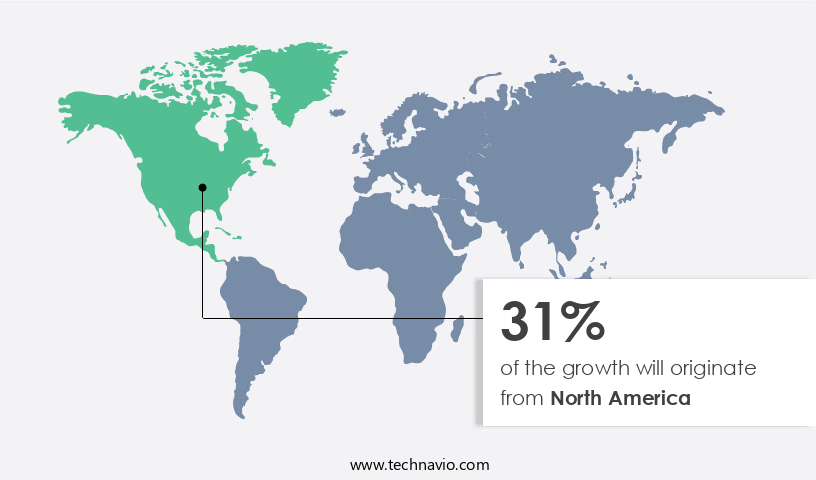
The market in North America, encompassing the United States and Canada, experiences significant growth driven by government initiatives and labor shortages. Farmers in these countries receive financial assistance from various agricultural bodies and governments, including the USDA's Farm Service Agency, which offers direct farm operating loans of up to USD400,000. This mechanization of agriculture is further facilitated by advancements in technology, such as precision agriculture, remote sensing, and agricultural robotics. These technologies enable farmers to optimize crop yields, reduce emissions, and improve farm efficiency through practices like variable rate application, GPS guidance, satellite imagery, and soil sensors.

Additionally, the market is influenced by the increasing trend towards sustainable farming practices, including no-till farming, conservation tillage, and organic farming. Farmers are also adopting advanced farm management software, crop production techniques, and agricultural data management systems to enhance their operations. Commercial and family farms alike invest in farm machinery, lease agreements, and equipment maintenance to keep up with the demands of modern agriculture. The market for agriculture equipment is vast, encompassing planting and harvesting equipment, irrigation systems, fuel efficiency technologies, and livestock farming equipment. As the market continues to evolve, agricultural research, plant breeding, and artificial intelligence play crucial roles in driving innovation and improving farm productivity.

Market Dynamics

Our researchers analyzed the data with 2023 as the base year, along with the key drivers, trends, and challenges. A holistic analysis of drivers will help companies refine their marketing strategies to gain a competitive advantage.

What are the key market drivers leading to the rise in the adoption of Agriculture Equipment Industry?

  • The labor shortage leading to a surge in demand for agricultural equipment serves as the primary market driver. 
  • The agricultural sector, a significant employer for the global rural population, faces a labor shortage issue. This trend is prevalent in countries like India and South Africa, where urban migration has led to a decrease in the availability of agricultural labor. In the US, rural areas, particularly in Ohio and Pennsylvania, experience acute labor shortages, with many local workers disinterested in farm-related work. Consequently, labor costs have risen, driving small farm holders to invest in agriculture machinery. Advancements in technology are also influencing the agriculture sector. Precision farming, crop protection, and livestock farming have seen significant growth due to the adoption of farm management software, agricultural data management, and sustainable farming practices.
  • Artificial intelligence, machine learning, and data analytics are being integrated into farming operations to optimize crop production and improve farmland values. Moreover, the implementation of sustainable farming practices is gaining traction, with farmers focusing on crop rotation and other eco-friendly methods to reduce their carbon footprint. Farm equipment financing options are also becoming more accessible, making it easier for farmers to invest in modern machinery. Overall, the agriculture sector is undergoing a transformation, driven by labor shortages, technological advancements, and a shift towards sustainable farming practices.

What are the market trends shaping the Agriculture Equipment Industry?

  • The integration of artificial intelligence (AI) technology in agriculture equipment is an emerging market trend. This innovation aims to enhance the efficiency and productivity of farming operations.
  • Artificial intelligence (AI) is revolutionizing the agriculture sector with advanced equipment that enhances crop production and real-time monitoring. AI technology enables automated systems, such as self-driving tractors and drones, to optimize land management through variable rate application, GPS guidance, satellite imagery, and weather forecasting. These technologies promote sustainable agriculture practices like no-till farming, conservation tillage, and organic farming. AI implementation in self-driving combines ensures safety and continuous learning through self-collected data. Crop health monitoring and soil content sensing improve overall farm productivity.
  • Agricultural regulations are increasingly emphasizing the importance of these advanced technologies to maintain crop health and ensure regulatory compliance. Farm subsidies and incentives may encourage small farm adoption of AI-based agriculture equipment. AI technology is a game-changer in agriculture, offering significant benefits to farmers through increased efficiency, productivity, and sustainability.

What challenges does the Agriculture Equipment Industry face during its growth?

  • The expansion of rental agricultural equipment options poses a significant challenge to the industry's growth trajectory. 
  • Agriculture equipment plays a vital role in the productivity and efficiency of commercial farms, encompassing a range of machinery such as tractors, harvesting tools, mower conditioners, tillage tools, and irrigation systems. However, the high cost of purchasing and maintaining this equipment poses a challenge for farmers, particularly those employing organic farming practices and focusing on farm efficiency, emissions reduction, and agricultural development. To address this challenge, the rental market for agriculture equipment has gained traction. Farmers can rent equipment for specific periods, enabling them to offset the expense of maintenance and obtain the latest precision agriculture technology, including remote sensing and agricultural robotics, to optimize crop science and farm labor.
  • Lease agreements offer farmers the flexibility to access advanced farm machinery without the need for substantial upfront payments. Agricultural finance institutions facilitate the leasing process, providing farmers with financial solutions tailored to their unique needs. This not only enhances farm efficiency but also ensures farmers can invest in other areas crucial to their business growth. Overall, the agriculture equipment rental market caters to the evolving needs of farmers, allowing them to stay competitive while maintaining financial stability.

Exclusive Customer Landscape

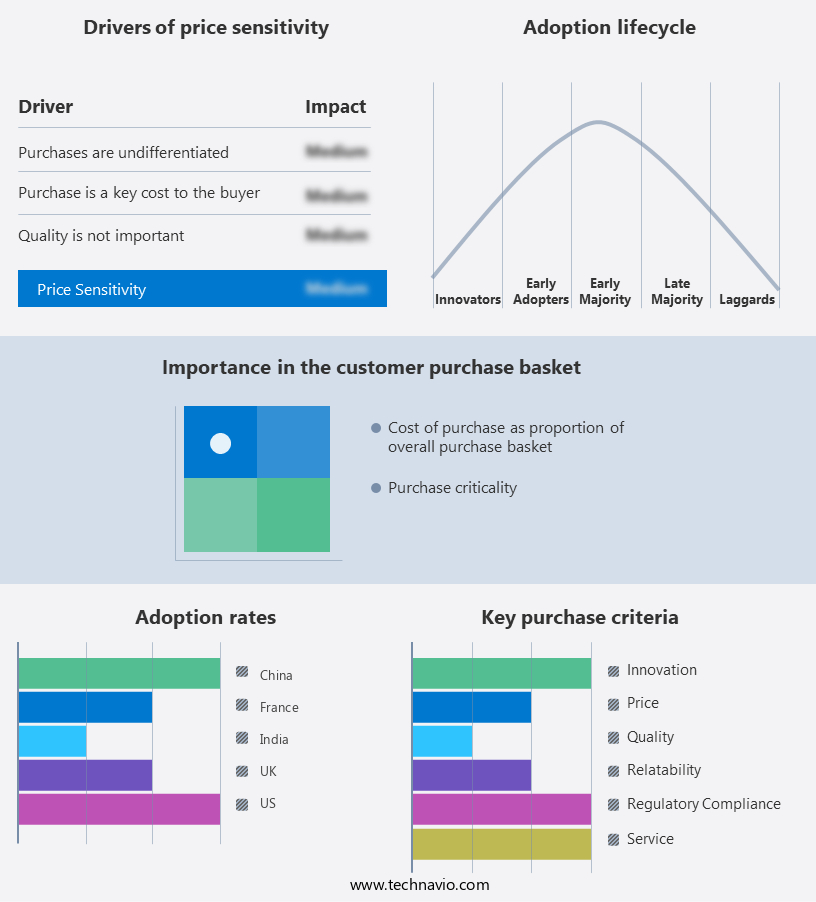
The agriculture equipment market forecasting report includes the adoption lifecycle of the market, covering from the innovator's stage to the laggard's stage. It focuses on adoption rates in different regions based on penetration. Furthermore, the agriculture equipment market report also includes key purchase criteria and drivers of price sensitivity to help companies evaluate and develop their market growth analysis strategies.

Agriculture Equipment Market Share by Geography

 Customer Landscape

Key Companies & Market Insights

Companies are implementing various strategies, such as strategic alliances, agriculture equipment market forecast, partnerships, mergers and acquisitions, geographical expansion, and product/service launches, to enhance their presence in the industry.

Deere & Company (United States) - The company specializes in agriculture equipment, providing innovative solutions through renowned brands such as Challenger, Fendt, Massey Ferguson, Valtra, Fella, White Planters, and Sunflower. Our extensive product range includes tractors and feeders, catering to diverse farming needs. These brands are recognized globally for their quality, reliability, and advanced technology. By offering these solutions, we aim to enhance agricultural productivity and efficiency, ultimately contributing to sustainable farming practices.

The industry research and growth report includes detailed analyses of the competitive landscape of the market and information about key companies, including:

  • Deere & Company (United States)
  • CNH Industrial (United Kingdom)
  • AGCO Corporation (United States)
  • Kubota Corporation (Japan)
  • Mahindra & Mahindra (India)
  • CLAAS KGaA (Germany)
  • Escorts Limited (India)
  • Yanmar Holdings (Japan)
  • Bucher Industries (Switzerland)
  • SDF Group (Italy)
  • Alamo Group (United States)
  • Iseki & Co. (Japan)
  • Daedong Industrial (South Korea)
  • Lovol Heavy Industry (China)
  • Exel Industries (France)
  • JCB (United Kingdom)
  • Tafe (India)
  • Zoomlion Heavy Industry (China)
  • Argo Tractors (Italy)
  • Kinze Manufacturing (United States)

Qualitative and quantitative analysis of companies has been conducted to help clients understand the wider business environment as well as the strengths and weaknesses of key industry players. Data is qualitatively analyzed to categorize companies as pure play, category-focused, industry-focused, and diversified; it is quantitatively analyzed to categorize companies as dominant, leading, strong, tentative, and weak.

Recent Development and News in Agriculture Equipment Market

  • In January 2024, John Deere, a leading agriculture equipment manufacturer, introduced its new precision farming solution, "SmartFarm 3.0." This advanced technology offers real-time data analysis and predictive maintenance, aiming to boost farm productivity and efficiency (John Deere Press Release).
  • In March 2025, AGCO and CNH Industrial, two major agriculture equipment players, announced a strategic partnership to jointly develop electric and autonomous farm equipment. This collaboration aims to reduce emissions and enhance farming efficiency, setting new industry standards (CNH Industrial & AGCO Press Release).
  • In July 2024, Trimble, a technology provider, acquired MuleSoft for approximately USD1.4 billion. This acquisition will enable Trimble to integrate its agriculture software solutions with other business systems, providing farmers with a more comprehensive and seamless digital farming experience (Trimble Press Release).
  • In October 2025, the European Union approved the new Common Agricultural Policy (CAP) for the 2023-2027 period. The new policy includes a significant investment in digital agriculture, with a focus on precision farming, satellite technology, and data management, aiming to increase the competitiveness and sustainability of European agriculture (European Commission Press Release).

Research Analyst Overview

In the dynamic agriculture sector, digital agriculture is revolutionizing farming practices with advanced technologies such as robotic harvesting, gene editing, and agricultural analytics. Soil health monitoring is a critical aspect of digital agriculture, ensuring sustainable food production through the use of agricultural sensor networks and IoT. Agricultural biotechnology, including crop genomics and yield prediction, is another key trend, driving innovation in climate-smart agriculture. Farm automation, urban agriculture, and vertical farming are transforming the agricultural landscape, enabling local food production and reducing the carbon footprint of the agricultural supply chain. Smart farming, farm management apps, and agricultural data platforms are streamlining farm operations, improving farm risk management, and enhancing farm insurance offerings.

Precision spraying, variable rate seeding, and carbon sequestration are essential components of sustainable farming practices, ensuring efficient use of resources and reducing environmental impact. Regenerative agriculture and food security solutions are gaining traction as farmers seek to mitigate climate risks and ensure long-term sustainability. The integration of greenhouse technology, farm automation, and agricultural IoT is enabling farmers to optimize crop growth and minimize waste, while farm management apps and agricultural data platforms provide real-time insights into farm operations. Overall, these trends are shaping the future of agricultural economics and ensuring a more resilient and sustainable food production system.

Dive into Technavio's robust research methodology, blending expert interviews, extensive data synthesis, and validated models for unparalleled Agriculture Equipment Market insights. See full methodology.

Market Scope

Report Coverage

Details

Page number

160

Base year

2023

Historic period

2018-2022

Forecast period

2024-2028

Growth momentum & CAGR

Accelerate at a CAGR of 6.05%

Market growth 2024-2028

USD 66.53 billion

Market structure

Fragmented

YoY growth 2023-2024(%)

5.02

Key countries

US, Canada, Germany, UK, Italy, France, China, India, Japan, Egypt, Oman, Argentina, KSA, UAE, and Brazil

Competitive landscape

Leading Companies, Market Positioning of Companies, Competitive Strategies, and Industry Risks

Request Free Sample

What are the Key Data Covered in this Agriculture Equipment Market Research and Growth Report?

  • CAGR of the Agriculture Equipment industry during the forecast period
  • Detailed information on factors that will drive the growth and forecasting between 2024 and 2028
  • Precise estimation of the size of the market and its contribution of the industry in focus to the parent market
  • Accurate predictions about upcoming growth and trends and changes in consumer behaviour
  • Growth of the market across North America, Europe, APAC, South America, and Middle East and Africa
  • Thorough analysis of the market's competitive landscape and detailed information about companies
  • Comprehensive analysis of factors that will challenge the agriculture equipment market growth of industry companies

We can help! Our analysts can customize this agriculture equipment market research report to meet your requirements.

Get in touch

1 Executive Summary

  • 1.1 Market overview
    • Exhibit 01: Executive Summary – Chart on Market Overview
    • Exhibit 02: Executive Summary – Data Table on Market Overview
    • Exhibit 03: Executive Summary – Chart on Global Market Characteristics
    • Exhibit 04: Executive Summary – Chart on Market by Geography
    • Exhibit 05: Executive Summary – Chart on Market Segmentation by Type
    • Exhibit 06: Executive Summary – Chart on Market Segmentation by Product Type
    • Exhibit 07: Executive Summary – Chart on Incremental Growth
    • Exhibit 08: Executive Summary – Data Table on Incremental Growth
    • Exhibit 09: Executive Summary – Chart on Vendor Market Positioning

2 Market Landscape

  • 2.1 Market ecosystem
    • Exhibit 10: Parent market
    • Exhibit 11: Market Characteristics

3 Market Sizing

  • 3.1 Market definition
    • Exhibit 12: Offerings of vendors included in the market definition
  • 3.2 Market segment analysis
    • Exhibit 13: Market segments
  • 3.3 Market size 2023
    • 3.4 Market outlook: Forecast for 2023-2028
      • Exhibit 14: Chart on Global - Market size and forecast 2023-2028 ($ billion)
      • Exhibit 15: Data Table on Global - Market size and forecast 2023-2028 ($ billion)
      • Exhibit 16: Chart on Global Market: Year-over-year growth 2023-2028 (%)
      • Exhibit 17: Data Table on Global Market: Year-over-year growth 2023-2028 (%)

    4 Historic Market Size

    • 4.1 Global agriculture equipment market 2018 - 2022
      • Exhibit 18: Historic Market Size – Data Table on global agriculture equipment market 2018 - 2022 ($ billion)
    • 4.2 Type Segment Analysis 2018 - 2022
      • Exhibit 19: Historic Market Size – Type Segment 2018 - 2022 ($ billion)
    • 4.3 Product type Segment Analysis 2018 - 2022
      • Exhibit 20: Historic Market Size – Product type Segment 2018 - 2022 ($ billion)
    • 4.4 Geography Segment Analysis 2018 - 2022
      • Exhibit 21: Historic Market Size – Geography Segment 2018 - 2022 ($ billion)
    • 4.5 Country Segment Analysis 2018 - 2022
      • Exhibit 22: Historic Market Size – Country Segment 2018 - 2022 ($ billion)

    5 Five Forces Analysis

    • 5.1 Five forces summary
      • Exhibit 23: Five forces analysis - Comparison between 2023 and 2028
    • 5.2 Bargaining power of buyers
      • Exhibit 24: Chart on Bargaining power of buyers – Impact of key factors 2023 and 2028
    • 5.3 Bargaining power of suppliers
      • Exhibit 25: Bargaining power of suppliers – Impact of key factors in 2023 and 2028
    • 5.4 Threat of new entrants
      • Exhibit 26: Threat of new entrants – Impact of key factors in 2023 and 2028
    • 5.5 Threat of substitutes
      • Exhibit 27: Threat of substitutes – Impact of key factors in 2023 and 2028
    • 5.6 Threat of rivalry
      • Exhibit 28: Threat of rivalry – Impact of key factors in 2023 and 2028
    • 5.7 Market condition
      • Exhibit 29: Chart on Market condition - Five forces 2023 and 2028

    6 Market Segmentation by Type

    • 6.1 Market segments
      • Chart on Type - Market share (2023-2028) (%)
      • Data Table on Type - Market share (2023-2028) (%)
    • 6.2 Comparison by Type
      • Chart on Comparison by Type
      • Data Table on Comparison by Type
    • 6.3 Tractors - Market size and forecast (2023-2028)
      • Chart on Tractors - Market size and forecast (2023-2028) ($ billion)
      • Data Table on Tractors - Market size and forecast (2023-2028) ($ billion)
      • Chart on Tractors - Year-over-year growth (2023-2028) (%)
      • Data Table on Tractors - Year-over-year growth (2023-2028) (%)
    • 6.4 Harvesters machinery - Market size and forecast (2023-2028)
      • Chart on Harvesters machinery - Market size and forecast (2023-2028) ($ billion)
      • Data Table on Harvesters machinery - Market size and forecast (2023-2028) ($ billion)
      • Chart on Harvesters machinery - Year-over-year growth (2023-2028) (%)
      • Data Table on Harvesters machinery - Year-over-year growth (2023-2028) (%)
    • 6.5 Planting equipment - Market size and forecast (2023-2028)
      • Chart on Planting equipment - Market size and forecast (2023-2028) ($ billion)
      • Data Table on Planting equipment - Market size and forecast (2023-2028) ($ billion)
      • Chart on Planting equipment - Year-over-year growth (2023-2028) (%)
      • Data Table on Planting equipment - Year-over-year growth (2023-2028) (%)
    • 6.6 Others - Market size and forecast (2023-2028)
      • Chart on Others - Market size and forecast (2023-2028) ($ billion)
      • Data Table on Others - Market size and forecast (2023-2028) ($ billion)
      • Chart on Others - Year-over-year growth (2023-2028) (%)
      • Data Table on Others - Year-over-year growth (2023-2028) (%)
    • 6.7 Market opportunity by Type
      • Market opportunity by Type ($ billion)
      • Data Table on Market opportunity by Type ($ billion)

    7 Market Segmentation by Product Type

    • 7.1 Market segments
      • Chart on Product Type - Market share (2023-2028) (%)
      • Data Table on Product Type - Market share (2023-2028) (%)
    • 7.2 Comparison by Product Type
      • Chart on Comparison by Product Type
      • Data Table on Comparison by Product Type
    • 7.3 Manual - Market size and forecast (2023-2028)
      • Chart on Manual - Market size and forecast (2023-2028) ($ billion)
      • Data Table on Manual - Market size and forecast (2023-2028) ($ billion)
      • Chart on Manual - Year-over-year growth (2023-2028) (%)
      • Data Table on Manual - Year-over-year growth (2023-2028) (%)
    • 7.4 Automatic - Market size and forecast (2023-2028)
      • Chart on Automatic - Market size and forecast (2023-2028) ($ billion)
      • Data Table on Automatic - Market size and forecast (2023-2028) ($ billion)
      • Chart on Automatic - Year-over-year growth (2023-2028) (%)
      • Data Table on Automatic - Year-over-year growth (2023-2028) (%)
    • 7.5 Semi-automatic - Market size and forecast (2023-2028)
      • Chart on Semi-automatic - Market size and forecast (2023-2028) ($ billion)
      • Data Table on Semi-automatic - Market size and forecast (2023-2028) ($ billion)
      • Chart on Semi-automatic - Year-over-year growth (2023-2028) (%)
      • Data Table on Semi-automatic - Year-over-year growth (2023-2028) (%)
    • 7.6 Market opportunity by Product Type
      • Market opportunity by Product Type ($ billion)
      • Data Table on Market opportunity by Product Type ($ billion)

    8 Market Segmentation by Application

    • 8.1 Market segments
      • Chart on Application - Market share (2023-2028) (%)
      • Data Table on Application - Market share (2023-2028) (%)
    • 8.2 Comparison by Application
      • Chart on Comparison by Application
      • Data Table on Comparison by Application
    • 8.3 Land Development - Market size and forecast (2023-2028)
      • Chart on Land Development - Market size and forecast (2023-2028) ($ billion)
      • Data Table on Land Development - Market size and forecast (2023-2028) ($ billion)
      • Chart on Land Development - Year-over-year growth (2023-2028) (%)
      • Data Table on Land Development - Year-over-year growth (2023-2028) (%)
    • 8.4 Crop Cultivation - Market size and forecast (2023-2028)
      • Chart on Crop Cultivation - Market size and forecast (2023-2028) ($ billion)
      • Data Table on Crop Cultivation - Market size and forecast (2023-2028) ($ billion)
      • Chart on Crop Cultivation - Year-over-year growth (2023-2028) (%)
      • Data Table on Crop Cultivation - Year-over-year growth (2023-2028) (%)
    • 8.5 Harvesting - Market size and forecast (2023-2028)
      • Chart on Harvesting - Market size and forecast (2023-2028) ($ billion)
      • Data Table on Harvesting - Market size and forecast (2023-2028) ($ billion)
      • Chart on Harvesting - Year-over-year growth (2023-2028) (%)
      • Data Table on Harvesting - Year-over-year growth (2023-2028) (%)
    • 8.6 Post-Harvest Processing - Market size and forecast (2023-2028)
      • Chart on Post-Harvest Processing - Market size and forecast (2023-2028) ($ billion)
      • Data Table on Post-Harvest Processing - Market size and forecast (2023-2028) ($ billion)
      • Chart on Post-Harvest Processing - Year-over-year growth (2023-2028) (%)
      • Data Table on Post-Harvest Processing - Year-over-year growth (2023-2028) (%)
    • 8.7 Market opportunity by Application
      • Market opportunity by Application ($ billion)
      • Data Table on Market opportunity by Application ($ billion)

    9 Market Segmentation by End-User

    • 9.1 Market segments
      • Chart on End-User - Market share (2023-2028) (%)
      • Data Table on End-User - Market share (2023-2028) (%)
    • 9.2 Comparison by End-User
      • Chart on Comparison by End-User
      • Data Table on Comparison by End-User
    • 9.3 Large-Scale Farms - Market size and forecast (2023-2028)
      • Chart on Large-Scale Farms - Market size and forecast (2023-2028) ($ billion)
      • Data Table on Large-Scale Farms - Market size and forecast (2023-2028) ($ billion)
      • Chart on Large-Scale Farms - Year-over-year growth (2023-2028) (%)
      • Data Table on Large-Scale Farms - Year-over-year growth (2023-2028) (%)
    • 9.4 Small and Medium Farms - Market size and forecast (2023-2028)
      • Chart on Small and Medium Farms - Market size and forecast (2023-2028) ($ billion)
      • Data Table on Small and Medium Farms - Market size and forecast (2023-2028) ($ billion)
      • Chart on Small and Medium Farms - Year-over-year growth (2023-2028) (%)
      • Data Table on Small and Medium Farms - Year-over-year growth (2023-2028) (%)
    • 9.5 Agricultural Cooperatives - Market size and forecast (2023-2028)
      • Chart on Agricultural Cooperatives - Market size and forecast (2023-2028) ($ billion)
      • Data Table on Agricultural Cooperatives - Market size and forecast (2023-2028) ($ billion)
      • Chart on Agricultural Cooperatives - Year-over-year growth (2023-2028) (%)
      • Data Table on Agricultural Cooperatives - Year-over-year growth (2023-2028) (%)
    • 9.6 Market opportunity by End-User
      • Market opportunity by End-User ($ billion)
      • Data Table on Market opportunity by End-User ($ billion)

    8 Customer Landscape

    • 8.1 Customer landscape overview
      • Exhibit 70: Analysis of price sensitivity, lifecycle, customer purchase basket, adoption rates, and purchase criteria

    9 Geographic Landscape

    • 9.1 Geographic segmentation
      • Exhibit 71: Chart on Market share by geography 2023-2028 (%)
      • Exhibit 72: Data Table on Market share by geography 2023-2028 (%)
    • 9.2 Geographic comparison
      • Exhibit 73: Chart on Geographic comparison
      • Exhibit 74: Data Table on Geographic comparison
    • 9.3 North America - Market size and forecast 2023-2028
      • Exhibit 75: Chart on North America - Market size and forecast 2023-2028 ($ billion)
      • Exhibit 76: Data Table on North America - Market size and forecast 2023-2028 ($ billion)
      • Exhibit 77: Chart on North America - Year-over-year growth 2023-2028 (%)
      • Exhibit 78: Data Table on North America - Year-over-year growth 2023-2028 (%)
    • 9.4 Europe - Market size and forecast 2023-2028
      • Exhibit 79: Chart on Europe - Market size and forecast 2023-2028 ($ billion)
      • Exhibit 80: Data Table on Europe - Market size and forecast 2023-2028 ($ billion)
      • Exhibit 81: Chart on Europe - Year-over-year growth 2023-2028 (%)
      • Exhibit 82: Data Table on Europe - Year-over-year growth 2023-2028 (%)
    • 9.5 APAC - Market size and forecast 2023-2028
      • Exhibit 83: Chart on APAC - Market size and forecast 2023-2028 ($ billion)
      • Exhibit 84: Data Table on APAC - Market size and forecast 2023-2028 ($ billion)
      • Exhibit 85: Chart on APAC - Year-over-year growth 2023-2028 (%)
      • Exhibit 86: Data Table on APAC - Year-over-year growth 2023-2028 (%)
    • 9.6 South America - Market size and forecast 2023-2028
      • Exhibit 87: Chart on South America - Market size and forecast 2023-2028 ($ billion)
      • Exhibit 88: Data Table on South America - Market size and forecast 2023-2028 ($ billion)
      • Exhibit 89: Chart on South America - Year-over-year growth 2023-2028 (%)
      • Exhibit 90: Data Table on South America - Year-over-year growth 2023-2028 (%)
    • 9.7 Middle East and Africa - Market size and forecast 2023-2028
      • Exhibit 91: Chart on Middle East and Africa - Market size and forecast 2023-2028 ($ billion)
      • Exhibit 92: Data Table on Middle East and Africa - Market size and forecast 2023-2028 ($ billion)
      • Exhibit 93: Chart on Middle East and Africa - Year-over-year growth 2023-2028 (%)
      • Exhibit 94: Data Table on Middle East and Africa - Year-over-year growth 2023-2028 (%)
    • 9.8 US - Market size and forecast 2023-2028
      • Exhibit 95: Chart on US - Market size and forecast 2023-2028 ($ billion)
      • Exhibit 96: Data Table on US - Market size and forecast 2023-2028 ($ billion)
      • Exhibit 97: Chart on US - Year-over-year growth 2023-2028 (%)
      • Exhibit 98: Data Table on US - Year-over-year growth 2023-2028 (%)
    • 9.9 China - Market size and forecast 2023-2028
      • Exhibit 99: Chart on China - Market size and forecast 2023-2028 ($ billion)
      • Exhibit 100: Data Table on China - Market size and forecast 2023-2028 ($ billion)
      • Exhibit 101: Chart on China - Year-over-year growth 2023-2028 (%)
      • Exhibit 102: Data Table on China - Year-over-year growth 2023-2028 (%)
    • 9.10 India - Market size and forecast 2023-2028
      • Exhibit 103: Chart on India - Market size and forecast 2023-2028 ($ billion)
      • Exhibit 104: Data Table on India - Market size and forecast 2023-2028 ($ billion)
      • Exhibit 105: Chart on India - Year-over-year growth 2023-2028 (%)
      • Exhibit 106: Data Table on India - Year-over-year growth 2023-2028 (%)
    • 9.11 France - Market size and forecast 2023-2028
      • Exhibit 107: Chart on France - Market size and forecast 2023-2028 ($ billion)
      • Exhibit 108: Data Table on France - Market size and forecast 2023-2028 ($ billion)
      • Exhibit 109: Chart on France - Year-over-year growth 2023-2028 (%)
      • Exhibit 110: Data Table on France - Year-over-year growth 2023-2028 (%)
    • 9.12 UK - Market size and forecast 2023-2028
      • Exhibit 111: Chart on UK - Market size and forecast 2023-2028 ($ billion)
      • Exhibit 112: Data Table on UK - Market size and forecast 2023-2028 ($ billion)
      • Exhibit 113: Chart on UK - Year-over-year growth 2023-2028 (%)
      • Exhibit 114: Data Table on UK - Year-over-year growth 2023-2028 (%)
    • 9.13 Market opportunity by geography
      • Exhibit 115: Market opportunity by geography ($ billion)
      • Exhibit 116: Data Tables on Market opportunity by geography ($ billion)
    • 11.14 Canada - Market size and forecast (2023-2028)
      • Chart on Canada - Market size and forecast (2023-2028) ($ billion)
      • Data Table on Canada - Market size and forecast (2023-2028) ($ billion)
      • Chart on Canada - Year-over-year growth (2023-2028) (%)
      • Data Table on Canada - Year-over-year growth (2023-2028) (%)
    • 11.15 Germany - Market size and forecast (2023-2028)
      • Chart on Germany - Market size and forecast (2023-2028) ($ billion)
      • Data Table on Germany - Market size and forecast (2023-2028) ($ billion)
      • Chart on Germany - Year-over-year growth (2023-2028) (%)
      • Data Table on Germany - Year-over-year growth (2023-2028) (%)
    • 11.16 Italy - Market size and forecast (2023-2028)
      • Chart on Italy - Market size and forecast (2023-2028) ($ billion)
      • Data Table on Italy - Market size and forecast (2023-2028) ($ billion)
      • Chart on Italy - Year-over-year growth (2023-2028) (%)
      • Data Table on Italy - Year-over-year growth (2023-2028) (%)
    • 11.17 Japan - Market size and forecast (2023-2028)
      • Chart on Japan - Market size and forecast (2023-2028) ($ billion)
      • Data Table on Japan - Market size and forecast (2023-2028) ($ billion)
      • Chart on Japan - Year-over-year growth (2023-2028) (%)
      • Data Table on Japan - Year-over-year growth (2023-2028) (%)
    • 11.18 Egypt - Market size and forecast (2023-2028)
      • Chart on Egypt - Market size and forecast (2023-2028) ($ billion)
      • Data Table on Egypt - Market size and forecast (2023-2028) ($ billion)
      • Chart on Egypt - Year-over-year growth (2023-2028) (%)
      • Data Table on Egypt - Year-over-year growth (2023-2028) (%)
    • 11.19 Oman - Market size and forecast (2023-2028)
      • Chart on Oman - Market size and forecast (2023-2028) ($ billion)
      • Data Table on Oman - Market size and forecast (2023-2028) ($ billion)
      • Chart on Oman - Year-over-year growth (2023-2028) (%)
      • Data Table on Oman - Year-over-year growth (2023-2028) (%)
    • 11.20 Argentina - Market size and forecast (2023-2028)
      • Chart on Argentina - Market size and forecast (2023-2028) ($ billion)
      • Data Table on Argentina - Market size and forecast (2023-2028) ($ billion)
      • Chart on Argentina - Year-over-year growth (2023-2028) (%)
      • Data Table on Argentina - Year-over-year growth (2023-2028) (%)
    • 11.21 KSA - Market size and forecast (2023-2028)
      • Chart on KSA - Market size and forecast (2023-2028) ($ billion)
      • Data Table on KSA - Market size and forecast (2023-2028) ($ billion)
      • Chart on KSA - Year-over-year growth (2023-2028) (%)
      • Data Table on KSA - Year-over-year growth (2023-2028) (%)
    • 11.22 UAE - Market size and forecast (2023-2028)
      • Chart on UAE - Market size and forecast (2023-2028) ($ billion)
      • Data Table on UAE - Market size and forecast (2023-2028) ($ billion)
      • Chart on UAE - Year-over-year growth (2023-2028) (%)
      • Data Table on UAE - Year-over-year growth (2023-2028) (%)
    • 11.23 Brazil - Market size and forecast (2023-2028)
      • Chart on Brazil - Market size and forecast (2023-2028) ($ billion)
      • Data Table on Brazil - Market size and forecast (2023-2028) ($ billion)
      • Chart on Brazil - Year-over-year growth (2023-2028) (%)
      • Data Table on Brazil - Year-over-year growth (2023-2028) (%)
    • 11.24 Rest of World (ROW) - Market size and forecast (2023-2028)
      • Chart on Rest of World (ROW) - Market size and forecast (2023-2028) ($ billion)
      • Data Table on Rest of World (ROW) - Market size and forecast (2023-2028) ($ billion)
      • Chart on Rest of World (ROW) - Year-over-year growth (2023-2028) (%)
      • Data Table on Rest of World (ROW) - Year-over-year growth (2023-2028) (%)

    10 Drivers, Challenges, and Trends

    • 10.1 Market drivers
      • 10.2 Market challenges
        • 10.3 Impact of drivers and challenges
          • Exhibit 117: Impact of drivers and challenges in 2023 and 2028
        • 10.4 Market trends

          11 Vendor Landscape

          • 11.1 Overview
            • 11.2 Vendor landscape
              • Exhibit 118: Overview on Criticality of inputs and Factors of differentiation
            • 11.3 Landscape disruption
              • Exhibit 119: Overview on factors of disruption
            • 11.4 Industry risks
              • Exhibit 120: Impact of key risks on business

            14 Competitive Analysis

            • 14.1 Companies profiled
              • Companies covered
            • 14.2 Market positioning of companies
              • Matrix on companies position and classification
            • 14.3 Deere & Company (United States)
              • Deere & Company (United States) - Overview
              • Deere & Company (United States) - Product / Service
              • Deere & Company (United States) - Key offerings
            • 14.4 CNH Industrial (United Kingdom)
              • CNH Industrial (United Kingdom) - Overview
              • CNH Industrial (United Kingdom) - Product / Service
              • CNH Industrial (United Kingdom) - Key offerings
            • 14.5 AGCO Corporation (United States)
              • AGCO Corporation (United States) - Overview
              • AGCO Corporation (United States) - Product / Service
              • AGCO Corporation (United States) - Key offerings
            • 14.6 Kubota Corporation (Japan)
              • Kubota Corporation (Japan) - Overview
              • Kubota Corporation (Japan) - Product / Service
              • Kubota Corporation (Japan) - Key offerings
            • 14.7 Mahindra & Mahindra (India)
              • Mahindra & Mahindra (India) - Overview
              • Mahindra & Mahindra (India) - Product / Service
              • Mahindra & Mahindra (India) - Key offerings
            • 14.8 CLAAS KGaA (Germany)
              • CLAAS KGaA (Germany) - Overview
              • CLAAS KGaA (Germany) - Product / Service
              • CLAAS KGaA (Germany) - Key offerings
            • 14.9 Escorts Limited (India)
              • Escorts Limited (India) - Overview
              • Escorts Limited (India) - Product / Service
              • Escorts Limited (India) - Key offerings
            • 14.10 Yanmar Holdings (Japan)
              • Yanmar Holdings (Japan) - Overview
              • Yanmar Holdings (Japan) - Product / Service
              • Yanmar Holdings (Japan) - Key offerings
            • 14.11 Bucher Industries (Switzerland)
              • Bucher Industries (Switzerland) - Overview
              • Bucher Industries (Switzerland) - Product / Service
              • Bucher Industries (Switzerland) - Key offerings
            • 14.12 SDF Group (Italy)
              • SDF Group (Italy) - Overview
              • SDF Group (Italy) - Product / Service
              • SDF Group (Italy) - Key offerings
            • 14.13 Alamo Group (United States)
              • Alamo Group (United States) - Overview
              • Alamo Group (United States) - Product / Service
              • Alamo Group (United States) - Key offerings
            • 14.14 Iseki & Co. (Japan)
              • Iseki & Co. (Japan) - Overview
              • Iseki & Co. (Japan) - Product / Service
              • Iseki & Co. (Japan) - Key offerings
            • 14.15 Daedong Industrial (South Korea)
              • Daedong Industrial (South Korea) - Overview
              • Daedong Industrial (South Korea) - Product / Service
              • Daedong Industrial (South Korea) - Key offerings
            • 14.16 Lovol Heavy Industry (China)
              • Lovol Heavy Industry (China) - Overview
              • Lovol Heavy Industry (China) - Product / Service
              • Lovol Heavy Industry (China) - Key offerings
            • 14.17 Exel Industries (France)
              • Exel Industries (France) - Overview
              • Exel Industries (France) - Product / Service
              • Exel Industries (France) - Key offerings
            • 14.18 JCB (United Kingdom)
              • JCB (United Kingdom) - Overview
              • JCB (United Kingdom) - Product / Service
              • JCB (United Kingdom) - Key offerings
            • 14.19 Tafe (India)
              • Tafe (India) - Overview
              • Tafe (India) - Product / Service
              • Tafe (India) - Key offerings
            • 14.20 Zoomlion Heavy Industry (China)
              • Zoomlion Heavy Industry (China) - Overview
              • Zoomlion Heavy Industry (China) - Product / Service
              • Zoomlion Heavy Industry (China) - Key offerings
            • 14.21 Argo Tractors (Italy)
              • Argo Tractors (Italy) - Overview
              • Argo Tractors (Italy) - Product / Service
              • Argo Tractors (Italy) - Key offerings
            • 14.22 Kinze Manufacturing (United States)
              • Kinze Manufacturing (United States) - Overview
              • Kinze Manufacturing (United States) - Product / Service
              • Kinze Manufacturing (United States) - Key offerings
            • 14.23 AGCO Corp.
              • AGCO Corp. - Overview
              • AGCO Corp. - Product / Service
              • AGCO Corp. - Key offerings
            • 14.24 Alamo Group Inc.
              • Alamo Group Inc. - Overview
              • Alamo Group Inc. - Product / Service
              • Alamo Group Inc. - Key offerings
            • 14.25 American Spring and Pressing Works Pvt. Ltd.
              • American Spring and Pressing Works Pvt. Ltd. - Overview
              • American Spring and Pressing Works Pvt. Ltd. - Product / Service
              • American Spring and Pressing Works Pvt. Ltd. - Key offerings
            • 14.26 Beri Udyog Pvt. Ltd.
              • Beri Udyog Pvt. Ltd. - Overview
              • Beri Udyog Pvt. Ltd. - Product / Service
              • Beri Udyog Pvt. Ltd. - Key offerings
            • 14.27 CLAAS KGaA mBH
              • CLAAS KGaA mBH - Overview
              • CLAAS KGaA mBH - Product / Service
              • CLAAS KGaA mBH - Key offerings
            • 14.28 CNH Industrial NV
              • CNH Industrial NV - Overview
              • CNH Industrial NV - Product / Service
              • CNH Industrial NV - Key offerings
            • 14.29 Deere and Co.
              • Deere and Co. - Overview
              • Deere and Co. - Product / Service
              • Deere and Co. - Key offerings
            • 14.30 ISEKI and Co. Ltd.
              • ISEKI and Co. Ltd. - Overview
              • ISEKI and Co. Ltd. - Product / Service
              • ISEKI and Co. Ltd. - Key offerings
            • 14.31 Kinze Manufacturing Inc.
              • Kinze Manufacturing Inc. - Overview
              • Kinze Manufacturing Inc. - Product / Service
              • Kinze Manufacturing Inc. - Key offerings
            • 14.32 Kovai Classic Industries
              • Kovai Classic Industries - Overview
              • Kovai Classic Industries - Product / Service
              • Kovai Classic Industries - Key offerings
            • 14.33 Kubota Corp.
              • Kubota Corp. - Overview
              • Kubota Corp. - Product / Service
              • Kubota Corp. - Key offerings
            • 14.34 Mahindra and Mahindra Ltd.
              • Mahindra and Mahindra Ltd. - Overview
              • Mahindra and Mahindra Ltd. - Product / Service
              • Mahindra and Mahindra Ltd. - Key offerings
            • 14.35 ROSTA AG
              • ROSTA AG - Overview
              • ROSTA AG - Product / Service
              • ROSTA AG - Key offerings
            • 14.36 Shandong Heavy Industry Group Co. Ltd.
              • Shandong Heavy Industry Group Co. Ltd. - Overview
              • Shandong Heavy Industry Group Co. Ltd. - Product / Service
              • Shandong Heavy Industry Group Co. Ltd. - Key offerings
            • 14.37 Summit Steel and Manufacturing Inc.
              • Summit Steel and Manufacturing Inc. - Overview
              • Summit Steel and Manufacturing Inc. - Product / Service
              • Summit Steel and Manufacturing Inc. - Key offerings
            • 14.38 Tractors and Farm Equipment Ltd.
              • Tractors and Farm Equipment Ltd. - Overview
              • Tractors and Farm Equipment Ltd. - Product / Service
              • Tractors and Farm Equipment Ltd. - Key offerings
            • 14.39 Trimble Inc.
              • Trimble Inc. - Overview
              • Trimble Inc. - Product / Service
              • Trimble Inc. - Key offerings
            • 14.40 Zetor Tractors as
              • Zetor Tractors as - Overview
              • Zetor Tractors as - Product / Service
              • Zetor Tractors as - Key offerings
            • 14.41 EcoRobotix SA
              • EcoRobotix SA - Overview
              • EcoRobotix SA - Product / Service
              • EcoRobotix SA - Key offerings
            • 14.42 Yanmar Holdings Co. Ltd.
              • Yanmar Holdings Co. Ltd. - Overview
              • Yanmar Holdings Co. Ltd. - Product / Service
              • Yanmar Holdings Co. Ltd. - Key offerings

            13 Appendix

            • 13.1 Scope of the report
              • 13.2 Inclusions and exclusions checklist
                • Exhibit 178: Inclusions checklist
                • Exhibit 179: Exclusions checklist
              • 13.3 Currency conversion rates for US$
                • Exhibit 180: Currency conversion rates for US$
              • 13.4 Research methodology
                • Exhibit 181: Research methodology
                • Exhibit 182: Validation techniques employed for market sizing
                • Exhibit 183: Information sources
              • 13.5 List of abbreviations
                • Exhibit 184: List of abbreviations

              Research Methodology

              Technavio presents a detailed picture of the market by way of study, synthesis, and summation of data from multiple sources. The analysts have presented the various facets of the market with a particular focus on identifying the key industry influencers. The data thus presented is comprehensive, reliable, and the result of extensive research, both primary and secondary.

              INFORMATION SOURCES

              Primary sources

              • Manufacturers and suppliers
              • Channel partners
              • Industry experts
              • Strategic decision makers

              Secondary sources

              • Industry journals and periodicals
              • Government data
              • Financial reports of key industry players
              • Historical data
              • Press releases

              DATA ANALYSIS

              Data Synthesis

              • Collation of data
              • Estimation of key figures
              • Analysis of derived insights

              Data Validation

              • Triangulation with data models
              • Reference against proprietary databases
              • Corroboration with industry experts

              REPORT WRITING

              Qualitative

              • Market drivers
              • Market challenges
              • Market trends
              • Five forces analysis

              Quantitative

              • Market size and forecast
              • Market segmentation
              • Geographical insights
              • Competitive landscape

              Interested in this report?

              Get your sample now to see our research methodology and insights!

              Download Now

              Frequently Asked Questions

              Agriculture Equipment market growth will increase by $ 66.53 bn during 2024-2028.

              The Agriculture Equipment market is expected to grow at a CAGR of 6.05% during 2024-2028.

              Agriculture Equipment market is segmented by Type( Tractors, Harvesters machinery, Planting equipment, Others) Product Type( Manual, Automatic, Semi-automatic)

              Deere & Company (United States), CNH Industrial (United Kingdom), AGCO Corporation (United States), Kubota Corporation (Japan), Mahindra & Mahindra (India), CLAAS KGaA (Germany), Escorts Limited (India), Yanmar Holdings (Japan), Bucher Industries (Switzerland), SDF Group (Italy), Alamo Group (United States), Iseki & Co. (Japan), Daedong Industrial (South Korea), Lovol Heavy Industry (China), Exel Industries (France), JCB (United Kingdom), Tafe (India), Zoomlion Heavy Industry (China), Argo Tractors (Italy), Kinze Manufacturing (United States) are a few of the key vendors in the Agriculture Equipment market.

              North America will register the highest growth rate of 31% among the other regions. Therefore, the Agriculture Equipment market in North America is expected to garner significant business opportunities for the vendors during the forecast period.

              US, Canada, Germany, UK, Italy, France, China, India, Japan, Egypt, Oman, Argentina, KSA, UAE, Brazil

              • Increasing demand for agricultural equipment due to labor shortageThe global rural population largely comprises the agricultural sector. There is an increasing trend of migration of labors from rural to urban areas is the driving factor this market.
              • which raises the issue of a labor shortage in the countries such as India and South Africa. Rural areas in the US face acute shortages of agriculture labor is the driving factor this market.
              • especially in Ohio and Pennsylvania. Also is the driving factor this market.
              • many local workers are not interested in doing farm-related work is the driving factor this market.
              • which has increased labor shortages. Thus is the driving factor this market.
              • the labor shortage has gradually increased the labor cost in the country over the years. This has increased the demand for agriculture machinery even by small farm holders. Agriculture equipment offers efficient and time-saving farming. Precision farming and fully automated farming adopted with the help of farming machines eliminate human interruption; thus is the driving factor this market.
              • the errors are also decreased. Such instances help farmers in yielding a high output of crops. Furthermore is the driving factor this market.
              • easy access to this machinery encourages farmers to buy farming machinery. Therefore is the driving factor this market.
              • farmers are switching toward capital-intensive resources for agricultural activities. Therefore is the driving factor this market.
              • the demand for agriculture equipment is generated is the driving factor this market.
              • which is the driving factor this market.
              • in turn is the driving factor this market.
              • will drive the growth of the global agriculture equipment market during the forecast period. is the driving factor this market.

              The Agriculture Equipment market vendors should focus on grabbing business opportunities from the Tractors segment as it accounted for the largest market share in the base year.