
Route Optimization Software Market Size 2026-2030
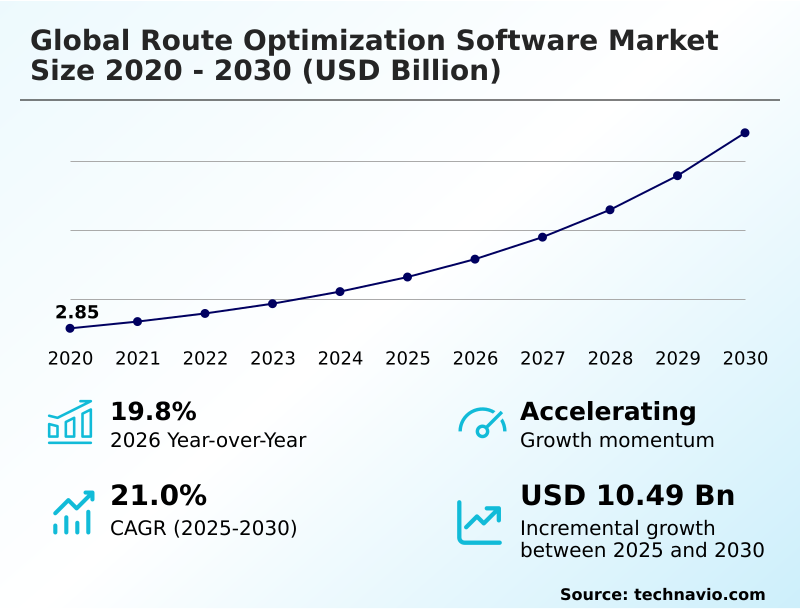
The route optimization software market size is valued to increase by USD 10.49 billion, at a CAGR of 21% from 2025 to 2030. Surge in E-commerce volume will drive the route optimization software market.
Major Market Trends & Insights
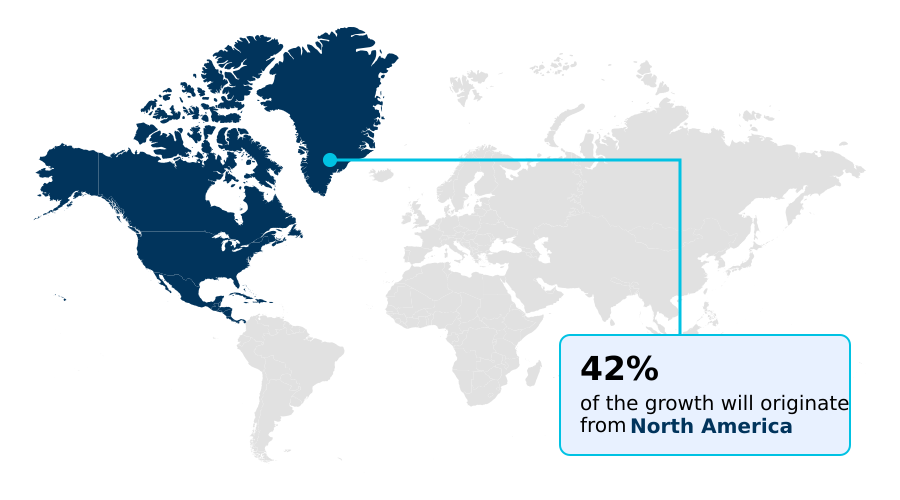
- North America dominated the market and accounted for a 42.5% growth during the forecast period.
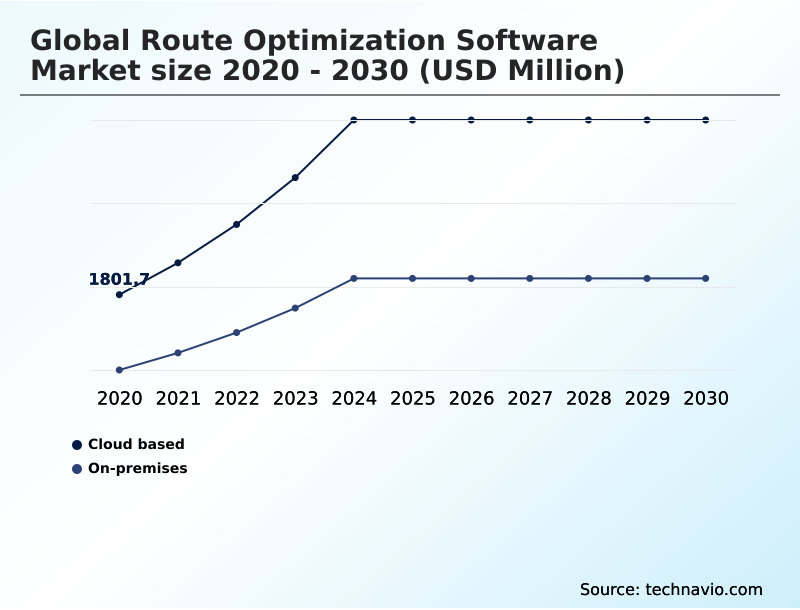
- By Deployment - Cloud based segment was valued at USD 3.55 billion in 2024
- By Component - Software segment accounted for the largest market revenue share in 2024
Market Size & Forecast
- Market Opportunities: USD 14.22 billion
- Market Future Opportunities: USD 10.49 billion
- CAGR from 2025 to 2030 : 21%
Market Summary
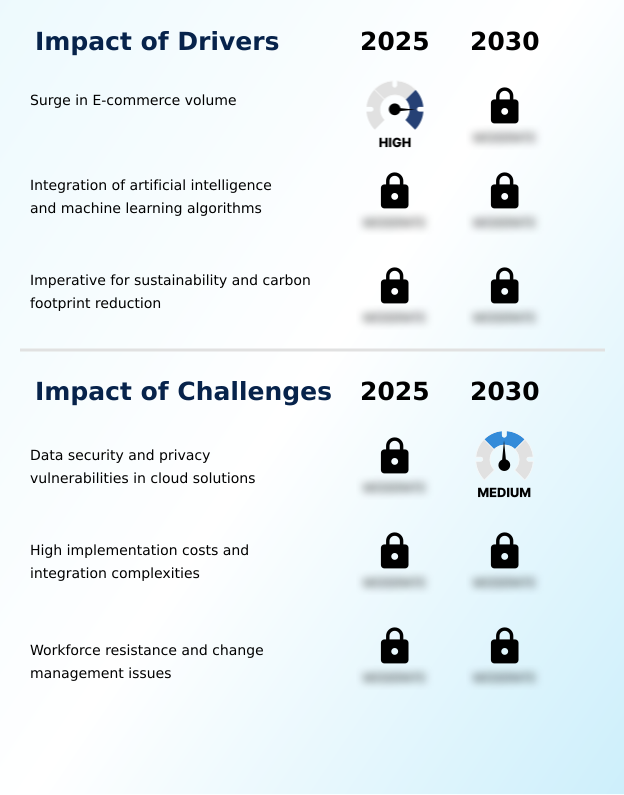
- The route optimization software market is defined by the increasing need for operational efficiency in logistics and supply chain activities. Core drivers include the rapid expansion of e-commerce, which places immense pressure on last-mile delivery networks to meet consumer expectations for speed and reliability.
- Technology trends are centered on the integration of artificial intelligence and machine learning, enabling dynamic rerouting and predictive analytics to overcome real-time disruptions.
- For instance, a third-party logistics provider uses these systems for its field service management (FSM) to solve the complex vehicle routing problem (VRP) for its mobile workforce management, ensuring that technicians adhere to strict service level agreement (SLA) management windows. This improves the on-time performance metric and facilitates electronic proof of delivery (POD) capture.
- However, the industry faces challenges related to the high initial cost of transportation management system (TMS) integration and ensuring hours of service (HOS) compliance through accurate compliance data logging.
- The evolution from static planning to intelligent, automated dispatching is essential for maintaining a competitive edge and managing the intricacies of the modern pickup and delivery problem (PDP) and multi-depot routing problem.
What will be the Size of the Route Optimization Software Market during the forecast period?
Get Key Insights on Market Forecast (PDF) Get Free Sample
How is the Route Optimization Software Market Segmented?
The route optimization software industry research report provides comprehensive data (region-wise segment analysis), with forecasts and estimates in "USD million" for the period 2026-2030, as well as historical data from 2020-2024 for the following segments.
- Deployment
- Cloud based
- On-premises
- Component
- Software
- Services
- End-user
- Large enterprises
- Small and medium enterprises
- Geography
- North America
- US
- Canada
- Mexico
- Europe
- UK
- Germany
- France
- APAC
- China
- Japan
- India
- South America
- Brazil
- Argentina
- Colombia
- Middle East and Africa
- Saudi Arabia
- UAE
- South Africa
- Rest of World (ROW)
- North America
By Deployment Insights
The cloud based segment is estimated to witness significant growth during the forecast period.
The market shift toward cloud-based logistics software is driven by the flexibility of the SaaS delivery model, which provides a scalable alternative to the on-premise deployment option.
These platforms facilitate real-time data synchronization, enabling dynamic route modification based on live traffic data feeds for superior eta prediction accuracy.
By leveraging algorithmic route planning and centralized dispatch management, organizations can process routes in batches and enhance supply chain visibility. This architecture supports extensive api for custom integration, allowing for seamless delivery appointment scheduling.
Adopting these systems has been shown to reduce data entry errors in dispatch operations by more than 15%, improving overall efficiency and real-time gps vehicle tracking.
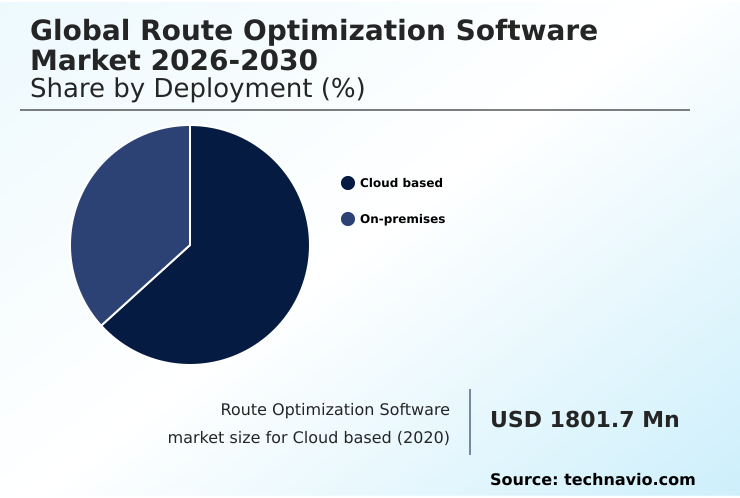
The Cloud based segment was valued at USD 3.55 billion in 2024 and showed a gradual increase during the forecast period.
Regional Analysis
North America is estimated to contribute 42.5% to the growth of the global market during the forecast period.Technavio’s analysts have elaborately explained the regional trends and drivers that shape the market during the forecast period.
See How Route Optimization Software Market Demand is Rising in North America Get Free Sample
The geographic landscape of the market is characterized by varying adoption rates and technological maturity.
In developed regions like North America and Europe, there is a strong focus on advanced features such as predictive traffic analysis and carbon emission tracking to refine logistics network design.
Firms in these areas leverage sophisticated geospatial data processing to optimize sales territory optimization and enhance delivery density analysis. In contrast, rapidly growing economies in APAC are prioritizing foundational capabilities like dynamic rerouting capability to manage urban congestion.
The application of geocoding and reverse geocoding is becoming standard globally.
Deployments show that effective multi-modal transport routing can increase fleet productivity by over 18%, while solving the multi-depot routing problem has led to a 12% reduction in operational overhead for large-scale distribution networks.
Market Dynamics
Our researchers analyzed the data with 2025 as the base year, along with the key drivers, trends, and challenges. A holistic analysis of drivers will help companies refine their marketing strategies to gain a competitive advantage.
- Strategic implementation of route optimization software is critical for modernizing logistics. The use of AI in route planning software transforms static schedules into dynamic, responsive operations. For e-commerce enterprises, last-mile delivery optimization solutions are essential for meeting customer expectations, while dynamic routing for e-commerce logistics handles fluctuating order volumes effectively.
- Integration is a key success factor, with fleet management routing integration providing a unified view of operations and TMS software for supply chain creating end-to-end visibility. The application of predictive analytics in transportation enables proactive decision-making. In parallel, field service automated routing enhances the productivity of mobile workforces.
- The choice between cloud-based delivery routing solutions and on-premise systems depends on an organization's IT strategy, but routing platform API integration is crucial for custom ecosystems. Specialized applications are also gaining traction, including electric vehicle fleet route optimization and route planning for perishable goods. These systems are instrumental in reducing carbon footprint with software and optimizing delivery time window management.
- Using GIS tools for vehicle routing and real-time fleet tracking for logistics further improves accuracy. Businesses leveraging multi-depot vehicle routing solutions report asset utilization rates that are up to 25% higher than those using manual methods. Both route optimization for small businesses and enterprise-grade systems focus on improving driver efficiency via software.
- The benefits of SaaS route planning software benefits and using telematics data for optimization provide a clear path to enhanced performance.
What are the key market drivers leading to the rise in the adoption of Route Optimization Software Industry?
- The surge in e-commerce volume is a key market driver, fueling the demand for highly efficient and scalable delivery management solutions.
- Market growth is significantly driven by the imperative to enhance last-mile delivery efficiency amid surging e-commerce volumes.
- The use of a sophisticated last-mile delivery algorithm is critical for increasing delivery density analysis, with leading companies achieving a 20% improvement in urban areas.
- Adherence to strict service level agreement (SLA) management is non-negotiable, and modern software helps maintain an on-time performance metric of over 98%. These platforms facilitate dynamic route modification and dynamic time window adjustment in response to real-time events.
- Features such as real-time GPS vehicle tracking and electronic proof of delivery (POD) enhance transparency and accountability.
- The integration of a proactive customer notification system further improves the delivery experience by managing service time window constraints effectively and providing updates for any pickup and delivery problem (PDP) that arises.
What are the market trends shaping the Route Optimization Software Industry?
- The integration of IoT for predictive analytics represents a significant upcoming market trend. This allows for real-time data collection and forecasting to mitigate operational disruptions.
- Key market trends are centered on the adoption of AI-driven automation to solve complex logistical challenges. The focus is on intelligent route sequencing and automated dispatching workflow, which move operations away from manual planning toward real-time, autonomous decision-making.
- Advanced route simulation and modeling techniques allow businesses to test various scenarios, optimizing for outcomes like lower fuel consumption modeling and cost-per-stop analysis. The rise of on-demand dispatch logic addresses the need for agility in last-mile delivery.
- By applying sophisticated algorithms to solve the time-dependent VRP and the broader vehicle routing problem (VRP), companies can manage driver skills matching and load balancing across the fleet effectively. These systems improve asset utilization reporting by over 20% and use predictive delivery delay alerts to enhance customer communication, driving higher service levels through proactive job scheduling automation.
What challenges does the Route Optimization Software Industry face during its growth?
- Data security and privacy vulnerabilities associated with cloud-based platforms present a key challenge, impacting adoption and industry growth.
- A primary challenge restraining market adoption involves the complexities and perceived risks of cloud-based logistics software. Concerns over data security persist, particularly as the SaaS delivery model becomes standard. While many organizations are migrating from an on-premise deployment option, the process involves significant hurdles.
- Integrating new systems via API for custom integration requires specialized expertise, and ensuring robust compliance data logging to meet regulatory standards can increase implementation costs by up to 15%. This is especially true for systems requiring electronic logging device (ELD) integration.
- The need to protect sensitive information gathered from driver behavior monitoring and geospatial data processing adds another layer of complexity to centralized dispatch management. These challenges can delay the realization of benefits from an enhanced logistics network design and a unified supply chain visibility platform.
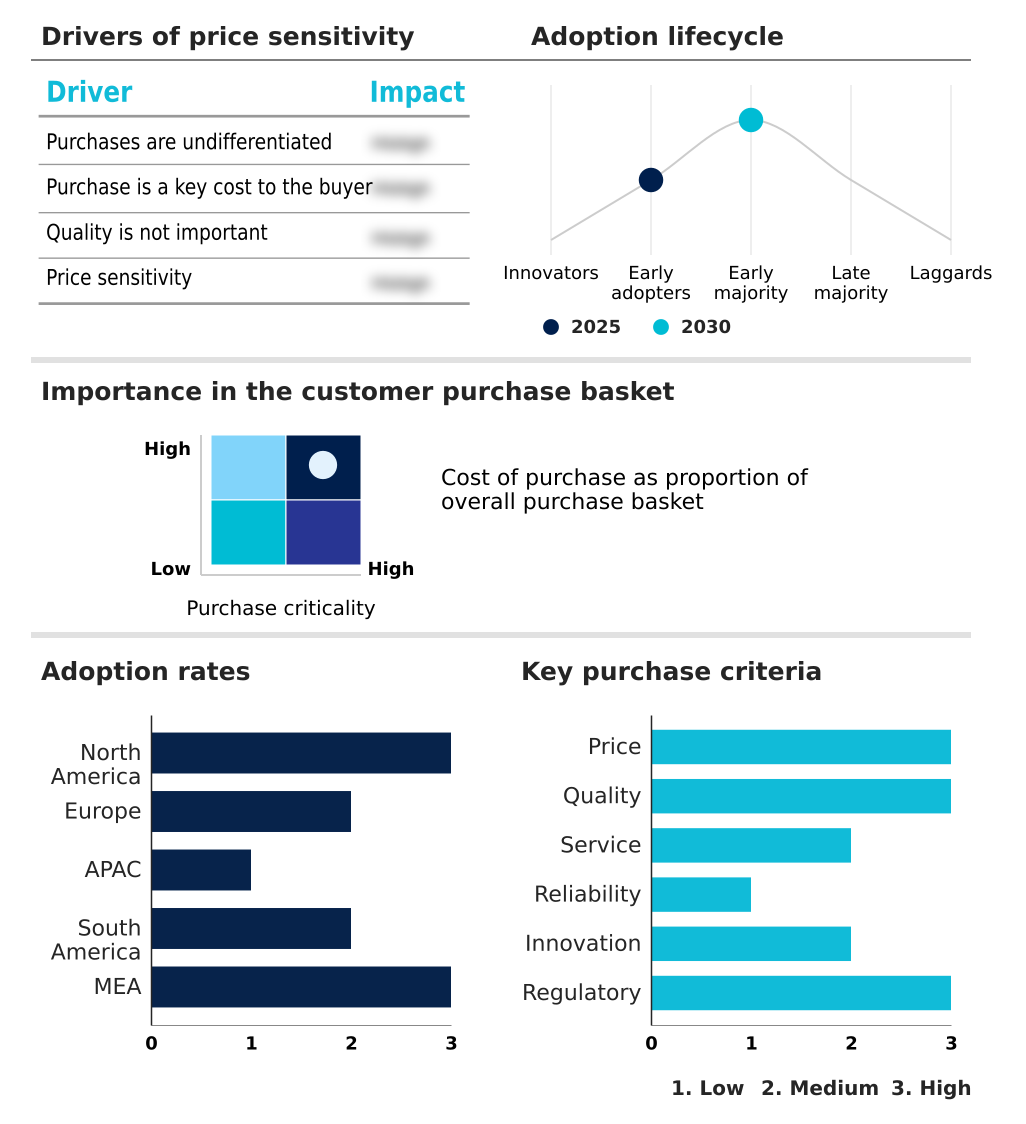
Exclusive Technavio Analysis on Customer Landscape
The route optimization software market forecasting report includes the adoption lifecycle of the market, covering from the innovator’s stage to the laggard’s stage. It focuses on adoption rates in different regions based on penetration. Furthermore, the route optimization software market report also includes key purchase criteria and drivers of price sensitivity to help companies evaluate and develop their market growth analysis strategies.
Customer Landscape of Route Optimization Software Industry
Competitive Landscape
Companies are implementing various strategies, such as strategic alliances, route optimization software market forecast, partnerships, mergers and acquisitions, geographical expansion, and product/service launches, to enhance their presence in the industry.
Alphabet Inc. - Offers a routes API empowering developers to embed predictive routing and navigation functionalities into custom enterprise applications for advanced logistics and mobility management.
The industry research and growth report includes detailed analyses of the competitive landscape of the market and information about key companies, including:
- Alphabet Inc.
- AMCS Group
- Aptean
- BluJay Solutions Inc.
- Caliper Corp.
- Dassault Systemes SE
- Descartes Systems Group Inc.
- Esri Global Inc.
- IFS World Operations AB
- Microlise Group Plc
- OptimoRoute Inc.
- ORTEC B.V
- Prism Visual Software Inc.
- PTV Planung Transport Verkehr AG
- Route4Me Inc.
- Routific Solutions Inc.
- Solvares FSM GmbH
- Trimble Inc.
- Verizon Communications Inc.
- Wise Systems Inc.
Qualitative and quantitative analysis of companies has been conducted to help clients understand the wider business environment as well as the strengths and weaknesses of key industry players. Data is qualitatively analyzed to categorize companies as pure play, category-focused, industry-focused, and diversified; it is quantitatively analyzed to categorize companies as dominant, leading, strong, tentative, and weak.
Recent Development and News in Route optimization software market
- In April 2025, Apex Route Analytics released a modular update to its core platform that utilizes predictive modeling to forecast urban congestion patterns up to forty-eight hours in advance, allowing dispatchers to preemptively adjust schedules.
- In March 2025, Trimble Inc. announced a strategic partnership with a major electric vehicle manufacturer to incorporate battery-range constraints directly into its routing algorithms, ensuring that commercial electric fleets can optimize routes based on charging station availability.
- In March 2025, Verizon Connect announced a comprehensive update to its fleet management platform, introducing an AI-driven predictive modeling feature to assist North American logistics providers in reducing idle times and optimizing electric vehicle route planning.
- In February 2025, Descartes Systems Group Inc. introduced a new predictive analytics module within its routing suite, designed to utilize generative AI for forecasting potential delivery bottlenecks caused by urban infrastructure projects.
Dive into Technavio’s robust research methodology, blending expert interviews, extensive data synthesis, and validated models for unparalleled Route Optimization Software Market insights. See full methodology.
| Market Scope | |
|---|---|
| Page number | 274 |
| Base year | 2025 |
| Historic period | 2020-2024 |
| Forecast period | 2026-2030 |
| Growth momentum & CAGR | Accelerate at a CAGR of 21% |
| Market growth 2026-2030 | USD 10490.7 million |
| Market structure | Fragmented |
| YoY growth 2025-2026(%) | 19.8% |
| Key countries | US, Canada, Mexico, UK, Germany, France, The Netherlands, Italy, Spain, China, Japan, India, South Korea, Australia, Indonesia, Brazil, Argentina, Colombia, Saudi Arabia, UAE, South Africa, Israel and Turkey |
| Competitive landscape | Leading Companies, Market Positioning of Companies, Competitive Strategies, and Industry Risks |
Research Analyst Overview
- The route optimization software market is evolving beyond simple pathfinding to become a cornerstone of intelligent logistics and supply chain management. Core functionalities are now powered by advanced algorithmic route planning, which enables dynamic rerouting capability and predictive traffic analysis for enhanced efficiency.
- The integration of fleet telematics integration provides a constant stream of data for driver behavior monitoring and improving ETA prediction accuracy. This shift toward data-driven decision-making is compelling board-level discussions around capital allocation, particularly concerning the transition to sustainable operations.
- For example, the adoption of electric vehicle (EV) routing capabilities is no longer a niche feature but a strategic necessity, influencing fleet acquisition strategies. Organizations that deploy EV-specific platforms for centralized dispatch management report up to a 15% improvement in vehicle range utilization, directly impacting operational viability.
- As supply chain visibility platforms become more sophisticated, the focus on transportation management system (TMS), field service management (FSM), and hours of service (HOS) compliance, supported by electronic proof of delivery (POD) systems, remains critical for operational excellence.
What are the Key Data Covered in this Route Optimization Software Market Research and Growth Report?
-
What is the expected growth of the Route Optimization Software Market between 2026 and 2030?
-
USD 10.49 billion, at a CAGR of 21%
-
-
What segmentation does the market report cover?
-
The report is segmented by Deployment (Cloud based, On-premises), Component (Software, and Services), End-user (Large enterprises, and Small and medium enterprises) and Geography (North America, Europe, APAC, South America, Middle East and Africa)
-
-
Which regions are analyzed in the report?
-
North America, Europe, APAC, South America and Middle East and Africa
-
-
What are the key growth drivers and market challenges?
-
Surge in E-commerce volume , Data security and privacy vulnerabilities in cloud solutions
-
-
Who are the major players in the Route Optimization Software Market?
-
Alphabet Inc., AMCS Group, Aptean, BluJay Solutions Inc., Caliper Corp., Dassault Systemes SE, Descartes Systems Group Inc., Esri Global Inc., IFS World Operations AB, Microlise Group Plc, OptimoRoute Inc., ORTEC B.V, Prism Visual Software Inc., PTV Planung Transport Verkehr AG, Route4Me Inc., Routific Solutions Inc., Solvares FSM GmbH, Trimble Inc., Verizon Communications Inc. and Wise Systems Inc.
-
Market Research Insights
- The market's momentum is driven by the adoption of advanced platforms that leverage real-time traffic data feeds and GIS-based network analysis to enhance fleet performance. These systems address complex operational variables, including commercial vehicle restrictions and the need for continuous route adherence monitoring.
- The integration of a sophisticated customer notification system and predictive delivery delay alerts improves service quality, with some operators reporting a 20% increase in customer satisfaction scores. Furthermore, features supporting dynamic time window adjustment and efficient reverse logistics planning contribute to significant cost savings.
- By optimizing routes, businesses have achieved up to a 15% reduction in fuel expenses and a 10% improvement in asset utilization, demonstrating a clear return on investment through superior mobile workforce management and route cost accounting.
We can help! Our analysts can customize this route optimization software market research report to meet your requirements.
 RIA -
RIA - 
