Rubber Processing Chemicals Market Analysis, Size, and Forecast 2025-2029: APAC (China, Japan, and India), North America (US, Canada, and Mexico), Europe (Germany, UK, and France), South America (Brazil, Argentina, and Colombia), Middle East and Africa (Saudi Arabia, South Africa, and UAE), and Rest of World (ROW)

Rubber Processing Chemicals Market Analysis, Size, and Forecast 2025-2029:
APAC (China, Japan, and India), North America (US, Canada, and Mexico), Europe (Germany, UK, and France), South America (Brazil, Argentina, and Colombia), Middle East and Africa (Saudi Arabia, South Africa, and UAE), and Rest of World (ROW)

Published: Dec 2025 295 Pages SKU: IRTNTR81138

Market Overview at a Glance

$1.70 B
Market Opportunity
5%
CAGR 2024 - 2029
42%
APAC Growth
$4.46 B
Synthetic segment 2023

Rubber Processing Chemicals Market Size 2025-2029

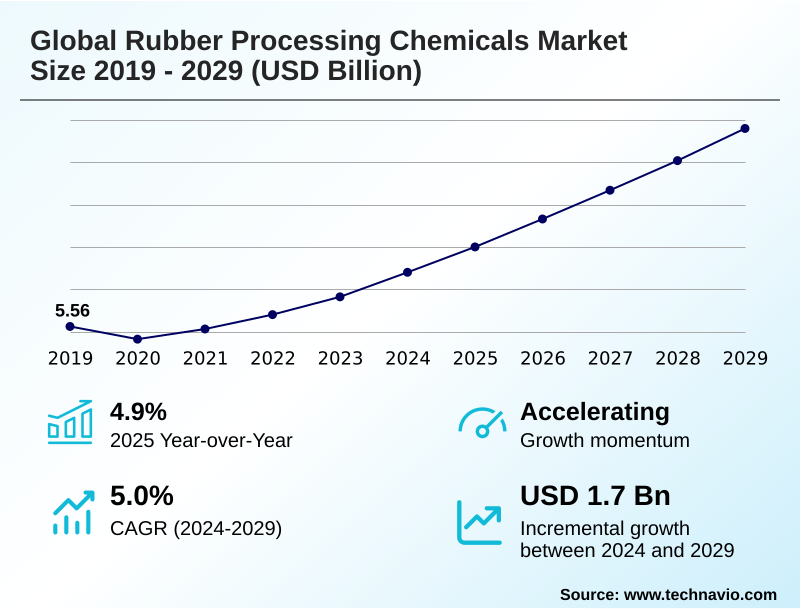
The rubber processing chemicals market size is valued to increase by USD 1.70 billion, at a CAGR of 5% from 2024 to 2029. Robust automotive sector growth and electric vehicle transition will drive the rubber processing chemicals market.

Major Market Trends & Insights

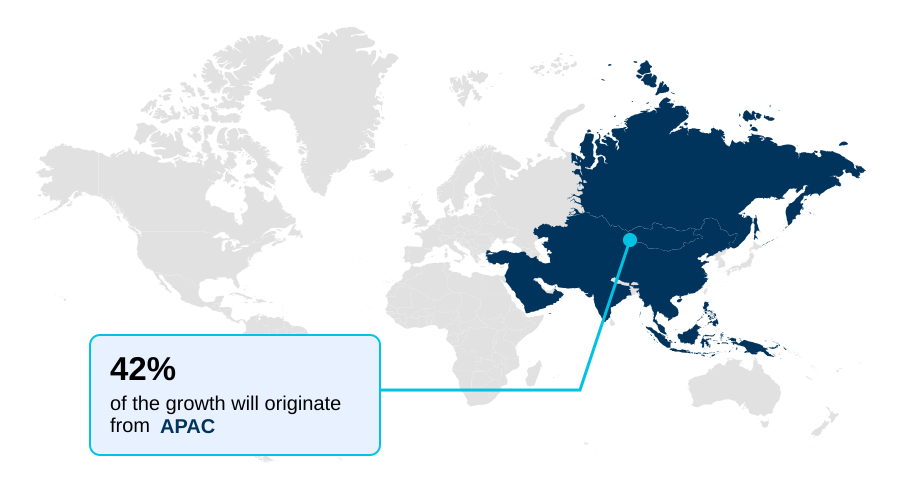
  • APAC dominated the market and accounted for a 42% growth during the forecast period.
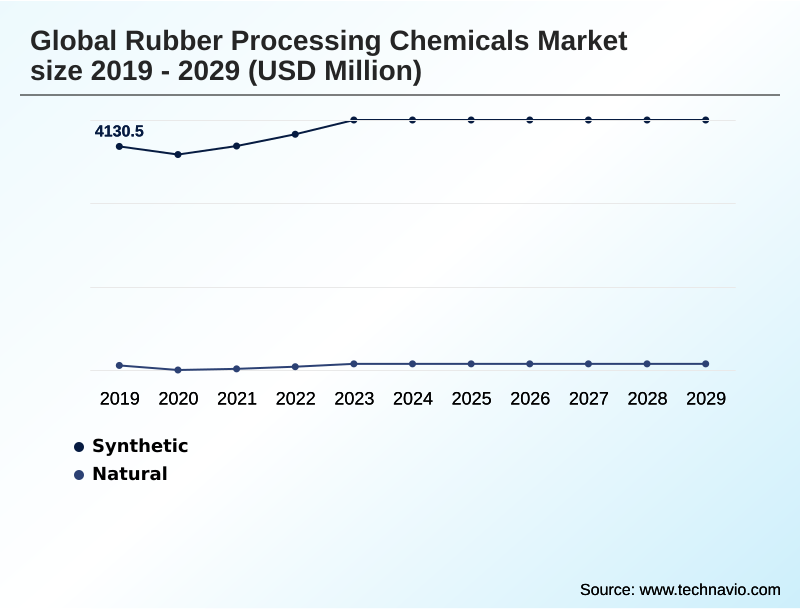
  • By Material Type - Synthetic segment was valued at USD 4.46 billion in 2023
  • By Type - Tire segment accounted for the largest market revenue share in 2023

Market Size & Forecast

  • Market Opportunities: USD 2.34 billion
  • Market Future Opportunities: USD 1.70 billion
  • CAGR from 2024 to 2029 : 5%

Market Summary

  • The rubber processing chemicals market is integral to manufacturing durable rubber products, where additives enhance material properties for demanding applications. Key drivers include sustained growth in the automotive sector, propelled by the transition to electric vehicles which require high-performance tires with unique characteristics like superior wear resistance and low rolling resistance.
  • This shift drives demand for advanced vulcanization accelerators and silane coupling agents. A significant trend is the industry-wide pivot to sustainability, compelled by stringent regulations and corporate esg mandates.
  • For instance, a tire manufacturer aiming to incorporate 30% recycled content into a new product line must reformulate its compounds, using specialized processing aids and devulcanizing agents to ensure performance parity with virgin materials. This scenario highlights the market's evolution, balancing innovation against challenges like raw material price volatility and the high cost-of-compliance.

What will be the Size of the Rubber Processing Chemicals Market during the forecast period?

Get Key Insights on Market Forecast (PDF) Request Free Sample

How is the Rubber Processing Chemicals Market Segmented?

The rubber processing chemicals industry research report provides comprehensive data (region-wise segment analysis), with forecasts and estimates in "USD million" for the period 2025-2029, as well as historical data from 2019-2023 for the following segments.

  • Material type
    • Synthetic
    • Natural
  • Type
    • Tire
    • Non Tire
  • Product
    • Accelerators
    • Anti degradants
    • Flame retardants
    • Processing aid
    • Others
  • Geography
    • APAC
      • China
      • Japan
      • India
    • North America
      • US
      • Canada
      • Mexico
    • Europe
      • Germany
      • UK
      • France
    • South America
      • Brazil
      • Argentina
      • Colombia
    • Middle East and Africa
      • Saudi Arabia
      • South Africa
      • UAE
    • Rest of World (ROW)

By Material Type Insights

The synthetic segment is estimated to witness significant growth during the forecast period.

The market for chemicals used in synthetic rubber is driven by relentless innovation. Tailoring material characteristics for applications where natural rubber is unsuitable is enabled by the strategic use of rubber processing chemicals, including specific vulcanization accelerators and processing aids.

Polymers like SBR and BR require optimized cure package systems to manage the vulcanization process and avoid issues such as the reversion phenomenon.

For EPDM, which is prized for its weathering resistance, a distinct set of antidegradants and antiozonants is essential to prevent flex-cracking fatigue.

The industry is also using material informatics to assess the ecotoxicity profile of new compounds, with some new polymers featuring up to 75% bio-based content, requiring a unique activator complex for effective crosslinking.

Request Free Sample

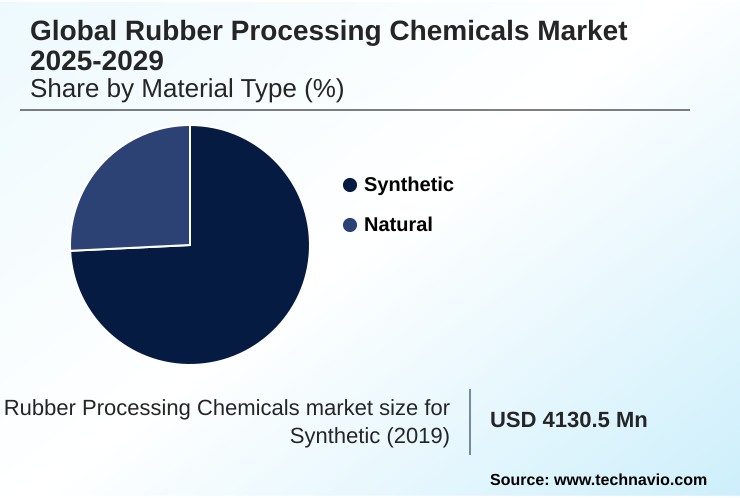
The Synthetic segment was valued at USD 4.46 billion in 2023 and showed a gradual increase during the forecast period.

Request Free Sample

Regional Analysis

APAC is estimated to contribute 42% to the growth of the global market during the forecast period.Technavio’s analysts have elaborately explained the regional trends and drivers that shape the market during the forecast period.

See How Rubber Processing Chemicals Market Demand is Rising in APAC Request Free Sample

The geographic landscape is dominated by the APAC region, which accounts for over 42% of incremental growth opportunities, driven by its manufacturing prowess.

This region is a major consumer of high-volume polymers like styrene-butadiene rubber (sbr) and polybutadiene rubber (br) for the tire industry.

In contrast, mature markets in North America and Europe focus on specialty applications, such as nitrile rubber (nbr) for industrial hoses and ethylene propylene diene monomer (epdm) for automotive seals.

Regulatory pressures concerning chemicals like p-phenylenediamine (ppd) and its derivative 6ppd-quinone are highest in these western regions. Investment in advanced process control systems is helping improve batch-to-batch consistency globally.

The adoption of predictive modeling is also on the rise, while nearshoring strategies aimed at reducing reliance on single-source suppliers of silica fillers can decrease supply chain lead times by up to 20%.

Market Dynamics

Our researchers analyzed the data with 2024 as the base year, along with the key drivers, trends, and challenges. A holistic analysis of drivers will help companies refine their marketing strategies to gain a competitive advantage.

  • The global rubber processing chemicals market 2025-2029 is undergoing a significant transformation, driven by both technological innovation and stringent regulatory pressures. The quest for sustainable antiozonant alternatives to 6ppd has become a top R&D priority, directly linked to the development of high-performance chemicals for ev tires, where balancing durability and efficiency is paramount.
  • Digitalization in rubber compound formulation is accelerating this process, enabling faster development of solutions that address the impact of reach on rubber chemicals. This has led to the rapid commercialization of non-nitrosamine generating vulcanization accelerators. A key focus area is reducing rolling resistance with advanced silica fillers, which is impossible without advanced silane coupling agents for synthetic rubber.
  • The industry's sustainability goals are further advanced by the use of bio-based processing aids for sustainable rubber and new chemical solutions for devulcanized elastomers. In construction, demand for halogen-free flame retardants for construction is growing. On the factory floor, improving cure characteristics of natural rubber remains a core competency, often achieved with multi-functional additives for process efficiency.
  • Companies are also developing specialized processing aids for recycled tire materials. While these innovations drive value, suppliers must also provide cost-effective commodity chemicals for tire manufacturing to remain competitive. Niche growth is found in specialty antidegradants for industrial hoses and high-strength bonding agents for rubber-to-metal applications.
  • Strategically, firms are focused on managing raw material price volatility, with some finding that supply chain regionalization in chemical production can reduce exposure by 10% compared to global sourcing models. This involves developing new strategies for navigating complex regulatory frameworks, including understanding the chemical requirements for seismic isolation bearings.

What are the key market drivers leading to the rise in the adoption of Rubber Processing Chemicals Industry?

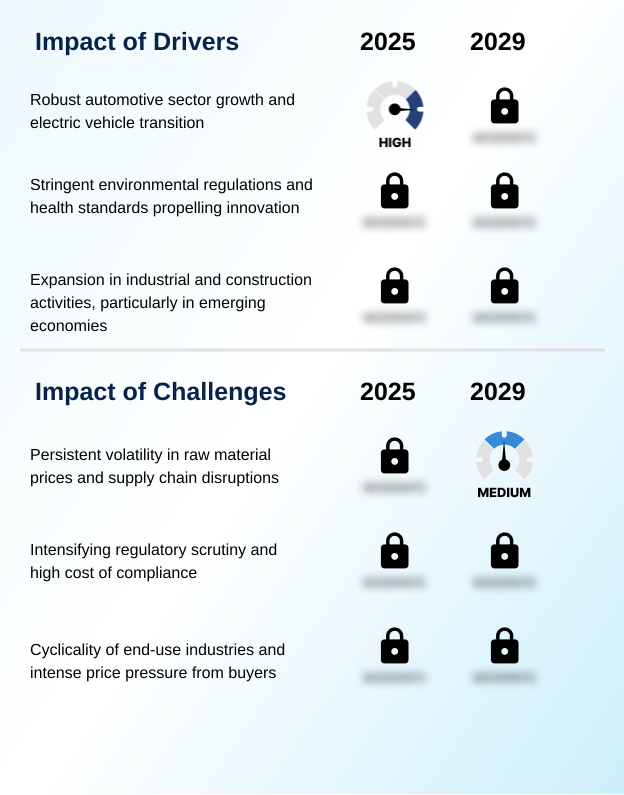
  • The market's primary driver is the robust growth of the automotive sector, significantly amplified by the global transition toward electric vehicles.

  • The evolution of the automotive industry is a primary market driver, with the transition to EVs creating demand for specialized rubber compounds and the associated chemicals.
  • The need for lightweighting components to increase vehicle range by up to 5% fuels innovation in materials that depend on specific bonding agents and blowing agents to reduce weight by 10% without sacrificing performance.
  • This trend necessitates advanced cure characteristics and excellent scorch safety during processing. Beyond automotive, expansion in construction drives demand for products like seismic isolation bearings and materials incorporating flame retardants like aluminum trihydrate (ath).
  • The use of pre-vulcanization inhibitors is critical in these complex applications. Demand from these diverse sectors provides market stability, balancing the intense buyer bargaining power found in the automotive sphere.

What are the market trends shaping the Rubber Processing Chemicals Industry?

  • The market is experiencing a significant trend defined by the accelerating industry-wide shift toward sustainable and green rubber processing chemicals. This movement is driven by corporate ESG mandates and increasing consumer demand for environmentally responsible products.

  • A defining trend is the industry-wide pivot to sustainability, driven by corporate esg mandates and the high cost-of-compliance with environmental regulations. This manifests in the adoption of circular economy principles through chemicals that support the use of ground tire rubber (gtr) and devulcanized elastomers, improving material efficiency by over 15%.
  • There is a strong push away from traditional petrochemical feedstocks toward bio-based feedstocks to reduce carbon footprints by up to 25%. This shift fuels demand for innovative products like non-nitrosamine generating accelerators and halogen-free flame retardants (hffr).
  • The development of multi-functional additives and advanced silane coupling agents that are more sustainable further exemplifies this trend, reshaping supplier-customer dynamics and supply chain visibility.

What challenges does the Rubber Processing Chemicals Industry face during its growth?

  • Persistent volatility in raw material prices, coupled with frequent supply chain disruptions, presents a key challenge to the industry's growth trajectory.

  • A persistent challenge is economic volatility, which impacts raw material prices derived from petrochemicals, with costs fluctuating over 30% in a single quarter. This complicates forecasting for export-oriented manufacturing. Furthermore, intensifying regulatory scrutiny, such as new rules on non-exhaust particulate emissions, adds significant compliance costs, which can increase overhead by 15%.
  • Manufacturers must constantly innovate the polymer matrix to improve wear resistance and rolling resistance while managing these financial pressures. Optimizing the crosslinking reaction to build a robust vulcanizate network and ensuring ideal rheological properties are constant technical hurdles. Poor polymer-filler interaction can undermine performance, making material science expertise critical in this demanding environment.

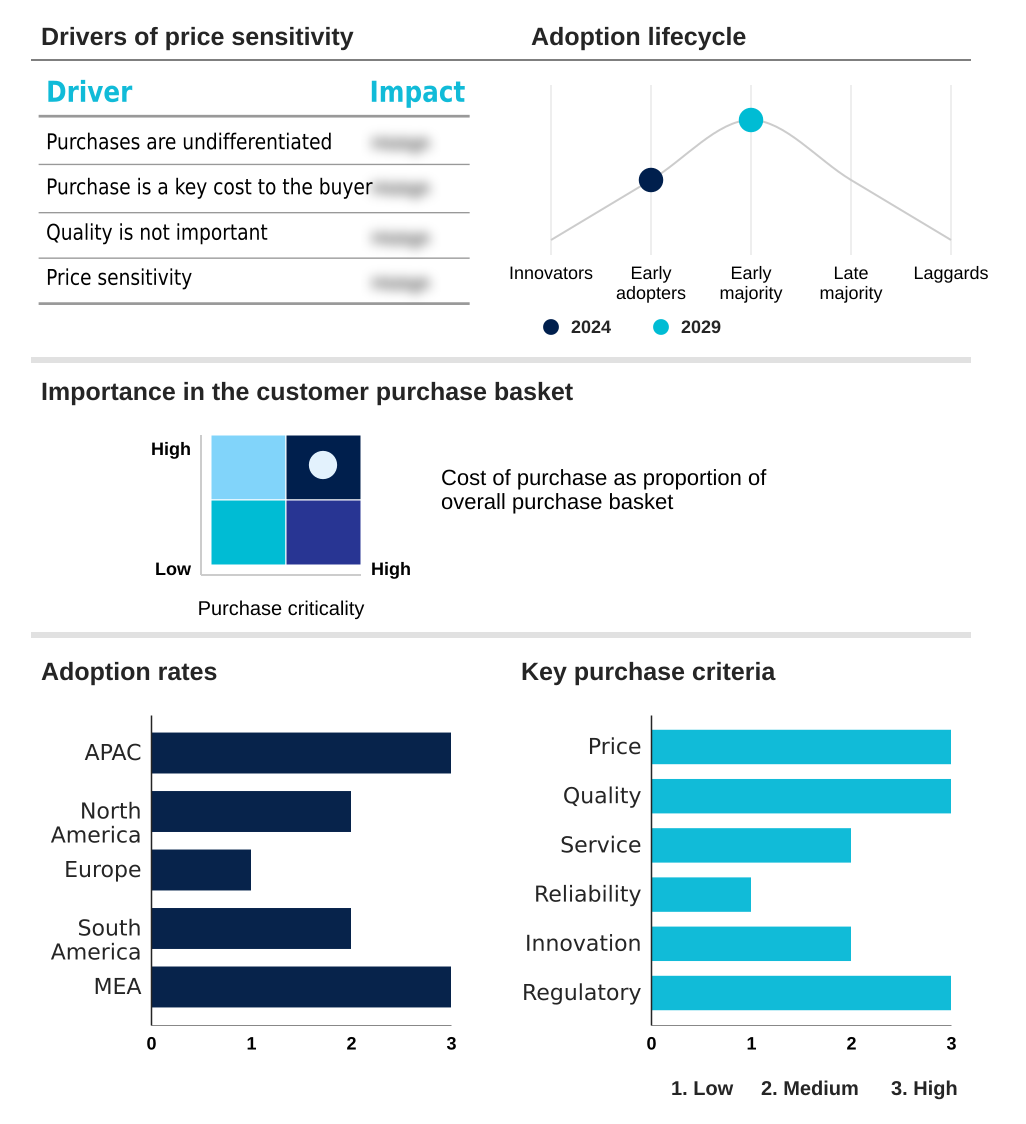
Exclusive Technavio Analysis on Customer Landscape

The rubber processing chemicals market forecasting report includes the adoption lifecycle of the market, covering from the innovator’s stage to the laggard’s stage. It focuses on adoption rates in different regions based on penetration. Furthermore, the rubber processing chemicals market report also includes key purchase criteria and drivers of price sensitivity to help companies evaluate and develop their market growth analysis strategies.

Customer Landscape of Rubber Processing Chemicals Industry

Competitive Landscape

Companies are implementing various strategies, such as strategic alliances, rubber processing chemicals market forecast, partnerships, mergers and acquisitions, geographical expansion, and product/service launches, to enhance their presence in the industry.

Akzo Nobel NV - Delivers patented bimodal epoxy technology for advanced chemical-resistant linings, enhancing durability and performance in harsh industrial environments.

The industry research and growth report includes detailed analyses of the competitive landscape of the market and information about key companies, including:

  • Akzo Nobel NV
  • Arkema Group
  • BASF SE
  • China Petrochemical Corp.
  • CHINA SUNSINE LTD.
  • Eastman Chemical Co.
  • Finorchem Ltd
  • Flexsys Inc.
  • Kemai Chemical Co. Ltd.
  • Kumho Petrochemical Co. Ltd.
  • Lanxess AG
  • NOCIL Ltd.
  • R.T. Vanderbilt Holding Co. Inc.
  • Sennics Co Ltd.
  • Huatai Chemical Co Ltd.
  • Solvay SA
  • Sumitomo Chemicals
  • Willing Materials Co Ltd.
  • Zhedongxlangzhu Co Ltd.

Qualitative and quantitative analysis of companies has been conducted to help clients understand the wider business environment as well as the strengths and weaknesses of key industry players. Data is qualitatively analyzed to categorize companies as pure play, category-focused, industry-focused, and diversified; it is quantitatively analyzed to categorize companies as dominant, leading, strong, tentative, and weak.

Recent Development and News in Rubber processing chemicals market

  • In August, 2024, GreenChem Innovations acquired BioFormulate Solutions, a specialist in bio-based processing aids derived from plant oils, for USD 75 million to bolster its sustainable chemicals portfolio.
  • In November, 2024, EuroChem Advanced Materials launched its new line of 'NitroSafe' vulcanization accelerators, becoming the first major producer to offer a complete portfolio of non-nitrosamine generating alternatives compliant with upcoming EU regulations.
  • In February, 2025, OmniPlast Technologies announced a strategic partnership with DataChem AI to integrate a predictive modeling platform into its R&D process, aiming to reduce new rubber compound development time by 40%.
  • In May, 2025, AsiaChem Group broke ground on a new USD 200 million manufacturing facility in Mexico to produce high-performance antidegradants and specialty chemicals for the growing North American electric vehicle tire market.

Dive into Technavio’s robust research methodology, blending expert interviews, extensive data synthesis, and validated models for unparalleled Rubber Processing Chemicals Market insights. See full methodology.

Market Scope
Page number 295
Base year 2024
Historic period 2019-2023
Forecast period 2025-2029
Growth momentum & CAGR Accelerate at a CAGR of 5%
Market growth 2025-2029 USD 1702.4 million
Market structure Fragmented
YoY growth 2024-2025(%) 4.9%
Key countries China, Japan, India, South Korea, Australia, Indonesia, US, Canada, Mexico, Germany, UK, France, Italy, Spain, The Netherlands, Brazil, Argentina, Colombia, Saudi Arabia, South Africa, UAE, Israel and Turkey
Competitive landscape Leading Companies, Market Positioning of Companies, Competitive Strategies, and Industry Risks

Request Free Sample

Research Analyst Overview

  • The rubber processing chemicals market is defined by its role in transforming raw natural rubber and synthetic rubber into high-performance materials. The vulcanization process relies on a complex interplay of vulcanization accelerators, antidegradants, and processing aids to build a robust vulcanizate network.
  • Key polymers like styrene-butadiene rubber (sbr), polybutadiene rubber (br), and nitrile rubber (nbr) require specific formulations to optimize cure characteristics. For instance, achieving ideal scorch safety and rheological properties is critical.
  • A boardroom-level focus on sustainability is reshaping portfolios, driving investment in non-nitrosamine generating alternatives and bio-based feedstocks to mitigate risks associated with chemicals like p-phenylenediamine (ppd) and its derivative, 6ppd-quinone. Innovations in ethylene propylene diene monomer (epdm) compounds demand superior antiozonants.
  • The push for EV efficiency has intensified focus on reducing rolling resistance and improving wear resistance, dependent on the polymer-filler interaction between silica fillers and the polymer matrix, facilitated by silane coupling agents. This has led to a 15% improvement in tread life for some premium tire lines.
  • The industry is also developing halogen-free flame retardants (hffr) such as aluminum trihydrate (ath) and magnesium dihydroxide (mdh), alongside specialized bonding agents, blowing agents, and pre-vulcanization inhibitors. This includes multi-functional additives that enhance the crosslinking reaction and facilitate use of ground tire rubber (gtr) and devulcanized elastomers.

What are the Key Data Covered in this Rubber Processing Chemicals Market Research and Growth Report?

  • What is the expected growth of the Rubber Processing Chemicals Market between 2025 and 2029?

    • USD 1.70 billion, at a CAGR of 5%

  • What segmentation does the market report cover?

    • The report is segmented by Material Type (Synthetic, and Natural), Type (Tire, and Non Tire), Product (Accelerators, Anti degradants, Flame retardants, Processing aid, and Others) and Geography (APAC, North America, Europe, South America, Middle East and Africa)

  • Which regions are analyzed in the report?

    • APAC, North America, Europe, South America and Middle East and Africa

  • What are the key growth drivers and market challenges?

    • Robust automotive sector growth and electric vehicle transition, Persistent volatility in raw material prices and supply chain disruptions

  • Who are the major players in the Rubber Processing Chemicals Market?

    • Akzo Nobel NV, Arkema Group, BASF SE, China Petrochemical Corp., CHINA SUNSINE LTD., Eastman Chemical Co., Finorchem Ltd, Flexsys Inc., Kemai Chemical Co. Ltd., Kumho Petrochemical Co. Ltd., Lanxess AG, NOCIL Ltd., R.T. Vanderbilt Holding Co. Inc., Sennics Co Ltd., Huatai Chemical Co Ltd., Solvay SA, Sumitomo Chemicals, Willing Materials Co Ltd. and Zhedongxlangzhu Co Ltd.

Market Research Insights

  • Market dynamics are increasingly shaped by strategic responses to economic volatility and a focus on operational excellence. Companies are leveraging advanced supply chain visibility tools to mitigate the impact of fluctuating petrochemical feedstocks, with leading firms reducing logistical delays by over 15%. The high buyer bargaining power of major tire manufacturers necessitates a focus on value, not just cost.
  • Adherence to stringent standards, such as tire labeling regulation, drives innovation in high-purity chemicals. This push for performance is balanced by a nearshoring trend aimed at improving just-in-time delivery capabilities, which has proven to cut inventory carrying costs by up to 20% in certain supply chains. Navigating this landscape requires balancing price sensitivity with the high cost-of-compliance.

We can help! Our analysts can customize this rubber processing chemicals market research report to meet your requirements.

Get in touch

1. Executive Summary

1.1 Market overview

Executive Summary - Chart on Market Overview
Executive Summary - Data Table on Market Overview
Executive Summary - Chart on Global Market Characteristics
Executive Summary - Chart on Market by Geography
Executive Summary - Chart on Market Segmentation by Material Type
Executive Summary - Chart on Market Segmentation by Type
Executive Summary - Chart on Market Segmentation by Product
Executive Summary - Chart on Incremental Growth
Executive Summary - Data Table on Incremental Growth
Executive Summary - Chart on Company Market Positioning

2. Technavio Analysis

2.1 Analysis of price sensitivity, lifecycle, customer purchase basket, adoption rates, and purchase criteria

2.2 Criticality of inputs and Factors of differentiation

Chart on Overview on criticality of inputs and factors of differentiation

2.3 Factors of disruption

Chart on Overview on factors of disruption

2.4 Impact of drivers and challenges

Chart on Impact of drivers and challenges in 2024 and 2029

3. Market Landscape

3.1 Market ecosystem

Chart on Parent Market
Data Table on - Parent Market

3.2 Market characteristics

Chart on Market characteristics analysis

3.3 Value chain analysis

Chart on Value chain analysis

4. Market Sizing

4.1 Market definition

Data Table on Offerings of companies included in the market definition

4.2 Market segment analysis

Market segments

4.3 Market size 2024

4.4 Market outlook: Forecast for 2024-2029

Chart on Global - Market size and forecast 2024-2029 ($ million)
Data Table on Global - Market size and forecast 2024-2029 ($ million)
Chart on Global Market: Year-over-year growth 2024-2029 (%)
Data Table on Global Market: Year-over-year growth 2024-2029 (%)

5. Historic Market Size

5.1 Global Rubber Processing Chemicals Market 2019 - 2023

Historic Market Size - Data Table on Global Rubber Processing Chemicals Market 2019 - 2023 ($ million)

5.2 Material Type segment analysis 2019 - 2023

Historic Market Size - Material Type Segment 2019 - 2023 ($ million)

5.3 Type segment analysis 2019 - 2023

Historic Market Size - Type Segment 2019 - 2023 ($ million)

5.4 Product segment analysis 2019 - 2023

Historic Market Size - Product Segment 2019 - 2023 ($ million)

5.5 Geography segment analysis 2019 - 2023

Historic Market Size - Geography Segment 2019 - 2023 ($ million)

5.6 Country segment analysis 2019 - 2023

Historic Market Size - Country Segment 2019 - 2023 ($ million)

6. Qualitative Analysis

6.1 The AI impact on global rubber processing chemicals market

7. Five Forces Analysis

7.1 Five forces summary

Five forces analysis - Comparison between 2024 and 2029

7.2 Bargaining power of buyers

Bargaining power of buyers - Impact of key factors 2024 and 2029

7.3 Bargaining power of suppliers

Bargaining power of suppliers - Impact of key factors in 2024 and 2029

7.4 Threat of new entrants

Threat of new entrants - Impact of key factors in 2024 and 2029

7.5 Threat of substitutes

Threat of substitutes - Impact of key factors in 2024 and 2029

7.6 Threat of rivalry

Threat of rivalry - Impact of key factors in 2024 and 2029

7.7 Market condition

Chart on Market condition - Five forces 2024 and 2029

8. Market Segmentation by Material Type

8.1 Market segments

Chart on Market Segmentation by Material Type - Market share 2024-2029 (%)
Data Table on Market Segmentation by Material Type - Market share 2024-2029 (%)

8.2 Comparison by Market Segmentation by Material Type

Chart on Comparison by Market Segmentation by Material Type
Data Table on Comparison by Market Segmentation by Material Type

8.3 Synthetic - Market size and forecast 2024-2029

Chart on Synthetic - Market size and forecast 2024-2029 ($ million)
Data Table on Synthetic - Market size and forecast 2024-2029 ($ million)
Chart on Synthetic - Year-over-year growth 2024-2029 (%)
Data Table on Synthetic - Year-over-year growth 2024-2029 (%)

8.4 Natural - Market size and forecast 2024-2029

Chart on Natural - Market size and forecast 2024-2029 ($ million)
Data Table on Natural - Market size and forecast 2024-2029 ($ million)
Chart on Natural - Year-over-year growth 2024-2029 (%)
Data Table on Natural - Year-over-year growth 2024-2029 (%)

8.5 Market opportunity by Market Segmentation by Material Type

Market opportunity by Market Segmentation by Material Type ($ million)
Data Table on Market opportunity by Market Segmentation by Material Type ($ million)

9. Market Segmentation by Type

9.1 Market segments

Chart on Type - Market share 2024-2029 (%)
Data Table on Type - Market share 2024-2029 (%)

9.2 Comparison by Type

Chart on Comparison by Type
Data Table on Comparison by Type

9.3 Tire - Market size and forecast 2024-2029

Chart on Tire - Market size and forecast 2024-2029 ($ million)
Data Table on Tire - Market size and forecast 2024-2029 ($ million)
Chart on Tire - Year-over-year growth 2024-2029 (%)
Data Table on Tire - Year-over-year growth 2024-2029 (%)

9.4 Non Tire - Market size and forecast 2024-2029

Chart on Non Tire - Market size and forecast 2024-2029 ($ million)
Data Table on Non Tire - Market size and forecast 2024-2029 ($ million)
Chart on Non Tire - Year-over-year growth 2024-2029 (%)
Data Table on Non Tire - Year-over-year growth 2024-2029 (%)

9.5 Market opportunity by Type

Market opportunity by Type ($ million)
Data Table on Market opportunity by Type ($ million)

10. Market Segmentation by Product

10.1 Market segments

Chart on Product - Market share 2024-2029 (%)
Data Table on Product - Market share 2024-2029 (%)

10.2 Comparison by Product

Chart on Comparison by Product
Data Table on Comparison by Product

10.3 Accelerators - Market size and forecast 2024-2029

Chart on Accelerators - Market size and forecast 2024-2029 ($ million)
Data Table on Accelerators - Market size and forecast 2024-2029 ($ million)
Chart on Accelerators - Year-over-year growth 2024-2029 (%)
Data Table on Accelerators - Year-over-year growth 2024-2029 (%)

10.4 Anti degradants - Market size and forecast 2024-2029

Chart on Anti degradants - Market size and forecast 2024-2029 ($ million)
Data Table on Anti degradants - Market size and forecast 2024-2029 ($ million)
Chart on Anti degradants - Year-over-year growth 2024-2029 (%)
Data Table on Anti degradants - Year-over-year growth 2024-2029 (%)

10.5 Flame retardants - Market size and forecast 2024-2029

Chart on Flame retardants - Market size and forecast 2024-2029 ($ million)
Data Table on Flame retardants - Market size and forecast 2024-2029 ($ million)
Chart on Flame retardants - Year-over-year growth 2024-2029 (%)
Data Table on Flame retardants - Year-over-year growth 2024-2029 (%)

10.6 Processing aid - Market size and forecast 2024-2029

Chart on Processing aid - Market size and forecast 2024-2029 ($ million)
Data Table on Processing aid - Market size and forecast 2024-2029 ($ million)
Chart on Processing aid - Year-over-year growth 2024-2029 (%)
Data Table on Processing aid - Year-over-year growth 2024-2029 (%)

10.7 Others - Market size and forecast 2024-2029

Chart on Others - Market size and forecast 2024-2029 ($ million)
Data Table on Others - Market size and forecast 2024-2029 ($ million)
Chart on Others - Year-over-year growth 2024-2029 (%)
Data Table on Others - Year-over-year growth 2024-2029 (%)

10.8 Market opportunity by Product

Market opportunity by Product ($ million)
Data Table on Market opportunity by Product ($ million)

11. Customer Landscape

11.1 Customer landscape overview

Analysis of price sensitivity, lifecycle, customer purchase basket, adoption rates, and purchase criteria

12. Geographic Landscape

12.1 Geographic segmentation

Chart on Market share by geography 2024-2029 (%)
Data Table on Market share by geography 2024-2029 (%)

12.2 Geographic comparison

Chart on Geographic comparison
Data Table on Geographic comparison

12.3 APAC - Market size and forecast 2024-2029

Chart on APAC - Market size and forecast 2024-2029 ($ million)
Data Table on APAC - Market size and forecast 2024-2029 ($ million)
Chart on APAC - Year-over-year growth 2024-2029 (%)
Data Table on APAC - Year-over-year growth 2024-2029 (%)
Chart on Regional Comparison - APAC
Data Table on Regional Comparison - APAC

12.3.1 China - Market size and forecast 2024-2029

Chart on China - Market size and forecast 2024-2029 ($ million)
Data Table on China - Market size and forecast 2024-2029 ($ million)
Chart on China - Year-over-year growth 2024-2029 (%)
Data Table on China - Year-over-year growth 2024-2029 (%)

12.3.2 Japan - Market size and forecast 2024-2029

Chart on Japan - Market size and forecast 2024-2029 ($ million)
Data Table on Japan - Market size and forecast 2024-2029 ($ million)
Chart on Japan - Year-over-year growth 2024-2029 (%)
Data Table on Japan - Year-over-year growth 2024-2029 (%)

12.3.3 India - Market size and forecast 2024-2029

Chart on India - Market size and forecast 2024-2029 ($ million)
Data Table on India - Market size and forecast 2024-2029 ($ million)
Chart on India - Year-over-year growth 2024-2029 (%)
Data Table on India - Year-over-year growth 2024-2029 (%)

12.3.4 South Korea - Market size and forecast 2024-2029

Chart on South Korea - Market size and forecast 2024-2029 ($ million)
Data Table on South Korea - Market size and forecast 2024-2029 ($ million)
Chart on South Korea - Year-over-year growth 2024-2029 (%)
Data Table on South Korea - Year-over-year growth 2024-2029 (%)

12.3.5 Australia - Market size and forecast 2024-2029

Chart on Australia - Market size and forecast 2024-2029 ($ million)
Data Table on Australia - Market size and forecast 2024-2029 ($ million)
Chart on Australia - Year-over-year growth 2024-2029 (%)
Data Table on Australia - Year-over-year growth 2024-2029 (%)

12.3.6 Indonesia - Market size and forecast 2024-2029

Chart on Indonesia - Market size and forecast 2024-2029 ($ million)
Data Table on Indonesia - Market size and forecast 2024-2029 ($ million)
Chart on Indonesia - Year-over-year growth 2024-2029 (%)
Data Table on Indonesia - Year-over-year growth 2024-2029 (%)

12.4 North America - Market size and forecast 2024-2029

Chart on North America - Market size and forecast 2024-2029 ($ million)
Data Table on North America - Market size and forecast 2024-2029 ($ million)
Chart on North America - Year-over-year growth 2024-2029 (%)
Data Table on North America - Year-over-year growth 2024-2029 (%)
Chart on Regional Comparison - North America
Data Table on Regional Comparison - North America

12.4.1 US - Market size and forecast 2024-2029

Chart on US - Market size and forecast 2024-2029 ($ million)
Data Table on US - Market size and forecast 2024-2029 ($ million)
Chart on US - Year-over-year growth 2024-2029 (%)
Data Table on US - Year-over-year growth 2024-2029 (%)

12.4.2 Canada - Market size and forecast 2024-2029

Chart on Canada - Market size and forecast 2024-2029 ($ million)
Data Table on Canada - Market size and forecast 2024-2029 ($ million)
Chart on Canada - Year-over-year growth 2024-2029 (%)
Data Table on Canada - Year-over-year growth 2024-2029 (%)

12.4.3 Mexico - Market size and forecast 2024-2029

Chart on Mexico - Market size and forecast 2024-2029 ($ million)
Data Table on Mexico - Market size and forecast 2024-2029 ($ million)
Chart on Mexico - Year-over-year growth 2024-2029 (%)
Data Table on Mexico - Year-over-year growth 2024-2029 (%)

12.5 Europe - Market size and forecast 2024-2029

Chart on Europe - Market size and forecast 2024-2029 ($ million)
Data Table on Europe - Market size and forecast 2024-2029 ($ million)
Chart on Europe - Year-over-year growth 2024-2029 (%)
Data Table on Europe - Year-over-year growth 2024-2029 (%)
Chart on Regional Comparison - Europe
Data Table on Regional Comparison - Europe

12.5.1 Germany - Market size and forecast 2024-2029

Chart on Germany - Market size and forecast 2024-2029 ($ million)
Data Table on Germany - Market size and forecast 2024-2029 ($ million)
Chart on Germany - Year-over-year growth 2024-2029 (%)
Data Table on Germany - Year-over-year growth 2024-2029 (%)

12.5.2 UK - Market size and forecast 2024-2029

Chart on UK - Market size and forecast 2024-2029 ($ million)
Data Table on UK - Market size and forecast 2024-2029 ($ million)
Chart on UK - Year-over-year growth 2024-2029 (%)
Data Table on UK - Year-over-year growth 2024-2029 (%)

12.5.3 France - Market size and forecast 2024-2029

Chart on France - Market size and forecast 2024-2029 ($ million)
Data Table on France - Market size and forecast 2024-2029 ($ million)
Chart on France - Year-over-year growth 2024-2029 (%)
Data Table on France - Year-over-year growth 2024-2029 (%)

12.5.4 Italy - Market size and forecast 2024-2029

Chart on Italy - Market size and forecast 2024-2029 ($ million)
Data Table on Italy - Market size and forecast 2024-2029 ($ million)
Chart on Italy - Year-over-year growth 2024-2029 (%)
Data Table on Italy - Year-over-year growth 2024-2029 (%)

12.5.5 Spain - Market size and forecast 2024-2029

Chart on Spain - Market size and forecast 2024-2029 ($ million)
Data Table on Spain - Market size and forecast 2024-2029 ($ million)
Chart on Spain - Year-over-year growth 2024-2029 (%)
Data Table on Spain - Year-over-year growth 2024-2029 (%)

12.5.6 The Netherlands - Market size and forecast 2024-2029

Chart on The Netherlands - Market size and forecast 2024-2029 ($ million)
Data Table on The Netherlands - Market size and forecast 2024-2029 ($ million)
Chart on The Netherlands - Year-over-year growth 2024-2029 (%)
Data Table on The Netherlands - Year-over-year growth 2024-2029 (%)

12.6 South America - Market size and forecast 2024-2029

Chart on South America - Market size and forecast 2024-2029 ($ million)
Data Table on South America - Market size and forecast 2024-2029 ($ million)
Chart on South America - Year-over-year growth 2024-2029 (%)
Data Table on South America - Year-over-year growth 2024-2029 (%)
Chart on Regional Comparison - South America
Data Table on Regional Comparison - South America

12.6.1 Brazil - Market size and forecast 2024-2029

Chart on Brazil - Market size and forecast 2024-2029 ($ million)
Data Table on Brazil - Market size and forecast 2024-2029 ($ million)
Chart on Brazil - Year-over-year growth 2024-2029 (%)
Data Table on Brazil - Year-over-year growth 2024-2029 (%)

12.6.2 Argentina - Market size and forecast 2024-2029

Chart on Argentina - Market size and forecast 2024-2029 ($ million)
Data Table on Argentina - Market size and forecast 2024-2029 ($ million)
Chart on Argentina - Year-over-year growth 2024-2029 (%)
Data Table on Argentina - Year-over-year growth 2024-2029 (%)

12.6.3 Colombia - Market size and forecast 2024-2029

Chart on Colombia - Market size and forecast 2024-2029 ($ million)
Data Table on Colombia - Market size and forecast 2024-2029 ($ million)
Chart on Colombia - Year-over-year growth 2024-2029 (%)
Data Table on Colombia - Year-over-year growth 2024-2029 (%)

12.7 Middle East and Africa - Market size and forecast 2024-2029

Chart on Middle East and Africa - Market size and forecast 2024-2029 ($ million)
Data Table on Middle East and Africa - Market size and forecast 2024-2029 ($ million)
Chart on Middle East and Africa - Year-over-year growth 2024-2029 (%)
Data Table on Middle East and Africa - Year-over-year growth 2024-2029 (%)
Chart on Regional Comparison - Middle East and Africa
Data Table on Regional Comparison - Middle East and Africa

12.7.1 Saudi Arabia - Market size and forecast 2024-2029

Chart on Saudi Arabia - Market size and forecast 2024-2029 ($ million)
Data Table on Saudi Arabia - Market size and forecast 2024-2029 ($ million)
Chart on Saudi Arabia - Year-over-year growth 2024-2029 (%)
Data Table on Saudi Arabia - Year-over-year growth 2024-2029 (%)

12.7.2 South Africa - Market size and forecast 2024-2029

Chart on South Africa - Market size and forecast 2024-2029 ($ million)
Data Table on South Africa - Market size and forecast 2024-2029 ($ million)
Chart on South Africa - Year-over-year growth 2024-2029 (%)
Data Table on South Africa - Year-over-year growth 2024-2029 (%)

12.7.3 UAE - Market size and forecast 2024-2029

Chart on UAE - Market size and forecast 2024-2029 ($ million)
Data Table on UAE - Market size and forecast 2024-2029 ($ million)
Chart on UAE - Year-over-year growth 2024-2029 (%)
Data Table on UAE - Year-over-year growth 2024-2029 (%)

12.7.4 Israel - Market size and forecast 2024-2029

Chart on Israel - Market size and forecast 2024-2029 ($ million)
Data Table on Israel - Market size and forecast 2024-2029 ($ million)
Chart on Israel - Year-over-year growth 2024-2029 (%)
Data Table on Israel - Year-over-year growth 2024-2029 (%)

12.7.5 Turkey - Market size and forecast 2024-2029

Chart on Turkey - Market size and forecast 2024-2029 ($ million)
Data Table on Turkey - Market size and forecast 2024-2029 ($ million)
Chart on Turkey - Year-over-year growth 2024-2029 (%)
Data Table on Turkey - Year-over-year growth 2024-2029 (%)

12.8 Market opportunity by geography

Market opportunity by geography ($ million)
Data Tables on Market opportunity by geography ($ million)

13. Drivers, Challenges, and Opportunity

13.1 Market drivers

Robust automotive sector growth and electric vehicle transition
Stringent environmental regulations and health standards propelling innovation
Expansion in industrial and construction activities, particularly in emerging economies

13.2 Market challenges

Persistent volatility in raw material prices and supply chain disruptions
Intensifying regulatory scrutiny and high cost of compliance
Cyclicality of end-use industries and intense price pressure from buyers

13.3 Impact of drivers and challenges

Impact of drivers and challenges in 2024 and 2029

13.4 Market opportunities

Accelerating shift towards sustainable and green rubber processing chemicals
Innovation in high-performance chemicals for advanced applications
Integration of digitalization and data analytics in formulation and manufacturing

14. Competitive Landscape

14.1 Overview

14.2

Overview on criticality of inputs and factors of differentiation

14.3 Landscape disruption

Overview on factors of disruption

14.4 Industry risks

Impact of key risks on business

15. Competitive Analysis

15.1 Companies profiled

Companies covered

15.2 Company ranking index

15.3 Market positioning of companies

Matrix on companies position and classification

15.4 Akzo Nobel NV

Akzo Nobel NV - Overview
Akzo Nobel NV - Business segments
Akzo Nobel NV - Key news
Akzo Nobel NV - Key offerings
Akzo Nobel NV - Segment focus
SWOT

15.5 Arkema Group

Arkema Group - Overview
Arkema Group - Business segments
Arkema Group - Key news
Arkema Group - Key offerings
Arkema Group - Segment focus
SWOT

15.6 BASF SE

BASF SE - Overview
BASF SE - Business segments
BASF SE - Key news
BASF SE - Key offerings
BASF SE - Segment focus
SWOT

15.7 China Petrochemical Corp.

China Petrochemical Corp. - Overview
China Petrochemical Corp. - Business segments
China Petrochemical Corp. - Key offerings
China Petrochemical Corp. - Segment focus
SWOT

15.8 CHINA SUNSINE LTD.

CHINA SUNSINE LTD. - Overview
CHINA SUNSINE LTD. - Product / Service
CHINA SUNSINE LTD. - Key offerings
SWOT

15.9 Eastman Chemical Co.

Eastman Chemical Co. - Overview
Eastman Chemical Co. - Business segments
Eastman Chemical Co. - Key news
Eastman Chemical Co. - Key offerings
Eastman Chemical Co. - Segment focus
SWOT

15.10 Finorchem Ltd

Finorchem Ltd - Overview
Finorchem Ltd - Product / Service
Finorchem Ltd - Key offerings
SWOT

15.11 Flexsys Inc.

Flexsys Inc. - Overview
Flexsys Inc. - Product / Service
Flexsys Inc. - Key offerings
SWOT

15.12 Kumho Petrochemical Co. Ltd.

Kumho Petrochemical Co. Ltd. - Overview
Kumho Petrochemical Co. Ltd. - Product / Service
Kumho Petrochemical Co. Ltd. - Key offerings
SWOT

15.13 Lanxess AG

Lanxess AG - Overview
Lanxess AG - Business segments
Lanxess AG - Key news
Lanxess AG - Key offerings
Lanxess AG - Segment focus
SWOT

15.14 NOCIL Ltd.

NOCIL Ltd. - Overview
NOCIL Ltd. - Product / Service
NOCIL Ltd. - Key offerings
SWOT

15.15 Huatai Chemical Co Ltd.

Huatai Chemical Co Ltd. - Overview
Huatai Chemical Co Ltd. - Product / Service
Huatai Chemical Co Ltd. - Key offerings
SWOT

15.16 Solvay SA

Solvay SA - Overview
Solvay SA - Business segments
Solvay SA - Key news
Solvay SA - Key offerings
Solvay SA - Segment focus
SWOT

15.17 Willing Materials Co Ltd.

Willing Materials Co Ltd. - Overview
Willing Materials Co Ltd. - Product / Service
Willing Materials Co Ltd. - Key offerings
SWOT

15.18 Zhedongxlangzhu Co Ltd.

Zhedongxlangzhu Co Ltd. - Overview
Zhedongxlangzhu Co Ltd. - Product / Service
Zhedongxlangzhu Co Ltd. - Key offerings
SWOT

16. Appendix

16.1 Scope of the report

Market definition
Objectives
Notes and caveats

16.2 Inclusions and exclusions checklist

Inclusions checklist
Exclusions checklist

16.3 Currency conversion rates for US$

16.4 Research methodology

16.5 Data procurement

Information sources

16.6 Data validation

16.7 Validation techniques employed for market sizing

16.8 Data synthesis

16.9 360 degree market analysis

16.10 List of abbreviations

Research Methodology

Technavio presents a detailed picture of the market by way of study, synthesis, and summation of data from multiple sources. The analysts have presented the various facets of the market with a particular focus on identifying the key industry influencers. The data thus presented is comprehensive, reliable, and the result of extensive research, both primary and secondary.

INFORMATION SOURCES

Primary sources

  • Manufacturers and suppliers
  • Channel partners
  • Industry experts
  • Strategic decision makers

Secondary sources

  • Industry journals and periodicals
  • Government data
  • Financial reports of key industry players
  • Historical data
  • Press releases

DATA ANALYSIS

Data Synthesis

  • Collation of data
  • Estimation of key figures
  • Analysis of derived insights

Data Validation

  • Triangulation with data models
  • Reference against proprietary databases
  • Corroboration with industry experts

REPORT WRITING

Qualitative

  • Market drivers
  • Market challenges
  • Market trends
  • Five forces analysis

Quantitative

  • Market size and forecast
  • Market segmentation
  • Geographical insights
  • Competitive landscape

Interested in this report?

Get your sample now to see our research methodology and insights!

Download Now

Frequently Asked Questions

Rubber Processing Chemicals market growth will increase by USD 1702.4 million during 2025-2029.

The Rubber Processing Chemicals market is expected to grow at a CAGR of 5% during 2025-2029.

Rubber Processing Chemicals market is segmented by Material type (Synthetic, Natural) Type (Tire, Non Tire) Product (Accelerators, Anti degradants, Flame retardants, Processing aid, Others)

Akzo Nobel NV, Arkema Group, BASF SE, China Petrochemical Corp., CHINA SUNSINE LTD., Eastman Chemical Co., Finorchem Ltd, Flexsys Inc., Kemai Chemical Co. Ltd., Kumho Petrochemical Co. Ltd., Lanxess AG, NOCIL Ltd., R.T. Vanderbilt Holding Co. Inc., Sennics Co Ltd., Huatai Chemical Co Ltd., Solvay SA, Sumitomo Chemicals, Willing Materials Co Ltd., Zhedongxlangzhu Co Ltd. are a few of the key vendors in the Rubber Processing Chemicals market.

APAC will register the highest growth rate of 42% among the other regions. Therefore, the Rubber Processing Chemicals market in APAC is expected to garner significant business opportunities for the vendors during the forecast period.

China, Japan, India, South Korea, Australia, Indonesia, US, Canada, Mexico, Germany, UK, France, Italy, Spain, The Netherlands, Brazil, Argentina, Colombia, Saudi Arabia, South Africa, UAE, Israel, Turkey

  • Robust automotive sector growth and electric vehicle transition is the driving factor this market.

The Rubber Processing Chemicals market vendors should focus on grabbing business opportunities from the Material type segment as it accounted for the largest market share in the base year.