Safety Apparel Market Analysis APAC, North America, Europe, South America, Middle East and Africa - US, China, Japan, Germany, Canada, UK - Size and Forecast 2024-2028

Safety Apparel Market Analysis APAC, North America, Europe, South America, Middle East and Africa - US, China, Japan, Germany, Canada, UK - Size and Forecast 2024-2028

Published: Jun 2024 163 Pages SKU: IRTNTR70444

Market Overview at a Glance

$16.26 B
Market Opportunity
16.79%
CAGR
13.26
YoY growth 2023-2024(%)

Safety Apparel Market Size 2024-2028

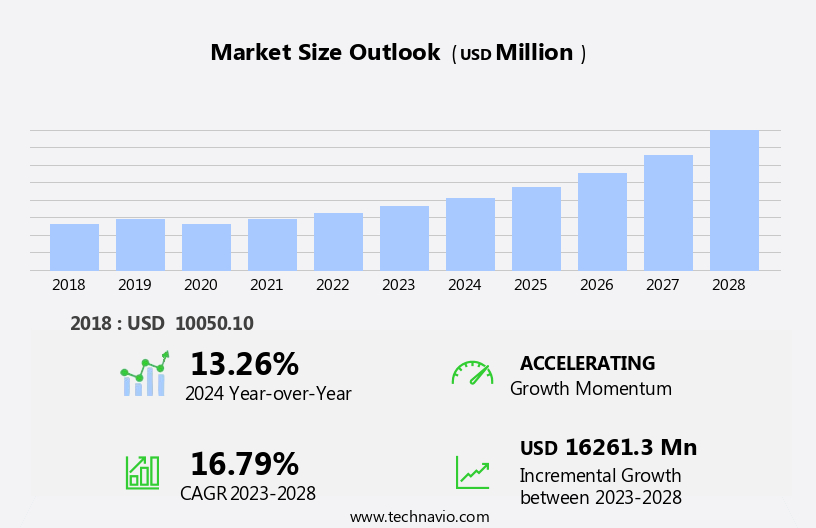
The safety apparel market size is forecast to increase by USD 16.26 billion, at a CAGR of 16.79% between 2023 and 2028.

  • The market is driven by the increasing emphasis on customization and quality in personal protective equipment. Companies are focusing on offering tailored solutions to cater to diverse industry requirements and worker preferences. Additionally, the integration of smart and wearable technology in safety apparel is gaining traction, with innovations such as temperature-regulating fabrics, real-time monitoring systems, and self-decontaminating materials enhancing worker safety and productivity. However, the market faces challenges as well. The rising cost of raw materials, particularly oil-based polymers used in the production of protective clothing, is impacting the supply chain and potentially increasing prices for end-users.
  • Furthermore, ensuring the effective implementation of advanced technologies in safety apparel, while maintaining affordability and accessibility, poses a significant challenge for market participants. Companies must navigate these obstacles through strategic partnerships, continuous research and development, and effective cost management to capitalize on the market's potential and meet the evolving needs of their customers.

What will be the Size of the Safety Apparel Market during the forecast period?

Safety Apparel Market Size

Explore in-depth regional segment analysis with market size data - historical 2018-2022 and forecasts 2024-2028 - in the full report.  
Request Free Sample

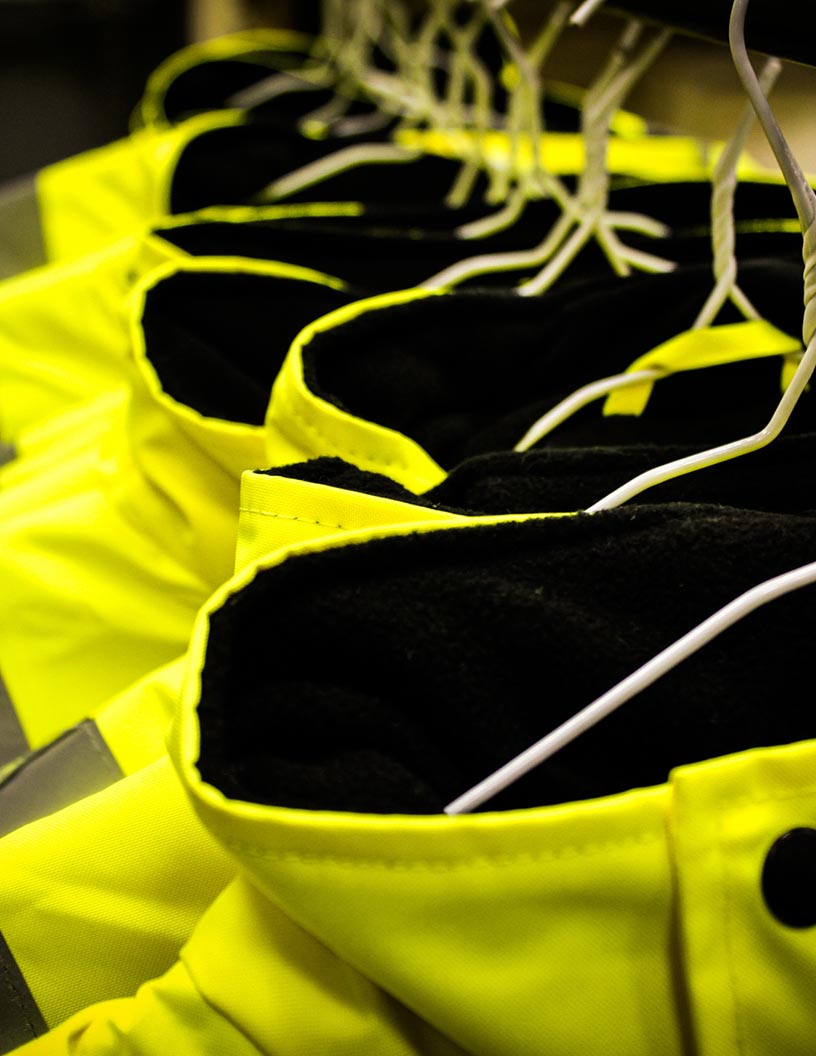
The market continues to evolve, driven by the constant need to protect workers across various sectors from occupational hazards. This dynamic market encompasses a range of products, including head protection, safety nets, safety footwear, and high-visibility clothing, among others. The ongoing unfolding of market activities is shaped by numerous factors, such as retail sales trends, product certification requirements, and compliance regulations. In the realm of head protection, hard hats and safety helmets remain essential, with continuous innovation leading to advancements in materials and design. Meanwhile, hearing and eye protection, such as ear plugs and safety glasses, are increasingly prioritized to mitigate long-term health risks.

Price competition intensifies as distribution channels expand, with e-commerce platforms and direct-to-consumer models challenging traditional retailers. Product certification, adherence to ANSI/ISEA standards, and quality control are crucial elements in maintaining brand recognition and customer trust. Environmental impact and social responsibility are gaining importance, with ethical sourcing and manufacturing safety becoming key marketing strategies. Customer segmentation and safety culture also play significant roles in shaping market trends, as organizations prioritize risk management and incident investigation to ensure a safer work environment. Product innovation continues to unfold, with flame-resistant fabrics, reflective materials, and respiratory protection leading the charge. Compliance regulations, such as OSHA standards, evolve to address emerging hazards and ensure the highest level of workplace safety.

In the realm of protective apparel, safety vests, hard hats, and safety glasses are essential components of a comprehensive safety strategy. Hazard assessment and safety audits are crucial in identifying potential risks and implementing appropriate countermeasures. The market's continuous dynamism underscores the importance of effective risk management, adherence to regulations, and ongoing innovation. As the market unfolds, it remains a vital sector in ensuring the well-being of workers and promoting a safer, more responsible business landscape.

How is this Safety Apparel Industry segmented?

The safety apparel industry research report provides comprehensive data (region-wise segment analysis), with forecasts and estimates in "USD million" for the period 2024-2028, as well as historical data from 2018-2022 for the following segments.

  • Application
    • Chemical defending
    • Flame retardant
    • Mechanical
    • High visibility
    • Others
  • Geography
    • North America
      • US
      • Canada
    • Europe
      • Germany
      • UK
    • APAC
      • China
      • Japan
    • Rest of World (ROW)

By Application Insights

The chemical defending segment is estimated to witness significant growth during the forecast period.

In the realm of occupational safety, the market for safety apparel continues to evolve, integrating various entities to ensure workplace safety and compliance. Head protection, including safety helmets and hard hats, safeguards employees from potential head injuries. Safety nets and harnesses offer fall protection, while safety footwear, made from flame-resistant fabrics and protective gloves, shield against hazardous chemicals and environmental elements. Retail sales of safety apparel, such as hi-vis jackets and safety vests, are driven by ANSI/ISEA standards and customer segmentation. CE marking and product certification are crucial for market entry, while ethical sourcing and social responsibility are essential components of manufacturing safety.

Safety training, a vital aspect of safety culture, emphasizes the importance of hazard assessment, risk management, and incident investigation. Compliance regulations, including OSHA standards, dictate the use of ear plugs, hearing protection, and eye protection. Product innovation, such as advanced respiratory protection and reflective materials, enhances the effectiveness of safety apparel. Quality control and supply chain management ensure consistent production and distribution. Price competition, distribution channels, and brand recognition further shape the dynamic the market.

Safety Apparel Market Size

Request Free Sample

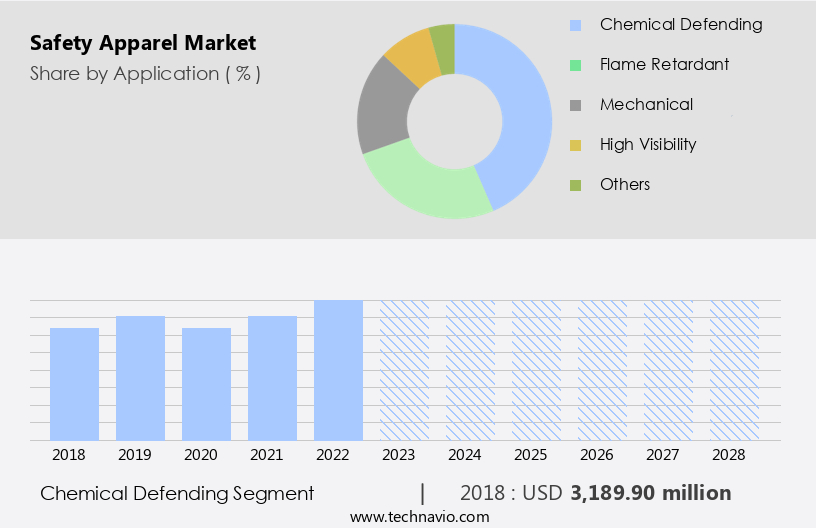
The Chemical defending segment was valued at USD 3.19 billion in 2018 and showed a gradual increase during the forecast period.

Regional Analysis

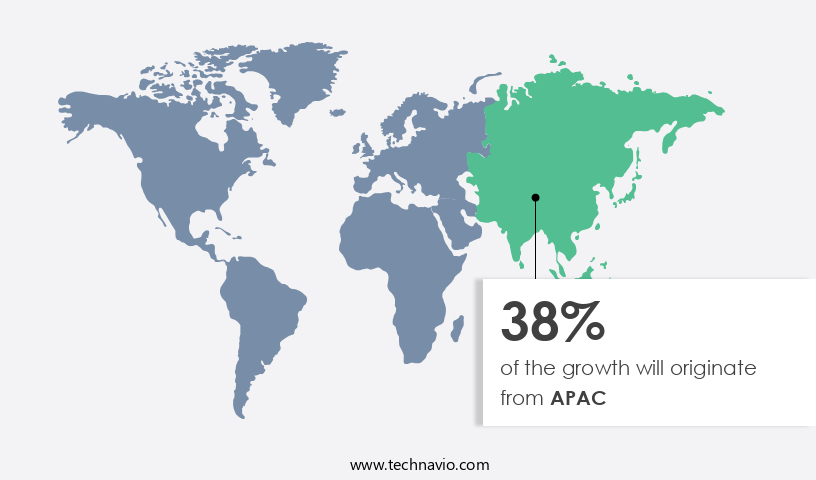
APAC is estimated to contribute 38% to the growth of the global market during the forecast period.Technavio's analysts have elaborately explained the regional trends and drivers that shape the market during the forecast period.

Safety Apparel Market Share by Geography

 Request Free Sample

The occupational safety and workplace safety markets in Japan have experienced growth due to improving economic conditions, increased investor spending, and rising consumer confidence. In the construction industry, which is a significant contributor to this trend, the Tokyo Metropolitan Government's investment in projects like waterfront development and preparations for the 2021 Summer Olympics has driven demand for safety apparel. Additionally, the growing urban population's need for new residential areas further boosts the market. Safety training is a crucial aspect of this industry, with head protection, safety footwear, and safety nets being essential components. CE marking, reflective materials, and high-visibility clothing are essential for ensuring compliance with ANSI/ISEA standards and OSHA regulations.

Flame-resistant fabrics, respiratory protection, and protective gloves are vital for construction safety and manufacturing safety. Environmental impact and social responsibility are essential considerations in the supply chain management of safety apparel. Marketing strategies focus on brand recognition and customer segmentation, with product innovation and quality control being essential for maintaining a competitive edge. Safety culture, ethical sourcing, and incident investigation are integral to risk management. Safety audits and hazard assessments ensure compliance with regulations and industry standards. Fall protection, hearing protection, eye protection, and safety vests are essential for various industries. Price competition and distribution channels are critical factors in the market, with safety glasses and product certification being essential for customer trust.

The market for safety apparel in Japan is dynamic and evolving, with a focus on innovation, manufacturing safety, and customer needs. The demand for safety apparel is expected to continue growing as industries expand and prioritize workplace safety.

Market Dynamics

Our researchers analyzed the data with 2023 as the base year, along with the key drivers, trends, and challenges. A holistic analysis of drivers will help companies refine their marketing strategies to gain a competitive advantage.

What are the key market drivers leading to the rise in the adoption of Safety Apparel Industry?

  • The market's growth is primarily driven by the significant emphasis on customization and unwavering commitment to quality in the safety apparel industry. 
  • The industrial the market is witnessing significant growth due to the increasing prioritization of manufacturing safety and a strong safety culture. Product innovation is a key driver, with manufacturers investing heavily in research and development to create multi-functional, industry-specific safety apparel that offers both protection and comfort. These advancements include lightweight, breathable, and chemical-defending materials, as well as features such as ear plugs for noise reduction, fall protection systems, and safety helmets. OSHA standards and incident investigation requirements also contribute to the demand for safety apparel. Ethical sourcing practices are increasingly important to customers, leading companies to invest in raw materials that offer desirable features, such as higher heat resistance and wear and tear resistance.
  • The competitive landscape is intensifying as a result, with companies vying to offer the most advanced safety apparel solutions. Overall, the market is expected to continue growing as businesses prioritize the safety and wellbeing of their employees.

What are the market trends shaping the Safety Apparel Industry?

  • Smart and wearable technology is gaining significant traction in the market, with implementation becoming increasingly prevalent. This trend reflects the growing demand for advanced, convenient technology solutions.
  • In the realm of risk management, the market is witnessing significant advancements with the integration of wearable technology in Personal Protective Equipment (PPE). This technology is gaining traction in various industries such as oil and gas, automotive, fire safety, mining, and manufacturing. By utilizing a subset of the Internet of Things, wearable technology enhances worker productivity and ensures safety through continuous PPE use monitoring. Currently, PPE compliance is manually tracked. However, with the advent of wearable technology, beacons and devices are being employed to monitor PPE usage. Each beacon is uniquely identified and affixed to the wearable device. The beacon's signals are received and recorded by the device, providing real-time data on PPE usage.
  • Key safety apparel components, including hearing protection, eye protection, safety vests, hard hats, and safety glasses, are being enhanced with this technology. Price competition remains a crucial factor in the market, with product certification playing a significant role in brand recognition. Wearable technology in safety apparel not only ensures worker safety but also offers potential cost savings through improved efficiency and productivity.

What challenges does the Safety Apparel Industry face during its growth?

  • The escalating costs of raw materials poses a significant challenge to the industry, as it negatively impacts supply chain efficiency and hinders overall growth. 
  • Occupational safety and workplace safety continue to be a top priority for businesses. Safety apparel plays a crucial role in ensuring employee protection against hazards. However, fluctuations in the prices of raw materials, such as fabric and chemicals, can significantly impact the entire supply chain. Manufacturers, who do not have long-term contracts with their suppliers, may experience increased costs. As a result, customers might consider alternative options, including normal or sub-standard apparel, to reduce expenses. Moreover, safety apparel purchases are often custom and rush orders, making it easier for customers to turn to other manufacturers offering lower prices.
  • Consequently, manufacturers face the challenge of maintaining their profit margins without passing on the increased costs to their customers. This dynamic underscores the importance of continuous cost management and price competitiveness in the market. Additionally, safety apparel regulations, such as CE marking and compliance with safety standards, further add to the complexity and costs for manufacturers. Reflective materials, high-visibility clothing, safety footwear, head protection, safety nets, and flame-resistant fabrics are essential components of safety apparel. Ensuring the availability and affordability of these products remains a critical concern for businesses committed to providing a safe working environment for their employees.

Exclusive Customer Landscape

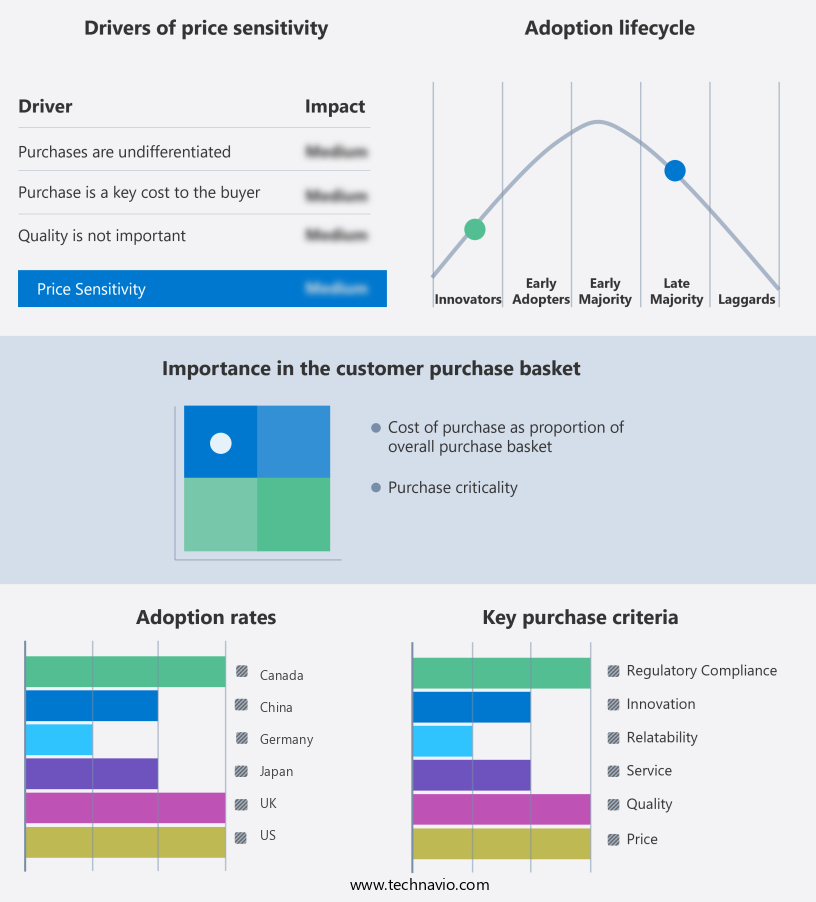
The safety apparel market forecasting report includes the adoption lifecycle of the market, covering from the innovator's stage to the laggard's stage. It focuses on adoption rates in different regions based on penetration. Furthermore, the safety apparel market report also includes key purchase criteria and drivers of price sensitivity to help companies evaluate and develop their market growth analysis strategies.

Safety Apparel Market Share by Geography

 Customer Landscape

Key Companies & Market Insights

Companies are implementing various strategies, such as strategic alliances, safety apparel market forecast, partnerships, mergers and acquisitions, geographical expansion, and product/service launches, to enhance their presence in the industry.

3M Co. - The company specializes in providing a range of safety apparel solutions. Among our offerings are the disposable protective coverall 4540, protective coverall 4520, and protective coverall 4565. These products are designed to ensure the utmost safety and protection for individuals in various industries.

The industry research and growth report includes detailed analyses of the competitive landscape of the market and information about key companies, including:

  • 3M Co.
  • Anbu Safety Industrial Co. Ltd.
  • Ansell Ltd.
  • ASATEX AG
  • Ballyclare Ltd.
  • Delta Plus Group
  • DuPont de Nemours Inc.
  • Honeywell International Inc.
  • Kermel
  • Kimberly Clark Corp.
  • Lakeland Industries Inc.
  • NASCO Industries Inc.
  • OccuNomix International LLC
  • Sioen Industries NV
  • Teijin Ltd.
  • UniFirst Corp.
  • VF Corp.
  • W. L. Gore and Associates Inc.

Qualitative and quantitative analysis of companies has been conducted to help clients understand the wider business environment as well as the strengths and weaknesses of key industry players. Data is qualitatively analyzed to categorize companies as pure play, category-focused, industry-focused, and diversified; it is quantitatively analyzed to categorize companies as dominant, leading, strong, tentative, and weak.

Recent Development and News in Safety Apparel Market

  • In March 2024, DuPont announced the launch of its innovative Tyvek 800J protective apparel, offering enhanced breathability and durability for workers in hazardous environments (DuPont Press Release, 2024).
  • In August 2024, 3M and Honeywell International signed a strategic collaboration agreement to expand their joint offering of personal protective equipment, aiming to enhance their combined market presence and product portfolio (3M Press Release, 2024).
  • In February 2025, MSA Safety, a leading safety equipment provider, completed the acquisition of Scott Safety, significantly expanding its product portfolio and strengthening its position in The market (MSA Safety Press Release, 2025).
  • In May 2025, the European Union introduced new regulations on personal protective equipment, requiring enhanced certification standards and increased transparency for consumers, driving growth opportunities for safety apparel manufacturers (European Commission Press Release, 2025).

Research Analyst Overview

  • The market encompasses a range of products designed to protect workers from various workplace hazards. Cut-resistant fabrics and abrasion-resistant materials are essential for industries with high risks of injury from sharp objects or friction. UV protection and moisture-wicking fabrics ensure worker comfort and safety under extreme weather conditions. Safety inspections, audits, and training programs are crucial for maintaining a safe work environment. Industrial hygiene, dust management, and biohazard protection address health concerns, while height safety, emergency response, and machine guarding focus on preventing falls and accidents. Risk assessment software and safety committees facilitate proactive risk identification and mitigation. Temperature regulation, noise control, fire safety, and chemical-resistant coatings are essential for maintaining a safe and productive work environment in various industries.
  • Safety incentives and emergency lighting promote a culture of safety and preparedness. Ventilation systems and confined space entry procedures ensure proper air quality and safe entry into potentially hazardous areas. Safety management systems integrate all these elements to create a comprehensive approach to workplace safety.

Dive into Technavio's robust research methodology, blending expert interviews, extensive data synthesis, and validated models for unparalleled Safety Apparel Market insights. See full methodology.

Market Scope

Report Coverage

Details

Page number

163

Base year

2023

Historic period

2018-2022

Forecast period

2024-2028

Growth momentum & CAGR

Accelerate at a CAGR of 16.79%

Market growth 2024-2028

USD 16261.3 million

Market structure

Fragmented

YoY growth 2023-2024(%)

13.26

Key countries

US, China, Japan, Germany, Canada, and UK

Competitive landscape

Leading Companies, Market Positioning of Companies, Competitive Strategies, and Industry Risks

Request Free Sample

What are the Key Data Covered in this Safety Apparel Market Research and Growth Report?

  • CAGR of the Safety Apparel industry during the forecast period
  • Detailed information on factors that will drive the growth and forecasting between 2024 and 2028
  • Precise estimation of the size of the market and its contribution of the industry in focus to the parent market
  • Accurate predictions about upcoming growth and trends and changes in consumer behaviour
  • Growth of the market across APAC, North America, Europe, South America, and Middle East and Africa
  • Thorough analysis of the market's competitive landscape and detailed information about companies
  • Comprehensive analysis of factors that will challenge the safety apparel market growth of industry companies

We can help! Our analysts can customize this safety apparel market research report to meet your requirements.

Get in touch

1 Executive Summary

  • 1.1 Market overview
    • Executive Summary - Chart on Market Overview
    • Executive Summary - Data Table on Market Overview
    • Executive Summary - Chart on Global Market Characteristics
    • Executive Summary - Chart on Market by Geography
    • Executive Summary - Chart on Market Segmentation by Application
    • Executive Summary - Chart on Incremental Growth
    • Executive Summary - Data Table on Incremental Growth
    • Executive Summary - Chart on Company Market Positioning

2 Market Landscape

  • 2.1 Market ecosystem
    • Parent Market
    • Data Table on - Parent Market
  • 2.2 Market characteristics
    • Market characteristics analysis
  • 2.3 Value chain analysis
    • Value Chain Analysis

3 Market Sizing

  • 3.1 Market definition
    • Offerings of companies included in the market definition
  • 3.2 Market segment analysis
    • Market segments
  • 3.3 Market size 2023
    • 3.4 Market outlook: Forecast for 2023-2028
      • Chart on Global - Market size and forecast 2023-2028 ($ million)
      • Data Table on Global - Market size and forecast 2023-2028 ($ million)
      • Chart on Global Market: Year-over-year growth 2023-2028 (%)
      • Data Table on Global Market: Year-over-year growth 2023-2028 (%)

    4 Historic Market Size

    • 4.1 Global Safety Apparel Market 2018 - 2022
      • Historic Market Size - Data Table on Global Safety Apparel Market 2018 - 2022 ($ million)
    • 4.2 Application segment analysis 2018 - 2022
      • Historic Market Size - Application Segment 2018 - 2022 ($ million)
    • 4.3 Geography segment analysis 2018 - 2022
      • Historic Market Size - Geography Segment 2018 - 2022 ($ million)
    • 4.4 Country segment analysis 2018 - 2022
      • Historic Market Size - Country Segment 2018 - 2022 ($ million)

    5 Five Forces Analysis

    • 5.1 Five forces summary
      • Five forces analysis - Comparison between 2023 and 2028
    • 5.2 Bargaining power of buyers
      • Bargaining power of buyers - Impact of key factors 2023 and 2028
    • 5.3 Bargaining power of suppliers
      • Bargaining power of suppliers - Impact of key factors in 2023 and 2028
    • 5.4 Threat of new entrants
      • Threat of new entrants - Impact of key factors in 2023 and 2028
    • 5.5 Threat of substitutes
      • Threat of substitutes - Impact of key factors in 2023 and 2028
    • 5.6 Threat of rivalry
      • Threat of rivalry - Impact of key factors in 2023 and 2028
    • 5.7 Market condition
      • Chart on Market condition - Five forces 2023 and 2028

    6 Market Segmentation by Application

    • 6.1 Market segments
      • Chart on Application - Market share 2023-2028 (%)
      • Data Table on Application - Market share 2023-2028 (%)
    • 6.2 Comparison by Application
      • Chart on Comparison by Application
      • Data Table on Comparison by Application
    • 6.3 Chemical defending - Market size and forecast 2023-2028
      • Chart on Chemical defending - Market size and forecast 2023-2028 ($ million)
      • Data Table on Chemical defending - Market size and forecast 2023-2028 ($ million)
      • Chart on Chemical defending - Year-over-year growth 2023-2028 (%)
      • Data Table on Chemical defending - Year-over-year growth 2023-2028 (%)
    • 6.4 Flame retardant - Market size and forecast 2023-2028
      • Chart on Flame retardant - Market size and forecast 2023-2028 ($ million)
      • Data Table on Flame retardant - Market size and forecast 2023-2028 ($ million)
      • Chart on Flame retardant - Year-over-year growth 2023-2028 (%)
      • Data Table on Flame retardant - Year-over-year growth 2023-2028 (%)
    • 6.5 Mechanical - Market size and forecast 2023-2028
      • Chart on Mechanical - Market size and forecast 2023-2028 ($ million)
      • Data Table on Mechanical - Market size and forecast 2023-2028 ($ million)
      • Chart on Mechanical - Year-over-year growth 2023-2028 (%)
      • Data Table on Mechanical - Year-over-year growth 2023-2028 (%)
    • 6.6 High visibility - Market size and forecast 2023-2028
      • Chart on High visibility - Market size and forecast 2023-2028 ($ million)
      • Data Table on High visibility - Market size and forecast 2023-2028 ($ million)
      • Chart on High visibility - Year-over-year growth 2023-2028 (%)
      • Data Table on High visibility - Year-over-year growth 2023-2028 (%)
    • 6.7 Others - Market size and forecast 2023-2028
      • Chart on Others - Market size and forecast 2023-2028 ($ million)
      • Data Table on Others - Market size and forecast 2023-2028 ($ million)
      • Chart on Others - Year-over-year growth 2023-2028 (%)
      • Data Table on Others - Year-over-year growth 2023-2028 (%)
    • 6.8 Market opportunity by Application
      • Market opportunity by Application ($ million)
      • Data Table on Market opportunity by Application ($ million)

    7 Customer Landscape

    • 7.1 Customer landscape overview
      • Analysis of price sensitivity, lifecycle, customer purchase basket, adoption rates, and purchase criteria

    8 Geographic Landscape

    • 8.1 Geographic segmentation
      • Chart on Market share by geography 2023-2028 (%)
      • Data Table on Market share by geography 2023-2028 (%)
    • 8.2 Geographic comparison
      • Chart on Geographic comparison
      • Data Table on Geographic comparison
    • 8.3 APAC - Market size and forecast 2023-2028
      • Chart on APAC - Market size and forecast 2023-2028 ($ million)
      • Data Table on APAC - Market size and forecast 2023-2028 ($ million)
      • Chart on APAC - Year-over-year growth 2023-2028 (%)
      • Data Table on APAC - Year-over-year growth 2023-2028 (%)
    • 8.4 North America - Market size and forecast 2023-2028
      • Chart on North America - Market size and forecast 2023-2028 ($ million)
      • Data Table on North America - Market size and forecast 2023-2028 ($ million)
      • Chart on North America - Year-over-year growth 2023-2028 (%)
      • Data Table on North America - Year-over-year growth 2023-2028 (%)
    • 8.5 Europe - Market size and forecast 2023-2028
      • Chart on Europe - Market size and forecast 2023-2028 ($ million)
      • Data Table on Europe - Market size and forecast 2023-2028 ($ million)
      • Chart on Europe - Year-over-year growth 2023-2028 (%)
      • Data Table on Europe - Year-over-year growth 2023-2028 (%)
    • 8.6 South America - Market size and forecast 2023-2028
      • Chart on South America - Market size and forecast 2023-2028 ($ million)
      • Data Table on South America - Market size and forecast 2023-2028 ($ million)
      • Chart on South America - Year-over-year growth 2023-2028 (%)
      • Data Table on South America - Year-over-year growth 2023-2028 (%)
    • 8.7 Middle East and Africa - Market size and forecast 2023-2028
      • Chart on Middle East and Africa - Market size and forecast 2023-2028 ($ million)
      • Data Table on Middle East and Africa - Market size and forecast 2023-2028 ($ million)
      • Chart on Middle East and Africa - Year-over-year growth 2023-2028 (%)
      • Data Table on Middle East and Africa - Year-over-year growth 2023-2028 (%)
    • 8.8 US - Market size and forecast 2023-2028
      • Chart on US - Market size and forecast 2023-2028 ($ million)
      • Data Table on US - Market size and forecast 2023-2028 ($ million)
      • Chart on US - Year-over-year growth 2023-2028 (%)
      • Data Table on US - Year-over-year growth 2023-2028 (%)
    • 8.9 China - Market size and forecast 2023-2028
      • Chart on China - Market size and forecast 2023-2028 ($ million)
      • Data Table on China - Market size and forecast 2023-2028 ($ million)
      • Chart on China - Year-over-year growth 2023-2028 (%)
      • Data Table on China - Year-over-year growth 2023-2028 (%)
    • 8.10 Japan - Market size and forecast 2023-2028
      • Chart on Japan - Market size and forecast 2023-2028 ($ million)
      • Data Table on Japan - Market size and forecast 2023-2028 ($ million)
      • Chart on Japan - Year-over-year growth 2023-2028 (%)
      • Data Table on Japan - Year-over-year growth 2023-2028 (%)
    • 8.11 Germany - Market size and forecast 2023-2028
      • Chart on Germany - Market size and forecast 2023-2028 ($ million)
      • Data Table on Germany - Market size and forecast 2023-2028 ($ million)
      • Chart on Germany - Year-over-year growth 2023-2028 (%)
      • Data Table on Germany - Year-over-year growth 2023-2028 (%)
    • 8.12 Canada - Market size and forecast 2023-2028
      • Chart on Canada - Market size and forecast 2023-2028 ($ million)
      • Data Table on Canada - Market size and forecast 2023-2028 ($ million)
      • Chart on Canada - Year-over-year growth 2023-2028 (%)
      • Data Table on Canada - Year-over-year growth 2023-2028 (%)
    • 8.13 UK - Market size and forecast 2023-2028
      • Chart on UK - Market size and forecast 2023-2028 ($ million)
      • Data Table on UK - Market size and forecast 2023-2028 ($ million)
      • Chart on UK - Year-over-year growth 2023-2028 (%)
      • Data Table on UK - Year-over-year growth 2023-2028 (%)
    • 8.14 Market opportunity by geography
      • Market opportunity by geography ($ million)
      • Data Tables on Market opportunity by geography ($ million)

    9 Drivers, Challenges, and Opportunity/Restraints

    • 9.1 Market drivers
      • 9.2 Market challenges
        • 9.3 Impact of drivers and challenges
          • Impact of drivers and challenges in 2023 and 2028
        • 9.4 Market opportunities/restraints

          10 Competitive Landscape

          • 10.1 Overview
            • 10.2 Competitive Landscape
              • Overview on criticality of inputs and factors of differentiation
            • 10.3 Landscape disruption
              • Overview on factors of disruption
            • 10.4 Industry risks
              • Impact of key risks on business

            11 Competitive Analysis

            • 11.1 Companies profiled
              • Companies covered
            • 11.2 Market positioning of companies
              • Matrix on companies position and classification
            • 3M Co.
              • 3M Co. - Overview
              • 3M Co. - Business segments
              • 3M Co. - Key news
              • 3M Co. - Key offerings
              • 3M Co. - Segment focus
            • 11.4 Ansell Ltd.
              • Ansell Ltd. - Overview
              • Ansell Ltd. - Business segments
              • Ansell Ltd. - Key news
              • Ansell Ltd. - Key offerings
              • Ansell Ltd. - Segment focus
            • 11.5 Ballyclare Ltd.
              • Ballyclare Ltd. - Overview
              • Ballyclare Ltd. - Product / Service
              • Ballyclare Ltd. - Key offerings
            • 11.6 Delta Plus Group
              • Delta Plus Group - Overview
              • Delta Plus Group - Business segments
              • Delta Plus Group - Key offerings
              • Delta Plus Group - Segment focus
            • 11.7 DuPont de Nemours Inc.
              • DuPont de Nemours Inc. - Overview
              • DuPont de Nemours Inc. - Business segments
              • DuPont de Nemours Inc. - Key news
              • DuPont de Nemours Inc. - Key offerings
              • DuPont de Nemours Inc. - Segment focus
            • 11.8 Honeywell International Inc.
              • Honeywell International Inc. - Overview
              • Honeywell International Inc. - Business segments
              • Honeywell International Inc. - Key news
              • Honeywell International Inc. - Key offerings
              • Honeywell International Inc. - Segment focus
            • 11.9 Kimberly Clark Corp.
              • Kimberly Clark Corp. - Overview
              • Kimberly Clark Corp. - Business segments
              • Kimberly Clark Corp. - Key offerings
              • Kimberly Clark Corp. - Segment focus
            • 11.10 Lakeland Industries Inc.
              • Lakeland Industries Inc. - Overview
              • Lakeland Industries Inc. - Business segments
              • Lakeland Industries Inc. - Key news
              • Lakeland Industries Inc. - Key offerings
              • Lakeland Industries Inc. - Segment focus
            • 11.11 Sioen Industries NV
              • Sioen Industries NV - Overview
              • Sioen Industries NV - Product / Service
              • Sioen Industries NV - Key offerings
            • 11.12 Teijin Ltd.
              • Teijin Ltd. - Overview
              • Teijin Ltd. - Business segments
              • Teijin Ltd. - Key news
              • Teijin Ltd. - Key offerings
              • Teijin Ltd. - Segment focus

            12 Appendix

            • 12.1 Scope of the report
              • 12.2 Inclusions and exclusions checklist
                • Inclusions checklist
                • Exclusions checklist
              • 12.3 Currency conversion rates for US$
                • Currency conversion rates for US$
              • 12.4 Research methodology
                • Research methodology
              • 12.5 Data procurement
                • Information sources
              • 12.6 Data validation
                • Data validation
              • 12.7 Validation techniques employed for market sizing
                • Validation techniques employed for market sizing
              • 12.8 Data synthesis
                • Data synthesis
              • 12.9 360 degree market analysis
                • 360 degree market analysis
              • 12.10 List of abbreviations
                • List of abbreviations

              Research Methodology

              Technavio presents a detailed picture of the market by way of study, synthesis, and summation of data from multiple sources. The analysts have presented the various facets of the market with a particular focus on identifying the key industry influencers. The data thus presented is comprehensive, reliable, and the result of extensive research, both primary and secondary.

              INFORMATION SOURCES

              Primary sources

              • Manufacturers and suppliers
              • Channel partners
              • Industry experts
              • Strategic decision makers

              Secondary sources

              • Industry journals and periodicals
              • Government data
              • Financial reports of key industry players
              • Historical data
              • Press releases

              DATA ANALYSIS

              Data Synthesis

              • Collation of data
              • Estimation of key figures
              • Analysis of derived insights

              Data Validation

              • Triangulation with data models
              • Reference against proprietary databases
              • Corroboration with industry experts

              REPORT WRITING

              Qualitative

              • Market drivers
              • Market challenges
              • Market trends
              • Five forces analysis

              Quantitative

              • Market size and forecast
              • Market segmentation
              • Geographical insights
              • Competitive landscape

              Interested in this report?

              Get your sample now to see our research methodology and insights!

              Download Now

              Frequently Asked Questions

              Safety Apparel market growth will increase by $ 16261.3 mn during 2024-2028 .

              The Safety Apparel market is expected to grow at a CAGR of 16.79% during 2024-2028 .

              Safety Apparel market is segmented by Application( Chemical defending, Flame retardant, Mechanical, High visibility, Others) Geographic( APAC, North America, Europe, MEA, South America)

              3M Co., Anbu Safety Industrial Co. Ltd., Ansell Ltd., ASATEX AG, Ballyclare Ltd., Delta Plus Group, DuPont de Nemours Inc., Honeywell International Inc., Kermel, Kimberly Clark Corp., Lakeland Industries Inc., NASCO Industries Inc., OccuNomix International LLC, Sioen Industries NV, Teijin Ltd., UniFirst Corp., VF Corp., W. L. Gore and Associates Inc. are a few of the key vendors in the Safety Apparel market.

              APAC will register the highest growth rate of 38% among the other regions. Therefore, the Safety Apparel market in APAC is expected to garner significant business opportunities for the vendors during the forecast period.

              US, China, Japan, Germany, Canada, UK

              • High emphasis on customization and quality of safety apparelManufacturers are investing in R and D extensively to increase the adoption rate and effectiveness of safety apparel. Technological upgrades is the driving factor this market.
              • along with the changing consumer need for safety apparel is the driving factor this market.
              • ensure safety along with fashion. Chemical-defending clothing needs to be highly durable is the driving factor this market.
              • lightweight is the driving factor this market.
              • breathable is the driving factor this market.
              • and comfortable for factory shopfloor workers. Such specific requirements would further drive the demand for multi-functional is the driving factor this market.
              • industry-specific safety apparel. Thus is the driving factor this market.
              • improvements in product designs and specifications are expected to result in stiff competition in the industry. The increased focus on innovation in product design and functionality will is the driving factor this market.
              • in turn is the driving factor this market.
              • increase the demand for raw materials that offer features is the driving factor this market.
              • such as lightweight is the driving factor this market.
              • comfort is the driving factor this market.
              • higher heat resistance is the driving factor this market.
              • and wear and tear resistance is the driving factor this market.
              • thus urging market vendors to invest in R and D extensively. Cumulatively is the driving factor this market.
              • all these activities will benefit the entire supply chain is the driving factor this market.
              • thereby driving the demand. The above innovations will also increase product differentiation and enable manufacturers to price their products higher is the driving factor this market.
              • thus improving their margins. The situation is likely to persist during the forecast period as technological innovations will benefit safety apparel vendors to improve their product offerings and strengthen their margins. Therefore is the driving factor this market.
              • the global safety apparel market is expected to witness growth during the forecast period. is the driving factor this market.

              The Safety Apparel market vendors should focus on grabbing business opportunities from the Chemical defending segment as it accounted for the largest market share in the base year.