Reflective Materials Market Analysis, Size, and Forecast 2026-2030: APAC (China, Japan, and India), North America (US, Canada, and Mexico), Europe (Germany, UK, and France), Middle East and Africa (Saudi Arabia, UAE, and South Africa), South America (Brazil and Argentina), and Rest of World (ROW)

Reflective Materials Market Analysis, Size, and Forecast 2026-2030:
APAC (China, Japan, and India), North America (US, Canada, and Mexico), Europe (Germany, UK, and France), Middle East and Africa (Saudi Arabia, UAE, and South Africa), South America (Brazil and Argentina), and Rest of World (ROW)

Published: Dec 2025 307 Pages SKU: IRTNTR73107

Market Overview at a Glance

$9.38 B
Market Opportunity
5.8%
CAGR 2025 - 2030
47.8%
APAC Growth
$7.84 B
Coatings segment 2024

Reflective Materials Market Size 2026-2030

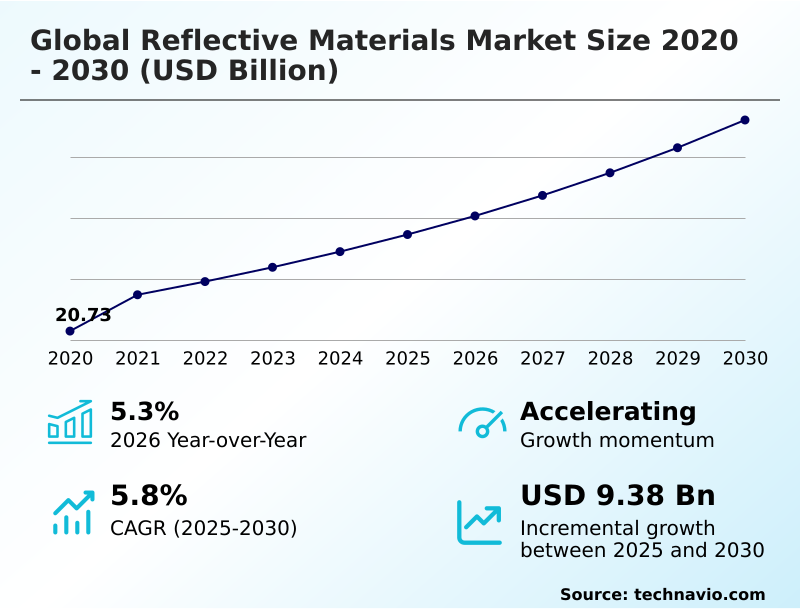
The reflective materials market size is valued to increase by USD 9.38 billion, at a CAGR of 5.8% from 2025 to 2030. Heightened focus on safety applications propels market growth will drive the reflective materials market.

Major Market Trends & Insights

  • APAC dominated the market and accounted for a 47.8% growth during the forecast period.
  • By Product - Coatings segment was valued at USD 7.84 billion in 2024
  • By End-user - Construction segment accounted for the largest market revenue share in 2024

Market Size & Forecast

  • Market Opportunities: USD 17.27 billion
  • Market Future Opportunities: USD 9.38 billion
  • CAGR from 2025 to 2030 : 5.8%

Market Summary

  • The reflective materials market is defined by a continuous drive for enhanced safety and visibility, propelled by stringent regulatory frameworks and technological evolution. Key applications such as high-visibility clothing, traffic sign sheeting, and vehicle conspicuity tape are fundamental to accident prevention in low-light conditions.
  • A significant industry shift involves the transition from traditional glass bead technology to superior microprismatic technology, which offers greater nighttime visibility and durability. This innovation helps end-users meet demanding performance standards like EN ISO 20471 and ASTM D4956.
  • However, manufacturers face persistent challenges from raw material pricing volatility and growing pressure to develop eco-friendly reflective materials in response to plastic pollution regulations. For instance, a major infrastructure development firm must balance the higher initial cost of durable, compliant retroreflective materials against the long-term benefits of reduced liability and maintenance, all while navigating an unpredictable supply chain.
  • This dynamic necessitates a strategic approach to sourcing and product selection to ensure both safety compliance and financial viability.

What will be the Size of the Reflective Materials Market during the forecast period?

Get Key Insights on Market Forecast (PDF) Request Free Sample

How is the Reflective Materials Market Segmented?

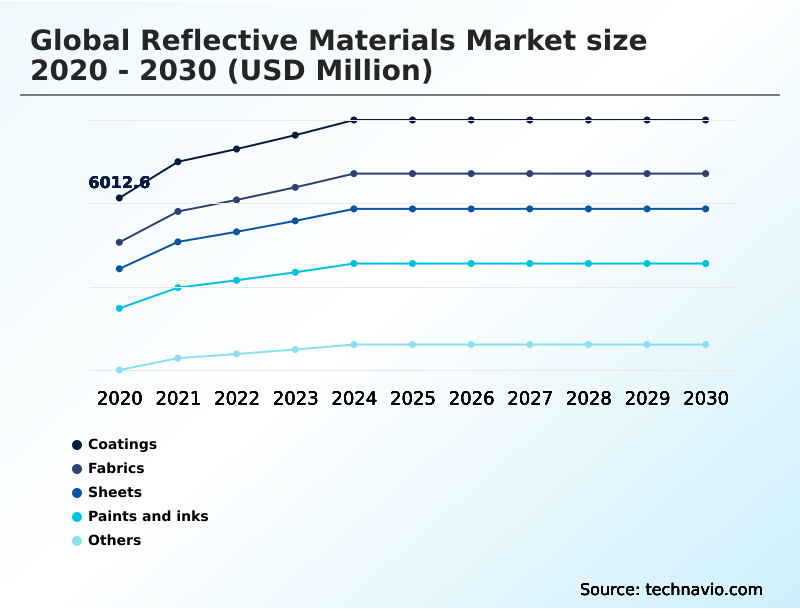
The reflective materials industry research report provides comprehensive data (region-wise segment analysis), with forecasts and estimates in "USD million" for the period 2026-2030, as well as historical data from 2020-2024 for the following segments.

  • Product
    • Coatings
    • Fabrics
    • Sheets
    • Paints and inks
    • Others
  • End-user
    • Construction
    • Automobiles
    • Textiles
    • Electronics
  • Distribution channel
    • Direct sales
    • Retail
    • Online platforms
  • Geography
    • APAC
      • China
      • Japan
      • India
    • North America
      • US
      • Canada
      • Mexico
    • Europe
      • Germany
      • UK
      • France
    • Middle East and Africa
      • Saudi Arabia
      • UAE
      • South Africa
    • South America
      • Brazil
      • Argentina
    • Rest of World (ROW)

By Product Insights

The coatings segment is estimated to witness significant growth during the forecast period.

The coatings segment is a critical component of the reflective materials market, driven by its role in energy efficiency and sustainable infrastructure.

Innovations are centered on high-performance solar-reflective coatings and cool roof coatings, which are instrumental in mitigating the urban heat island effect and advancing sustainable building practices.

These materials utilize passive reflectivity to reduce thermal absorption, with some next-generation cool roof coating formulations demonstrating energy reduction improvements of up to 200% compared to traditional options.

The development of weather-resistant coatings and nanotechnology-based coatings is enhancing durability and performance. As regulations push for more energy-efficient buildings, the demand for these advanced retroreflective materials, including waterborne reflective paint, is expanding across both new construction and retrofitting projects.

Request Free Sample

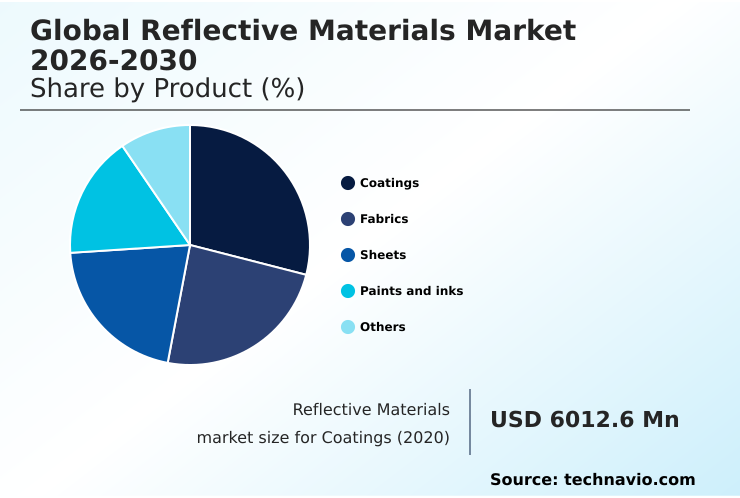
The Coatings segment was valued at USD 7.84 billion in 2024 and showed a gradual increase during the forecast period.

Request Free Sample

Regional Analysis

APAC is estimated to contribute 47.8% to the growth of the global market during the forecast period.Technavio’s analysts have elaborately explained the regional trends and drivers that shape the market during the forecast period.

See How Reflective Materials Market Demand is Rising in APAC Request Free Sample

The geographic landscape is dominated by the APAC region, which is projected to contribute nearly 48% of the market's incremental growth. This expansion is fueled by massive infrastructure development and rising occupational safety standards in countries like China and India.

The region's focus on accident prevention and worker visibility drives significant demand for materials compliant with international standards, such as EN ISO 20471 for high-visibility clothing.

For instance, Malaysia's construction sector is expected to grow by more than 6% annually, creating sustained demand for safety products.

This rapid urbanization also accelerates the adoption of smart reflective materials for intelligent transportation systems (ITS), positioning APAC as a central hub for both consumption and innovation in retroreflective materials, including advanced traffic sign sheeting and durable reflective films.

Market Dynamics

Our researchers analyzed the data with 2025 as the base year, along with the key drivers, trends, and challenges. A holistic analysis of drivers will help companies refine their marketing strategies to gain a competitive advantage.

  • A strategic analysis of the global reflective materials market 2026-2030 reveals a complex interplay between technological evolution, application-specific demands, and regulatory pressures. The ongoing debate of comparing glass bead and microprismatic technology underscores a broader shift towards higher-performance solutions, particularly in microprismatic sheeting for traffic control and high-visibility fabric for safety apparel.
  • These advancements are crucial for improving nighttime road safety with reflective markings and supporting the role of reflective materials in ADAS performance. Concurrently, manufacturers face significant hurdles, including the impact of raw material costs on reflective tape and the persistent challenges of LED substitutes for reflective signs.
  • In response, the industry is innovating with advancements in solar-reflective cool roof coatings and promoting the benefits of reflective materials in construction to mitigate the urban heat island effect. A key focus is the development of sustainable alternatives to PVC-based reflective films to meet stringent EPR compliance for reflective material manufacturers.
  • This transition is also opening new applications, from thermal management using reflective films in EVs to the integration of reflective yarn in sportswear. Businesses that master the durability standards for thermoplastic road paint and develop eco-friendly waterborne reflective paints see a significant competitive advantage.
  • For example, firms that prioritize high-durability materials report up to a 50% longer asset lifespan, showcasing a clear link between material quality and operational cost efficiency.

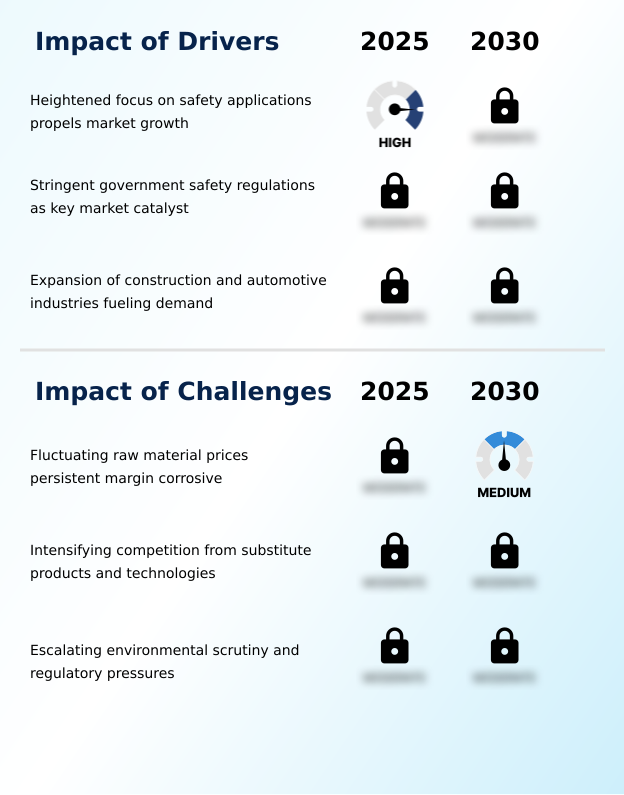
What are the key market drivers leading to the rise in the adoption of Reflective Materials Industry?

  • A heightened focus on safety applications across diverse sectors, including construction, automotive, and personal protection, is a primary driver propelling market growth.

  • Market growth is primarily propelled by increasingly stringent road safety regulations and occupational safety standards worldwide, which mandate the use of high-performance materials for accident prevention.
  • For example, strict enforcement of personal protective equipment (PPE) compliance, including high-visibility clothing that meets the EN ISO 20471 standard, has contributed to a 30% reduction in nighttime industrial accidents in certain regions.
  • This focus on worker visibility is a powerful driver. Furthermore, the expansion of the automotive sector is fueling demand for materials that support advanced driver-assistance systems (ADAS), alongside traditional applications like vehicle conspicuity tape.
  • The continuous growth in global construction and infrastructure projects ensures sustained demand for durable traffic sign sheeting and retroreflective materials that enhance nighttime visibility.

What are the market trends shaping the Reflective Materials Industry?

  • The market is experiencing heightened demand, largely propelled by the implementation and enforcement of stricter global safety regulations and standards across multiple industries.

  • Key trends are reshaping the market, driven by sustainability mandates and technological integration. The development of smart reflective materials is a significant trend, where integration with intelligent transportation systems (ITS) has been shown to improve urban traffic flow by over 15%. This creates new possibilities for dynamic signage and infrastructure management.
  • Simultaneously, a strong push towards eco-friendly reflective materials is evident, driven by plastic pollution regulations. Innovations in waterborne reflective paint now offer formulations that reduce volatile organic compound (VOC) emissions by up to 80% compared to traditional solvent-based types.
  • This shift supports sustainable building practices and is complemented by advancements in nanotechnology-based coatings, which enhance both performance and environmental credentials across applications, from cool roof coatings to athleisure apparel.

What challenges does the Reflective Materials Industry face during its growth?

  • The persistent fluctuation in the prices of essential raw materials presents a significant challenge, leading to margin erosion and operational uncertainty for market participants.

  • The market faces significant headwinds from operational and competitive pressures. Persistent raw material pricing instability and supply chain volatility can increase production costs for items like reflective tape by 10-15% in a single fiscal quarter, directly impacting profitability.
  • Another challenge is the intensifying competition from light-emitting diode (LED) solutions, which offer active illumination as a substitute for traditional passive reflectivity materials, particularly in signage. This technological rivalry reshapes end-user expectations. Furthermore, navigating complex environmental regulations, such as extended producer responsibility (EPR) frameworks, requires substantial investment in developing sustainable alternatives to PVC-based reflective films.
  • Achieving regulatory compliance while maintaining cost-competitiveness and performance standards remains a primary operational challenge for manufacturers.

Exclusive Technavio Analysis on Customer Landscape

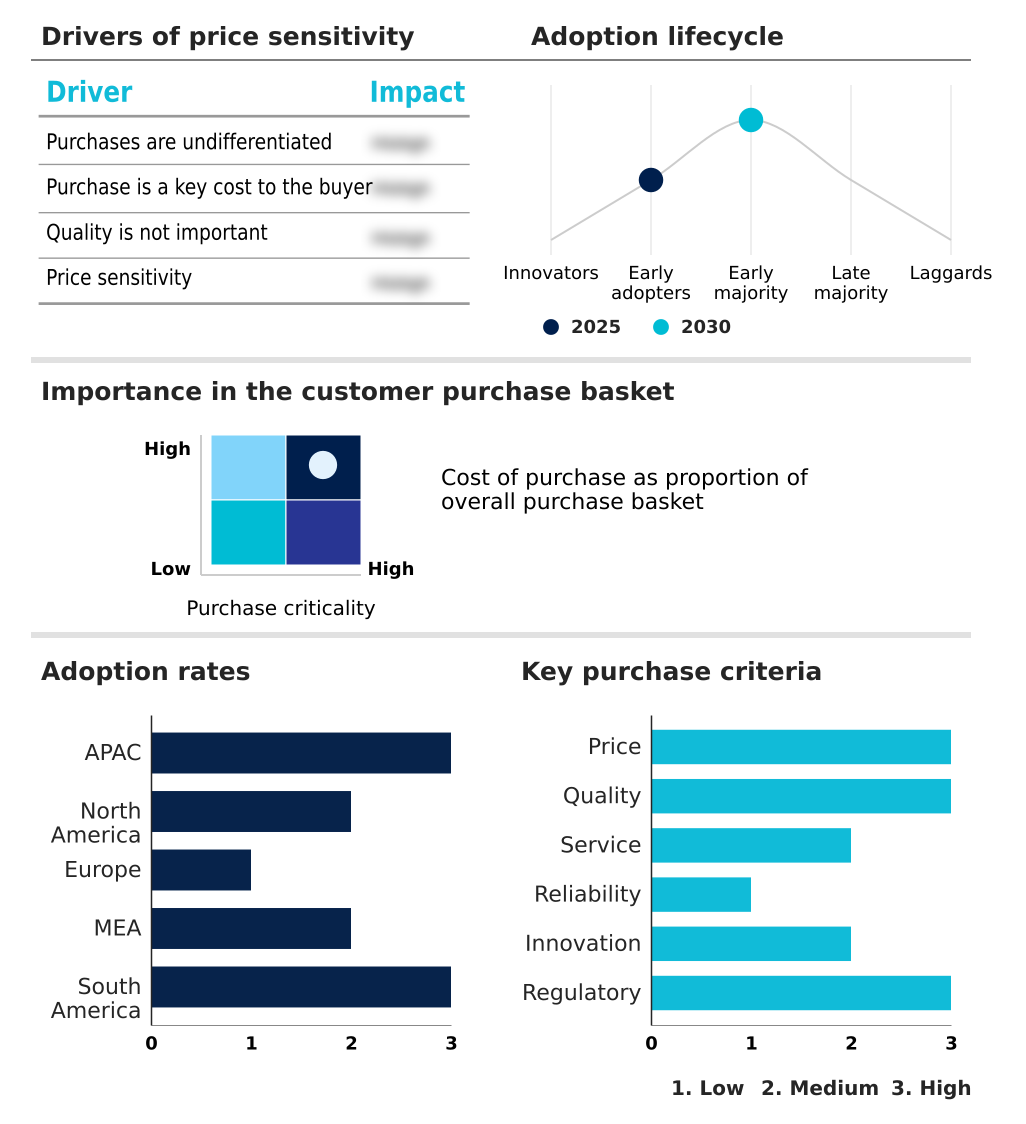
The reflective materials market forecasting report includes the adoption lifecycle of the market, covering from the innovator’s stage to the laggard’s stage. It focuses on adoption rates in different regions based on penetration. Furthermore, the reflective materials market report also includes key purchase criteria and drivers of price sensitivity to help companies evaluate and develop their market growth analysis strategies.

Customer Landscape of Reflective Materials Industry

Competitive Landscape

Companies are implementing various strategies, such as strategic alliances, reflective materials market forecast, partnerships, mergers and acquisitions, geographical expansion, and product/service launches, to enhance their presence in the industry.

3M Co. - Key offerings are centered on specialized retroreflective materials, featuring advanced films and fabrics engineered to enhance visibility and safety across diverse industrial, automotive, and consumer applications.

The industry research and growth report includes detailed analyses of the competitive landscape of the market and information about key companies, including:

  • 3M Co.
  • Avery Dennison Corp.
  • Avient Corp.
  • Coats Group PLC
  • Daoming Optics and Chemical Co. Ltd.
  • Jinsung Co. Ltd.
  • JRC REFLEX ITALIA S.r.l.
  • Nippon Carbide Industries Co. Ltd.
  • ORAFOL Europe GmbH
  • Paiho Shih Holdings Corp.
  • PPG Industries Inc.
  • Reflectionight Inc.
  • REFLOMAX Co. Ltd.
  • SKC
  • S.V.G.I. OPT S.r.l.
  • Unitika Ltd.
  • Viz Reflectives
  • Yeshili Reflective Material Co. Ltd.

Qualitative and quantitative analysis of companies has been conducted to help clients understand the wider business environment as well as the strengths and weaknesses of key industry players. Data is qualitatively analyzed to categorize companies as pure play, category-focused, industry-focused, and diversified; it is quantitatively analyzed to categorize companies as dominant, leading, strong, tentative, and weak.

Recent Development and News in Reflective materials market

  • In February, 2025, Avery Dennison is set to launch its Encore Series of automotive window films, which are designed to provide superior heat rejection and UV protection for vehicles.
  • In November, 2024, South Korea's transport ministry published a revision to its rules on vehicle performance and standards, which will be enforced from February 2025 and expands the mandatory installation of Event Data Recorders (EDRs).
  • In September, 2024, China's Ministry of Industry and Information Technology (MIIT) released three mandatory national standards for intelligent connected vehicles, focusing on information security, software upgrades, and data recording, which will become effective from January 1, 2026.
  • In September, 2024, the South Korean transport ministry announced a legislative notice for new regulations concerning the safety of electric vehicles, demonstrating a proactive stance on emerging automotive technologies.

Dive into Technavio’s robust research methodology, blending expert interviews, extensive data synthesis, and validated models for unparalleled Reflective Materials Market insights. See full methodology.

Market Scope
Page number 307
Base year 2025
Historic period 2020-2024
Forecast period 2026-2030
Growth momentum & CAGR Accelerate at a CAGR of 5.8%
Market growth 2026-2030 USD 9379.0 million
Market structure Fragmented
YoY growth 2025-2026(%) 5.3%
Key countries China, Japan, India, South Korea, Australia, Indonesia, US, Canada, Mexico, Germany, UK, France, Italy, Spain, The Netherlands, Saudi Arabia, UAE, South Africa, Israel, Turkey, Brazil, Argentina and Chile
Competitive landscape Leading Companies, Market Positioning of Companies, Competitive Strategies, and Industry Risks

Request Free Sample

Research Analyst Overview

  • The reflective materials market is fundamentally centered on enhancing safety through advanced retroreflective materials. The technological landscape has matured significantly, moving from traditional glass bead technology toward high-performance microprismatic technology and cutting-edge nanotechnology-based coatings. This evolution enables the production of durable reflective films and traffic sign sheeting that meet stringent regulatory benchmarks like ASTM D4956.
  • In the personal safety sector, materials such as breathable reflective textiles are vital for manufacturing high-visibility clothing compliant with EN ISO 20471. A key boardroom consideration involves balancing the upfront investment in premium, weather-resistant coatings against the long-term value of regulatory compliance and risk mitigation.
  • For instance, the adoption of smart reflective materials in urban infrastructure has demonstrated a 15% improvement in traffic flow management. The market also grapples with the distinction between passive reflectivity and active illumination offered by light-emitting diode (LED) solutions.
  • Demand is also growing for eco-friendly reflective materials, such as waterborne reflective paint and flexible reflective films, to meet sustainability goals, alongside specialized products like vehicle conspicuity tape and reflective polarizing films.

What are the Key Data Covered in this Reflective Materials Market Research and Growth Report?

  • What is the expected growth of the Reflective Materials Market between 2026 and 2030?

    • USD 9.38 billion, at a CAGR of 5.8%

  • What segmentation does the market report cover?

    • The report is segmented by Product (Coatings, Fabrics, Sheets, Paints and inks, and Others), End-user (Construction, Automobiles, Textiles, and Electronics), Distribution Channel (Direct sales, Retail, and Online platforms) and Geography (APAC, North America, Europe, Middle East and Africa, South America)

  • Which regions are analyzed in the report?

    • APAC, North America, Europe, Middle East and Africa and South America

  • What are the key growth drivers and market challenges?

    • Heightened focus on safety applications propels market growth, Fluctuating raw material prices persistent margin corrosive

  • Who are the major players in the Reflective Materials Market?

    • 3M Co., Avery Dennison Corp., Avient Corp., Coats Group PLC, Daoming Optics and Chemical Co. Ltd., Jinsung Co. Ltd., JRC REFLEX ITALIA S.r.l., Nippon Carbide Industries Co. Ltd., ORAFOL Europe GmbH, Paiho Shih Holdings Corp., PPG Industries Inc., Reflectionight Inc., REFLOMAX Co. Ltd., SKC, S.V.G.I. OPT S.r.l., Unitika Ltd., Viz Reflectives and Yeshili Reflective Material Co. Ltd.

Market Research Insights

  • The market dynamics are heavily influenced by stringent occupational safety standards and evolving road safety regulations, which mandate the use of high-performance materials to enhance visibility and prevent accidents. The adoption of advanced reflective films has been shown to improve advanced driver-assistance systems (ADAS) sensor detection by up to 25% in low-light conditions, a critical factor for automotive safety.
  • In industrial settings, adherence to personal protective equipment (PPE) mandates has reduced workplace incidents by over 30% in some sectors. Furthermore, the push for sustainable building practices is creating new applications in cool roof coatings and thermal management, contributing to the development of net-zero energy buildings.
  • These factors, combined with opportunities in intelligent transportation systems (ITS) and athleisure apparel, are shaping a market focused on performance, compliance, and innovation.

We can help! Our analysts can customize this reflective materials market research report to meet your requirements.

Get in touch

1. Executive Summary

1.1 Market overview

Executive Summary - Chart on Market Overview
Executive Summary - Data Table on Market Overview
Executive Summary - Chart on Global Market Characteristics
Executive Summary - Chart on Market by Geography
Executive Summary - Chart on Market Segmentation by Product
Executive Summary - Chart on Market Segmentation by End-user
Executive Summary - Chart on Market Segmentation by Distribution Channel
Executive Summary - Chart on Incremental Growth
Executive Summary - Data Table on Incremental Growth
Executive Summary - Chart on Company Market Positioning

2. Technavio Analysis

2.1 Analysis of price sensitivity, lifecycle, customer purchase basket, adoption rates, and purchase criteria

2.2 Criticality of inputs and Factors of differentiation

Chart on Overview on criticality of inputs and factors of differentiation

2.3 Factors of disruption

Chart on Overview on factors of disruption

2.4 Impact of drivers and challenges

Chart on Impact of drivers and challenges in 2025 and 2030

3. Market Landscape

3.1 Market ecosystem

Chart on Parent Market
Data Table on - Parent Market

3.2 Market characteristics

Chart on Market characteristics analysis

3.3 Value chain analysis

Chart on Value chain analysis

4. Market Sizing

4.1 Market definition

Data Table on Offerings of companies included in the market definition

4.2 Market segment analysis

Market segments

4.3 Market size 2025

4.4 Market outlook: Forecast for 2025-2030

Chart on Global - Market size and forecast 2025-2030 ($ million)
Data Table on Global - Market size and forecast 2025-2030 ($ million)
Chart on Global Market: Year-over-year growth 2025-2030 (%)
Data Table on Global Market: Year-over-year growth 2025-2030 (%)

5. Historic Market Size

5.1 Global Reflective Materials Market 2020 - 2024

Historic Market Size - Data Table on Global Reflective Materials Market 2020 - 2024 ($ million)

5.2 Product segment analysis 2020 - 2024

Historic Market Size - Product Segment 2020 - 2024 ($ million)

5.3 End-user segment analysis 2020 - 2024

Historic Market Size - End-user Segment 2020 - 2024 ($ million)

5.4 Distribution Channel segment analysis 2020 - 2024

Historic Market Size - Distribution Channel Segment 2020 - 2024 ($ million)

5.5 Geography segment analysis 2020 - 2024

Historic Market Size - Geography Segment 2020 - 2024 ($ million)

5.6 Country segment analysis 2020 - 2024

Historic Market Size - Country Segment 2020 - 2024 ($ million)

6. Qualitative Analysis

6.1 Impact of AI on Global Reflective Materials Market

7. Five Forces Analysis

7.1 Five forces summary

Five forces analysis - Comparison between 2025 and 2030

7.2 Bargaining power of buyers

Bargaining power of buyers - Impact of key factors 2025 and 2030

7.3 Bargaining power of suppliers

Bargaining power of suppliers - Impact of key factors in 2025 and 2030

7.4 Threat of new entrants

Threat of new entrants - Impact of key factors in 2025 and 2030

7.5 Threat of substitutes

Threat of substitutes - Impact of key factors in 2025 and 2030

7.6 Threat of rivalry

Threat of rivalry - Impact of key factors in 2025 and 2030

7.7 Market condition

Chart on Market condition - Five forces 2025 and 2030

8. Market Segmentation by Product

8.1 Market segments

Chart on Product - Market share 2025-2030 (%)
Data Table on Product - Market share 2025-2030 (%)

8.2 Comparison by Product

Chart on Comparison by Product
Data Table on Comparison by Product

8.3 Coatings - Market size and forecast 2025-2030

Chart on Coatings - Market size and forecast 2025-2030 ($ million)
Data Table on Coatings - Market size and forecast 2025-2030 ($ million)
Chart on Coatings - Year-over-year growth 2025-2030 (%)
Data Table on Coatings - Year-over-year growth 2025-2030 (%)

8.4 Fabrics - Market size and forecast 2025-2030

Chart on Fabrics - Market size and forecast 2025-2030 ($ million)
Data Table on Fabrics - Market size and forecast 2025-2030 ($ million)
Chart on Fabrics - Year-over-year growth 2025-2030 (%)
Data Table on Fabrics - Year-over-year growth 2025-2030 (%)

8.5 Sheets - Market size and forecast 2025-2030

Chart on Sheets - Market size and forecast 2025-2030 ($ million)
Data Table on Sheets - Market size and forecast 2025-2030 ($ million)
Chart on Sheets - Year-over-year growth 2025-2030 (%)
Data Table on Sheets - Year-over-year growth 2025-2030 (%)

8.6 Paints and inks - Market size and forecast 2025-2030

Chart on Paints and inks - Market size and forecast 2025-2030 ($ million)
Data Table on Paints and inks - Market size and forecast 2025-2030 ($ million)
Chart on Paints and inks - Year-over-year growth 2025-2030 (%)
Data Table on Paints and inks - Year-over-year growth 2025-2030 (%)

8.7 Others - Market size and forecast 2025-2030

Chart on Others - Market size and forecast 2025-2030 ($ million)
Data Table on Others - Market size and forecast 2025-2030 ($ million)
Chart on Others - Year-over-year growth 2025-2030 (%)
Data Table on Others - Year-over-year growth 2025-2030 (%)

8.8 Market opportunity by Product

Market opportunity by Product ($ million)
Data Table on Market opportunity by Product ($ million)

9. Market Segmentation by End-user

9.1 Market segments

Chart on End-user - Market share 2025-2030 (%)
Data Table on End-user - Market share 2025-2030 (%)

9.2 Comparison by End-user

Chart on Comparison by End-user
Data Table on Comparison by End-user

9.3 Construction - Market size and forecast 2025-2030

Chart on Construction - Market size and forecast 2025-2030 ($ million)
Data Table on Construction - Market size and forecast 2025-2030 ($ million)
Chart on Construction - Year-over-year growth 2025-2030 (%)
Data Table on Construction - Year-over-year growth 2025-2030 (%)

9.4 Automobiles - Market size and forecast 2025-2030

Chart on Automobiles - Market size and forecast 2025-2030 ($ million)
Data Table on Automobiles - Market size and forecast 2025-2030 ($ million)
Chart on Automobiles - Year-over-year growth 2025-2030 (%)
Data Table on Automobiles - Year-over-year growth 2025-2030 (%)

9.5 Textiles - Market size and forecast 2025-2030

Chart on Textiles - Market size and forecast 2025-2030 ($ million)
Data Table on Textiles - Market size and forecast 2025-2030 ($ million)
Chart on Textiles - Year-over-year growth 2025-2030 (%)
Data Table on Textiles - Year-over-year growth 2025-2030 (%)

9.6 Electronics - Market size and forecast 2025-2030

Chart on Electronics - Market size and forecast 2025-2030 ($ million)
Data Table on Electronics - Market size and forecast 2025-2030 ($ million)
Chart on Electronics - Year-over-year growth 2025-2030 (%)
Data Table on Electronics - Year-over-year growth 2025-2030 (%)

9.7 Market opportunity by End-user

Market opportunity by End-user ($ million)
Data Table on Market opportunity by End-user ($ million)

10. Market Segmentation by Distribution Channel

10.1 Market segments

Chart on Distribution Channel - Market share 2025-2030 (%)
Data Table on Distribution Channel - Market share 2025-2030 (%)

10.2 Comparison by Distribution Channel

Chart on Comparison by Distribution Channel
Data Table on Comparison by Distribution Channel

10.3 Direct sales - Market size and forecast 2025-2030

Chart on Direct sales - Market size and forecast 2025-2030 ($ million)
Data Table on Direct sales - Market size and forecast 2025-2030 ($ million)
Chart on Direct sales - Year-over-year growth 2025-2030 (%)
Data Table on Direct sales - Year-over-year growth 2025-2030 (%)

10.4 Retail - Market size and forecast 2025-2030

Chart on Retail - Market size and forecast 2025-2030 ($ million)
Data Table on Retail - Market size and forecast 2025-2030 ($ million)
Chart on Retail - Year-over-year growth 2025-2030 (%)
Data Table on Retail - Year-over-year growth 2025-2030 (%)

10.5 Online platforms - Market size and forecast 2025-2030

Chart on Online platforms - Market size and forecast 2025-2030 ($ million)
Data Table on Online platforms - Market size and forecast 2025-2030 ($ million)
Chart on Online platforms - Year-over-year growth 2025-2030 (%)
Data Table on Online platforms - Year-over-year growth 2025-2030 (%)

10.6 Market opportunity by Distribution Channel

Market opportunity by Distribution Channel ($ million)
Data Table on Market opportunity by Distribution Channel ($ million)

11. Customer Landscape

11.1 Customer landscape overview

Analysis of price sensitivity, lifecycle, customer purchase basket, adoption rates, and purchase criteria

12. Geographic Landscape

12.1 Geographic segmentation

Chart on Market share by geography 2025-2030 (%)
Data Table on Market share by geography 2025-2030 (%)

12.2 Geographic comparison

Chart on Geographic comparison
Data Table on Geographic comparison

12.3 APAC - Market size and forecast 2025-2030

Chart on APAC - Market size and forecast 2025-2030 ($ million)
Data Table on APAC - Market size and forecast 2025-2030 ($ million)
Chart on APAC - Year-over-year growth 2025-2030 (%)
Data Table on APAC - Year-over-year growth 2025-2030 (%)
Chart on Regional Comparison - APAC
Data Table on Regional Comparison - APAC

12.3.1 China - Market size and forecast 2025-2030

Chart on China - Market size and forecast 2025-2030 ($ million)
Data Table on China - Market size and forecast 2025-2030 ($ million)
Chart on China - Year-over-year growth 2025-2030 (%)
Data Table on China - Year-over-year growth 2025-2030 (%)

12.3.2 Japan - Market size and forecast 2025-2030

Chart on Japan - Market size and forecast 2025-2030 ($ million)
Data Table on Japan - Market size and forecast 2025-2030 ($ million)
Chart on Japan - Year-over-year growth 2025-2030 (%)
Data Table on Japan - Year-over-year growth 2025-2030 (%)

12.3.3 India - Market size and forecast 2025-2030

Chart on India - Market size and forecast 2025-2030 ($ million)
Data Table on India - Market size and forecast 2025-2030 ($ million)
Chart on India - Year-over-year growth 2025-2030 (%)
Data Table on India - Year-over-year growth 2025-2030 (%)

12.3.4 South Korea - Market size and forecast 2025-2030

Chart on South Korea - Market size and forecast 2025-2030 ($ million)
Data Table on South Korea - Market size and forecast 2025-2030 ($ million)
Chart on South Korea - Year-over-year growth 2025-2030 (%)
Data Table on South Korea - Year-over-year growth 2025-2030 (%)

12.3.5 Australia - Market size and forecast 2025-2030

Chart on Australia - Market size and forecast 2025-2030 ($ million)
Data Table on Australia - Market size and forecast 2025-2030 ($ million)
Chart on Australia - Year-over-year growth 2025-2030 (%)
Data Table on Australia - Year-over-year growth 2025-2030 (%)

12.3.6 Indonesia - Market size and forecast 2025-2030

Chart on Indonesia - Market size and forecast 2025-2030 ($ million)
Data Table on Indonesia - Market size and forecast 2025-2030 ($ million)
Chart on Indonesia - Year-over-year growth 2025-2030 (%)
Data Table on Indonesia - Year-over-year growth 2025-2030 (%)

12.4 North America - Market size and forecast 2025-2030

Chart on North America - Market size and forecast 2025-2030 ($ million)
Data Table on North America - Market size and forecast 2025-2030 ($ million)
Chart on North America - Year-over-year growth 2025-2030 (%)
Data Table on North America - Year-over-year growth 2025-2030 (%)
Chart on Regional Comparison - North America
Data Table on Regional Comparison - North America

12.4.1 US - Market size and forecast 2025-2030

Chart on US - Market size and forecast 2025-2030 ($ million)
Data Table on US - Market size and forecast 2025-2030 ($ million)
Chart on US - Year-over-year growth 2025-2030 (%)
Data Table on US - Year-over-year growth 2025-2030 (%)

12.4.2 Canada - Market size and forecast 2025-2030

Chart on Canada - Market size and forecast 2025-2030 ($ million)
Data Table on Canada - Market size and forecast 2025-2030 ($ million)
Chart on Canada - Year-over-year growth 2025-2030 (%)
Data Table on Canada - Year-over-year growth 2025-2030 (%)

12.4.3 Mexico - Market size and forecast 2025-2030

Chart on Mexico - Market size and forecast 2025-2030 ($ million)
Data Table on Mexico - Market size and forecast 2025-2030 ($ million)
Chart on Mexico - Year-over-year growth 2025-2030 (%)
Data Table on Mexico - Year-over-year growth 2025-2030 (%)

12.5 Europe - Market size and forecast 2025-2030

Chart on Europe - Market size and forecast 2025-2030 ($ million)
Data Table on Europe - Market size and forecast 2025-2030 ($ million)
Chart on Europe - Year-over-year growth 2025-2030 (%)
Data Table on Europe - Year-over-year growth 2025-2030 (%)
Chart on Regional Comparison - Europe
Data Table on Regional Comparison - Europe

12.5.1 Germany - Market size and forecast 2025-2030

Chart on Germany - Market size and forecast 2025-2030 ($ million)
Data Table on Germany - Market size and forecast 2025-2030 ($ million)
Chart on Germany - Year-over-year growth 2025-2030 (%)
Data Table on Germany - Year-over-year growth 2025-2030 (%)

12.5.2 UK - Market size and forecast 2025-2030

Chart on UK - Market size and forecast 2025-2030 ($ million)
Data Table on UK - Market size and forecast 2025-2030 ($ million)
Chart on UK - Year-over-year growth 2025-2030 (%)
Data Table on UK - Year-over-year growth 2025-2030 (%)

12.5.3 France - Market size and forecast 2025-2030

Chart on France - Market size and forecast 2025-2030 ($ million)
Data Table on France - Market size and forecast 2025-2030 ($ million)
Chart on France - Year-over-year growth 2025-2030 (%)
Data Table on France - Year-over-year growth 2025-2030 (%)

12.5.4 Italy - Market size and forecast 2025-2030

Chart on Italy - Market size and forecast 2025-2030 ($ million)
Data Table on Italy - Market size and forecast 2025-2030 ($ million)
Chart on Italy - Year-over-year growth 2025-2030 (%)
Data Table on Italy - Year-over-year growth 2025-2030 (%)

12.5.5 Spain - Market size and forecast 2025-2030

Chart on Spain - Market size and forecast 2025-2030 ($ million)
Data Table on Spain - Market size and forecast 2025-2030 ($ million)
Chart on Spain - Year-over-year growth 2025-2030 (%)
Data Table on Spain - Year-over-year growth 2025-2030 (%)

12.5.6 The Netherlands - Market size and forecast 2025-2030

Chart on The Netherlands - Market size and forecast 2025-2030 ($ million)
Data Table on The Netherlands - Market size and forecast 2025-2030 ($ million)
Chart on The Netherlands - Year-over-year growth 2025-2030 (%)
Data Table on The Netherlands - Year-over-year growth 2025-2030 (%)

12.6 Middle East and Africa - Market size and forecast 2025-2030

Chart on Middle East and Africa - Market size and forecast 2025-2030 ($ million)
Data Table on Middle East and Africa - Market size and forecast 2025-2030 ($ million)
Chart on Middle East and Africa - Year-over-year growth 2025-2030 (%)
Data Table on Middle East and Africa - Year-over-year growth 2025-2030 (%)
Chart on Regional Comparison - Middle East and Africa
Data Table on Regional Comparison - Middle East and Africa

12.6.1 Saudi Arabia - Market size and forecast 2025-2030

Chart on Saudi Arabia - Market size and forecast 2025-2030 ($ million)
Data Table on Saudi Arabia - Market size and forecast 2025-2030 ($ million)
Chart on Saudi Arabia - Year-over-year growth 2025-2030 (%)
Data Table on Saudi Arabia - Year-over-year growth 2025-2030 (%)

12.6.2 UAE - Market size and forecast 2025-2030

Chart on UAE - Market size and forecast 2025-2030 ($ million)
Data Table on UAE - Market size and forecast 2025-2030 ($ million)
Chart on UAE - Year-over-year growth 2025-2030 (%)
Data Table on UAE - Year-over-year growth 2025-2030 (%)

12.6.3 South Africa - Market size and forecast 2025-2030

Chart on South Africa - Market size and forecast 2025-2030 ($ million)
Data Table on South Africa - Market size and forecast 2025-2030 ($ million)
Chart on South Africa - Year-over-year growth 2025-2030 (%)
Data Table on South Africa - Year-over-year growth 2025-2030 (%)

12.6.4 Israel - Market size and forecast 2025-2030

Chart on Israel - Market size and forecast 2025-2030 ($ million)
Data Table on Israel - Market size and forecast 2025-2030 ($ million)
Chart on Israel - Year-over-year growth 2025-2030 (%)
Data Table on Israel - Year-over-year growth 2025-2030 (%)

12.6.5 Turkey - Market size and forecast 2025-2030

Chart on Turkey - Market size and forecast 2025-2030 ($ million)
Data Table on Turkey - Market size and forecast 2025-2030 ($ million)
Chart on Turkey - Year-over-year growth 2025-2030 (%)
Data Table on Turkey - Year-over-year growth 2025-2030 (%)

12.7 South America - Market size and forecast 2025-2030

Chart on South America - Market size and forecast 2025-2030 ($ million)
Data Table on South America - Market size and forecast 2025-2030 ($ million)
Chart on South America - Year-over-year growth 2025-2030 (%)
Data Table on South America - Year-over-year growth 2025-2030 (%)
Chart on Regional Comparison - South America
Data Table on Regional Comparison - South America

12.7.1 Brazil - Market size and forecast 2025-2030

Chart on Brazil - Market size and forecast 2025-2030 ($ million)
Data Table on Brazil - Market size and forecast 2025-2030 ($ million)
Chart on Brazil - Year-over-year growth 2025-2030 (%)
Data Table on Brazil - Year-over-year growth 2025-2030 (%)

12.7.2 Argentina - Market size and forecast 2025-2030

Chart on Argentina - Market size and forecast 2025-2030 ($ million)
Data Table on Argentina - Market size and forecast 2025-2030 ($ million)
Chart on Argentina - Year-over-year growth 2025-2030 (%)
Data Table on Argentina - Year-over-year growth 2025-2030 (%)

12.7.3 Chile - Market size and forecast 2025-2030

Chart on Chile - Market size and forecast 2025-2030 ($ million)
Data Table on Chile - Market size and forecast 2025-2030 ($ million)
Chart on Chile - Year-over-year growth 2025-2030 (%)
Data Table on Chile - Year-over-year growth 2025-2030 (%)

12.8 Market opportunity by geography

Market opportunity by geography ($ million)
Data Tables on Market opportunity by geography ($ million)

13. Drivers, Challenges, and Opportunity

13.1 Market drivers

Heightened focus on safety applications propels market growth
Stringent government safety regulations as key market catalyst
Expansion of construction and automotive industries fueling demand

13.2 Market challenges

Fluctuating raw material prices persistent margin corrosive
Intensifying competition from substitute products and technologies
Escalating environmental scrutiny and regulatory pressures

13.3 Impact of drivers and challenges

Impact of drivers and challenges in 2025 and 2030

13.4 Market opportunities

Rising demand driven by stricter global safety regulations and standards
Expansion of the construction and infrastructure sector
Technological advancements in reflective materials

14. Competitive Landscape

14.1 Overview

14.2

Overview on criticality of inputs and factors of differentiation

14.3 Landscape disruption

Overview on factors of disruption

14.4 Industry risks

Impact of key risks on business

15. Competitive Analysis

15.1 Companies profiled

Companies covered

15.2 Company ranking index

15.3 Market positioning of companies

Matrix on companies position and classification

15.4 3M Co.

3M Co. - Overview
3M Co. - Business segments
3M Co. - Key news
3M Co. - Key offerings
3M Co. - Segment focus
SWOT

15.5 Avery Dennison Corp.

Avery Dennison Corp. - Overview
Avery Dennison Corp. - Business segments
Avery Dennison Corp. - Key news
Avery Dennison Corp. - Key offerings
Avery Dennison Corp. - Segment focus
SWOT

15.6 Coats Group PLC

Coats Group PLC - Overview
Coats Group PLC - Business segments
Coats Group PLC - Key offerings
Coats Group PLC - Segment focus
SWOT

15.7 Daoming Optics and Chemical Co. Ltd.

Daoming Optics and Chemical Co. Ltd. - Overview
Daoming Optics and Chemical Co. Ltd. - Business segments
Daoming Optics and Chemical Co. Ltd. - Key offerings
Daoming Optics and Chemical Co. Ltd. - Segment focus
SWOT

15.8 Jinsung Co. Ltd.

Jinsung Co. Ltd. - Overview
Jinsung Co. Ltd. - Product / Service
Jinsung Co. Ltd. - Key offerings
SWOT

15.9 Nippon Carbide Industries Co. Ltd.

Nippon Carbide Industries Co. Ltd. - Overview
Nippon Carbide Industries Co. Ltd. - Business segments
Nippon Carbide Industries Co. Ltd. - Key offerings
Nippon Carbide Industries Co. Ltd. - Segment focus
SWOT

15.10 ORAFOL Europe GmbH

ORAFOL Europe GmbH - Overview
ORAFOL Europe GmbH - Product / Service
ORAFOL Europe GmbH - Key offerings
SWOT

15.11 Paiho Shih Holdings Corp.

Paiho Shih Holdings Corp. - Overview
Paiho Shih Holdings Corp. - Business segments
Paiho Shih Holdings Corp. - Key offerings
Paiho Shih Holdings Corp. - Segment focus
SWOT

15.12 PPG Industries Inc.

PPG Industries Inc. - Overview
PPG Industries Inc. - Business segments
PPG Industries Inc. - Key news
PPG Industries Inc. - Key offerings
PPG Industries Inc. - Segment focus
SWOT

15.13 REFLOMAX Co. Ltd.

REFLOMAX Co. Ltd. - Overview
REFLOMAX Co. Ltd. - Product / Service
REFLOMAX Co. Ltd. - Key offerings
SWOT

15.14 SKC

SKC - Overview
SKC - Business segments
SKC - Key offerings
SKC - Segment focus
SWOT

15.15 S.V.G.I. OPT S.r.l.

S.V.G.I. OPT S.r.l. - Overview
S.V.G.I. OPT S.r.l. - Product / Service
S.V.G.I. OPT S.r.l. - Key offerings
SWOT

15.16 Unitika Ltd.

Unitika Ltd. - Overview
Unitika Ltd. - Business segments
Unitika Ltd. - Key offerings
Unitika Ltd. - Segment focus
SWOT

15.17 Viz Reflectives

Viz Reflectives - Overview
Viz Reflectives - Product / Service
Viz Reflectives - Key offerings
SWOT

15.18 Yeshili Reflective Material Co. Ltd.

Yeshili Reflective Material Co. Ltd. - Overview
Yeshili Reflective Material Co. Ltd. - Product / Service
Yeshili Reflective Material Co. Ltd. - Key offerings
SWOT

16. Appendix

16.1 Scope of the report

Market definition
Objectives
Notes and caveats

16.2 Inclusions and exclusions checklist

Inclusions checklist
Exclusions checklist

16.3 Currency conversion rates for US$

16.4 Research methodology

16.5 Data procurement

Information sources

16.6 Data validation

16.7 Validation techniques employed for market sizing

16.8 Data synthesis

16.9 360 degree market analysis

16.10 List of abbreviations

Research Methodology

Technavio presents a detailed picture of the market by way of study, synthesis, and summation of data from multiple sources. The analysts have presented the various facets of the market with a particular focus on identifying the key industry influencers. The data thus presented is comprehensive, reliable, and the result of extensive research, both primary and secondary.

INFORMATION SOURCES

Primary sources

  • Manufacturers and suppliers
  • Channel partners
  • Industry experts
  • Strategic decision makers

Secondary sources

  • Industry journals and periodicals
  • Government data
  • Financial reports of key industry players
  • Historical data
  • Press releases

DATA ANALYSIS

Data Synthesis

  • Collation of data
  • Estimation of key figures
  • Analysis of derived insights

Data Validation

  • Triangulation with data models
  • Reference against proprietary databases
  • Corroboration with industry experts

REPORT WRITING

Qualitative

  • Market drivers
  • Market challenges
  • Market trends
  • Five forces analysis

Quantitative

  • Market size and forecast
  • Market segmentation
  • Geographical insights
  • Competitive landscape

Interested in this report?

Get your sample now to see our research methodology and insights!

Download Now

Frequently Asked Questions

Reflective Materials market growth will increase by USD 9379.0 million during 2026-2030.

The Reflective Materials market is expected to grow at a CAGR of 5.8% during 2026-2030.

Reflective Materials market is segmented by Product (Coatings, Fabrics, Sheets, Paints and inks, Others) End-user (Construction, Automobiles, Textiles, Electronics) Distribution channel (Direct sales, Retail, Online platforms)

3M Co., Avery Dennison Corp., Avient Corp., Coats Group PLC, Daoming Optics and Chemical Co. Ltd., Jinsung Co. Ltd., JRC REFLEX ITALIA S.r.l., Nippon Carbide Industries Co. Ltd., ORAFOL Europe GmbH, Paiho Shih Holdings Corp., PPG Industries Inc., Reflectionight Inc., REFLOMAX Co. Ltd., SKC, S.V.G.I. OPT S.r.l., Unitika Ltd., Viz Reflectives, Yeshili Reflective Material Co. Ltd. are a few of the key vendors in the Reflective Materials market.

APAC will register the highest growth rate of 47.8% among the other regions. Therefore, the Reflective Materials market in APAC is expected to garner significant business opportunities for the vendors during the forecast period.

China, Japan, India, South Korea, Australia, Indonesia, US, Canada, Mexico, Germany, UK, France, Italy, Spain, The Netherlands, Saudi Arabia, UAE, South Africa, Israel, Turkey, Brazil, Argentina, Chile

  • Heightened focus on safety applications propels market growth is the driving factor this market.

The Reflective Materials market vendors should focus on grabbing business opportunities from the Product segment as it accounted for the largest market share in the base year.