Sales Enablement Platform Market Analysis, Size, and Forecast 2025-2029: North America (US), Europe (France, Germany, Italy, and UK), APAC (China, India, Japan, and South Korea), South America (Brazil), and Rest of World (ROW)

Sales Enablement Platform Market Analysis, Size, and Forecast 2025-2029:
North America (US), Europe (France, Germany, Italy, and UK), APAC (China, India, Japan, and South Korea), South America (Brazil), and Rest of World (ROW)

Published: Jun 2025 204 Pages SKU: IRTNTR75859

Market Overview at a Glance

$6.43 B
Market Opportunity
17.1%
CAGR
15.5
YoY growth 2024-2025(%)

Sales Enablement Platform Market Size 2025-2029

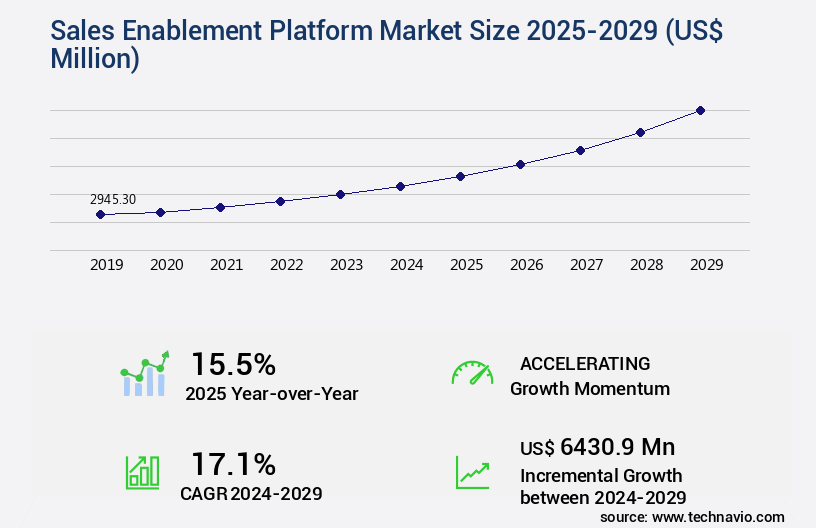
The sales enablement platform market size is valued to increase by USD 6.43 billion, at a CAGR of 17.1% from 2024 to 2029. Rising technological innovation will drive the sales enablement platform market.

Major Market Trends & Insights

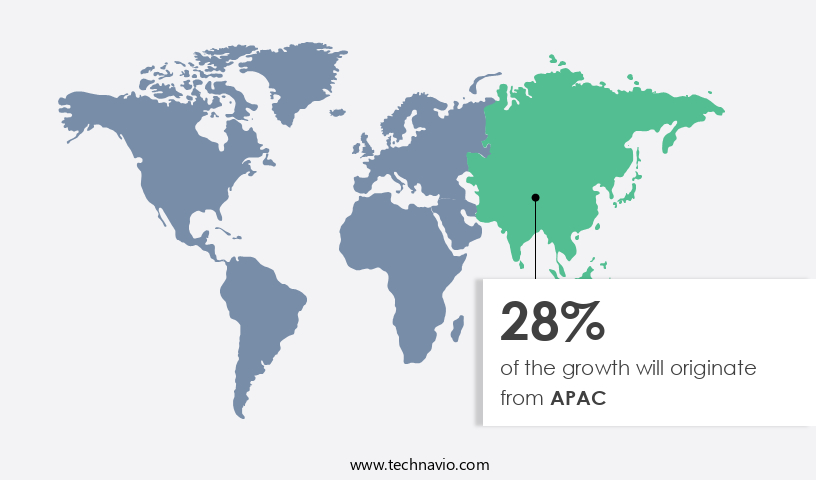
  • APAC dominated the market and accounted for a 28% growth during the forecast period.
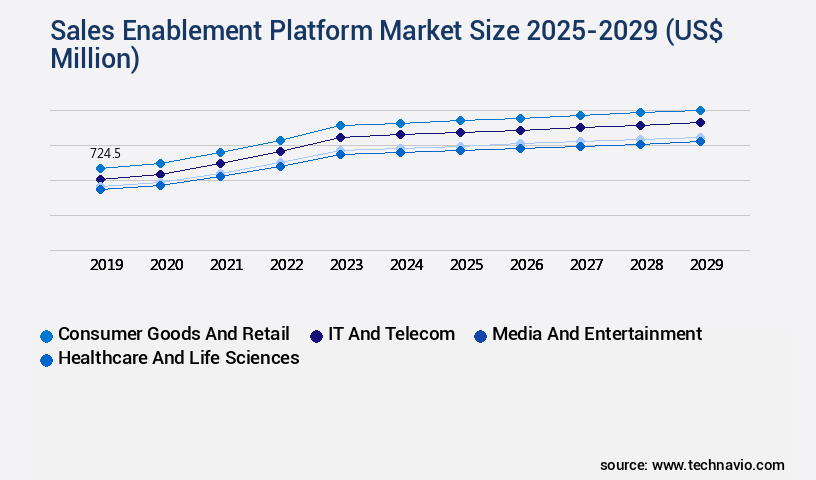
  • By End-user - Consumer goods and retail segment was valued at USD 724.50 billion in 2023
  • By Component - Platform segment accounted for the largest market revenue share in 2023

Market Size & Forecast

  • Market Opportunities: USD 299.44 million
  • Market Future Opportunities: USD 6430.90 million
  • CAGR : 17.1%
  • APAC: Largest market in 2023

Market Summary

  • The market represents a dynamic and continuously evolving landscape, driven by the exponential growth of marketing intelligence and rising technological innovation. Core technologies and applications, such as predictive analytics and artificial intelligence, are revolutionizing sales processes by providing real-time insights and personalized customer engagement. Service types or product categories, including sales engagement platforms and content management systems, are seeing increased adoption rates, with sales engagement platforms holding a significant market share. However, concerns related to data security and privacy remain a major challenge, as sales enablement platforms process and store sensitive customer information.
  • Despite this, the opportunities for growth are immense, with the market expected to experience significant expansion in the coming years. According to recent reports, the market is projected to grow at an impressive rate, with a notable increase in adoption rates among businesses of all sizes.

What will be the Size of the Sales Enablement Platform Market during the forecast period?

Sales Enablement Platform Market Size

Get Key Insights on Market Forecast (PDF) Request Free Sample

How is the Sales Enablement Platform Market Segmented and what are the key trends of market segmentation?

The sales enablement platform industry research report provides comprehensive data (region-wise segment analysis), with forecasts and estimates in "USD million" for the period 2025-2029, as well as historical data from 2019-2023 for the following segments.

  • End-user
    • Consumer goods and retail
    • IT and telecom
    • Media and entertainment
    • Healthcare and life sciences
    • Others
  • Component
    • Platform
    • Services
  • Deployment
    • Cloud-based
    • On-premises
  • Geography
    • North America
      • US
    • Europe
      • France
      • Germany
      • Italy
      • UK
    • APAC
      • China
      • India
      • Japan
      • South Korea
    • South America
      • Brazil
    • Rest of World (ROW)

By End-user Insights

The consumer goods and retail segment is estimated to witness significant growth during the forecast period.

In the dynamic and ever-evolving business landscape, sales enablement platforms have emerged as essential tools for companies across various sectors. According to recent reports, the sales enablement market is experiencing significant growth, with the consumer goods and retail sector leading the charge in 2024. Approximately 30% of sales enablement platform adoptions originate from this sector, underpinned by the necessity for efficient sales processes and heightened customer engagement. Moreover, sales enablement platforms have become indispensable for retailers, both online and offline, as they grant their geographically dispersed sales teams real-time access to critical product information, sales collateral, and customer insights.

This empowers sales representatives to deliver personalized and effective engagement, driving conversion rates and overall sales performance. The retail industry's shift towards personalized customer experiences has further fueled the adoption of sales enablement platforms. Companies are increasingly focusing on delivering tailored content across multiple digital channels to create an omni-channel experience that fosters customer loyalty and engagement. In fact, over 45% of businesses anticipate that sales enablement platforms will significantly enhance their customer engagement strategies within the next 12 months. Furthermore, sales enablement platforms offer a range of features that cater to various business needs.

These include contract management systems, quote generation tools, sales content personalization, incentive program management, competitive intelligence tools, customer relationship management, gamification strategies, sales operations efficiency, sales forecasting techniques, sales engagement platforms, lead qualification tools, content management systems, sales activity monitoring, win-loss analysis review, revenue attribution modeling, onboarding new employees, customer success platforms, sales communication tracking, content syndication platforms, sales team collaboration, sales territory management, sales pipeline management, sales process automation, marketing automation integration, sales analytics dashboards, proposal generation software, customer segmentation strategies, sales playbooks creation, deal registration processes, sales performance metrics, sales quota attainment, sales coaching modules, training content delivery, and lead nurturing workflows.

By integrating these features, sales enablement platforms enable businesses to streamline their sales processes, improve sales efficiency, and gain valuable insights into customer behavior and market trends. This data-driven approach empowers sales teams to make informed decisions, ultimately leading to increased revenue and growth.

Sales Enablement Platform Market Size

Request Free Sample

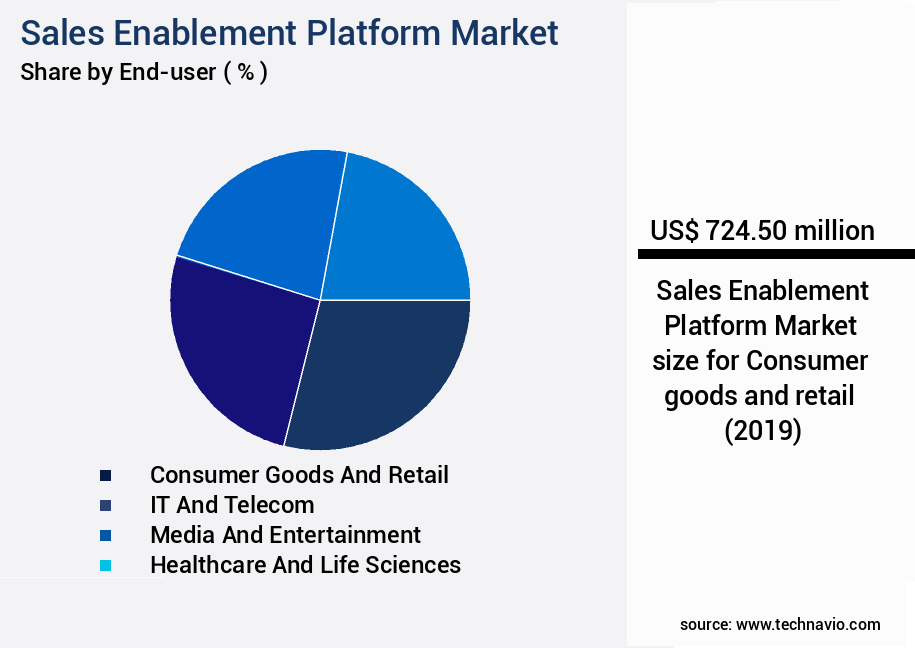
The Consumer goods and retail segment was valued at USD 724.50 billion in 2019 and showed a gradual increase during the forecast period.

Sales Enablement Platform Market Size

Request Free Sample

Regional Analysis

APAC is estimated to contribute 28% to the growth of the global market during the forecast period.Technavio's analysts have elaborately explained the regional trends and drivers that shape the market during the forecast period.

Sales Enablement Platform Market Share by Geography

See How Sales Enablement Platform Market Demand is Rising in APAC Request Free Sample

Sales enablement platforms have gained significant traction in the business world, particularly in North America, where enterprises are early adopters of cloud services and software. By 2024, the market landscape for these platforms continues to evolve, driven by technological advancements and shifting business priorities. The increasing costs of management consulting services have led companies to explore alternative solutions. Sales enablement platforms, which offer actionable insights using AI-driven analytics and automation, have emerged as a cost-effective alternative. However, management consulting firms still maintain a strong presence, especially among Fortune 500 companies, who value their credibility and comprehensive service offerings.

According to recent studies, the market is expected to grow, with 67% of companies planning to invest in these solutions by 2025. Additionally, 84% of sales organizations believe that they will increase their sales productivity through the use of these platforms. Furthermore, 79% of companies agree that sales enablement platforms help them close deals faster. These platforms not only streamline operations but also provide valuable insights, enabling businesses to make data-driven decisions and improve overall sales performance.

Market Dynamics

Our researchers analyzed the data with 2024 as the base year, along with the key drivers, trends, and challenges. A holistic analysis of drivers will help companies refine their marketing strategies to gain a competitive advantage.

The market is a dynamic and evolving landscape, characterized by the integration of advanced technologies to optimize sales content repository, enhance sales team collaboration, and automate lead qualification processes. Sales teams are leveraging these platforms to improve performance metrics, personalize sales content strategies, and streamline sales process automation. One notable trend in the market is the integration of customer relationship management systems and sales forecasting techniques to measure sales training program effectiveness and design effective sales compensation plans. Sales operations efficiency improvement strategies are also gaining traction, with sales enablement technology stack implementation playing a pivotal role in enhancing sales team productivity.

Moreover, building effective sales coaching programs and revenue cycle management best practices are becoming essential components of sales enablement platforms. Sales activity monitoring and reporting, customer segmentation and targeting strategies, deal registration process improvement initiatives, and sales proposal generation software comparisons are other critical areas of focus. According to market intelligence, adoption rates of sales enablement platforms in large enterprises are significantly higher than in small and medium-sized businesses. Over 80% of large enterprises have adopted sales enablement platforms, compared to less than 50% of SMBs. This disparity highlights the growing importance of these platforms in driving sales success and the potential opportunities for companies in the SMB market.

In conclusion, the market is witnessing robust growth, driven by the need for optimizing sales processes, improving team collaboration, and enhancing sales team productivity. With a focus on data-driven insights and research-backed strategies, sales enablement platforms are becoming indispensable tools for businesses seeking to stay competitive in today's dynamic market landscape.

Sales Enablement Platform Market Size

What are the key market drivers leading to the rise in the adoption of Sales Enablement Platform Industry?

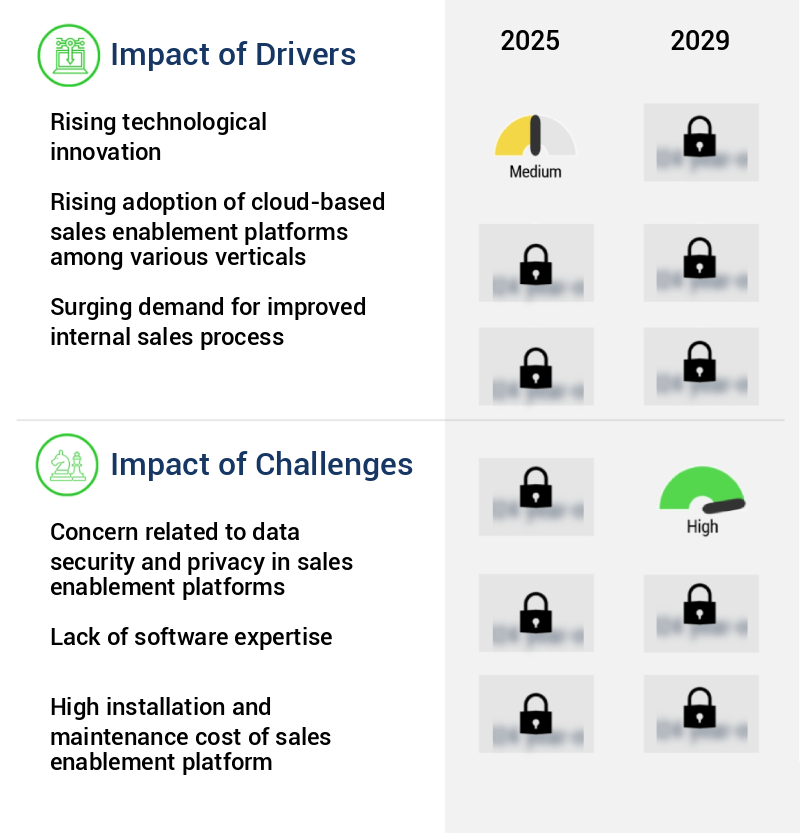
  • Rising technological innovations serve as the primary catalyst for market growth. 
  • In 2024, sales enablement platforms have seen substantial growth and advancements to cater to the escalating needs of businesses focusing on efficiency and customer engagement. Amidst intensifying competition, consulting firms and enterprises are harnessing advanced technologies to enhance their marketing strategies and streamline their operations. These platforms now incorporate AI-driven analytics, empowering businesses to base their decisions on data and fine-tune their marketing investments. The integration of AI is a prevailing trend, enabling organizations to anticipate customer behaviors, tailor interactions, and automate sales processes. The significance of customer-centric digital experiences has driven a surge in investments in sales enablement tools.
  • These platforms foster smooth collaboration between marketing and sales teams, ensuring that content remains relevant, timely, and in line with customer expectations. The ongoing evolution of sales enablement platforms underscores their crucial role in the business landscape, as they continue to adapt and respond to the ever-changing market dynamics.

What are the market trends shaping the Sales Enablement Platform Industry?

  • Marketing intelligence is experiencing exponential growth, emerging as the latest market trend.
  • The adoption of marketing intelligence among businesses across industries is witnessing a notable upsurge, driven by the increasing requirement for automated software to gather crucial data for informed decision-making. This continuous process of identifying market shifts has amplified the demand for market intelligence solutions. Moreover, marketing intelligence facilitates the targeted collection of customer data, thereby streamlining B2B processes and boosting the utilization of sales enablement platforms.
  • The significance of insightful data within organizations and the escalating adoption of marketing intelligence digital platforms are fueling the growth of sales enablement solutions. These platforms empower businesses to enhance their sales processes, optimize customer engagement, and ultimately drive revenue growth.

What challenges does the Sales Enablement Platform Industry face during its growth?

  • Data security and privacy concerns represent a significant challenge to the growth of sales enablement platforms, necessitating robust solutions to protect sensitive information and maintain client trust. 
  • A cloud-based sales enablement platform is a strategic choice for organizations looking to streamline their sales team operations. However, this shift comes with potential security concerns. While cloud computing offers convenience and cost savings, it introduces new risks. According to a recent study, over 80% of enterprise workloads will be in the cloud by 2025, highlighting the growing trend towards cloud adoption. Yet, 60% of companies using cloud services have experienced a security breach (IBM Security, 2020). The loss of data control and increased dependence on cloud service providers can lead to significant risks.
  • Organizations must address issues such as access control, risk management, auditing and logging, and regulatory and legislative compliance. In fact, 67% of companies cite security as a top concern when adopting cloud services (Gartner, 2020). Despite these challenges, the benefits of a cloud-based sales enablement platform, such as increased productivity and improved sales performance, often outweigh the risks. Organizations must implement robust security measures to mitigate potential threats and ensure the protection of their valuable data.

Exclusive Customer Landscape

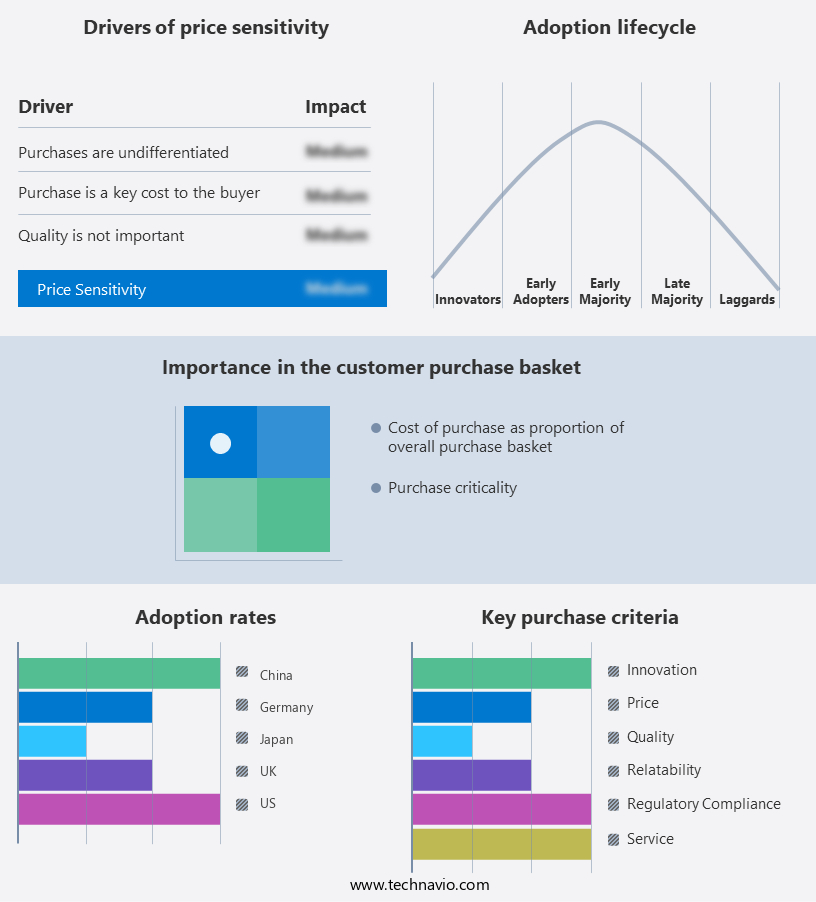
The sales enablement platform market forecasting report includes the adoption lifecycle of the market, covering from the innovator's stage to the laggard's stage. It focuses on adoption rates in different regions based on penetration. Furthermore, the sales enablement platform market report also includes key purchase criteria and drivers of price sensitivity to help companies evaluate and develop their market growth analysis strategies.

Sales Enablement Platform Market Share by Geography

 Customer Landscape of Sales Enablement Platform Industry

Competitive Landscape & Market Insights

Companies are implementing various strategies, such as strategic alliances, sales enablement platform market forecast, partnerships, mergers and acquisitions, geographical expansion, and product/service launches, to enhance their presence in the industry.

Bigtincan Holdings Ltd. - This company specializes in sales enablement solutions, enhancing customer-facing teams' capabilities through intelligent technology. By delivering personalized buying experiences, they enable increased sales and customer satisfaction.

The industry research and growth report includes detailed analyses of the competitive landscape of the market and information about key companies, including:

  • Bigtincan Holdings Ltd.
  • ClientPoint Inc.
  • Dropbox Inc.
  • GetAccept Inc.
  • Gong.io Inc.
  • Highspot Inc.
  • Mediafly Inc.
  • Mindtickle Inc.
  • PAPERFLITE
  • Pitcher AG
  • QorusDocs Ltd.
  • Qstream Inc.
  • Quark Software Inc.
  • Rallyware Inc.
  • Salesforce Inc.
  • Seismic Software Inc.
  • Showpad Inc.
  • Upland Software Inc.

Qualitative and quantitative analysis of companies has been conducted to help clients understand the wider business environment as well as the strengths and weaknesses of key industry players. Data is qualitatively analyzed to categorize companies as pure play, category-focused, industry-focused, and diversified; it is quantitatively analyzed to categorize companies as dominant, leading, strong, tentative, and weak.

Recent Development and News in Sales Enablement Platform Market

  • In January 2024, Seismic, a leading sales enablement platform provider, announced the launch of its new AI-powered content personalization engine, "IntelligenceX." This innovation enables sales teams to deliver contextually relevant content to prospects and customers, based on their industry, role, and engagement history (Seismic Press Release).
  • In March 2024, Salesforce and HubSpot, two major players in the sales enablement market, announced their partnership to integrate Salesforce's Sales Cloud and HubSpot's CRM and marketing automation tools. This collaboration aims to provide a more comprehensive solution for businesses, combining sales and marketing capabilities (Salesforce Press Release).
  • In May 2024, Showpad, a sales enablement platform, secured a USD50 million Series D funding round, led by Insight Partners. The investment will be used to expand the company's product offerings and global reach, as well as accelerate research and development (Showpad Press Release).
  • In January 2025, Google Workspace, a suite of productivity and collaboration tools, introduced native sales enablement features, including content libraries, coaching, and analytics. This move positions Google as a significant competitor in the sales enablement market, offering an all-in-one solution for businesses (Google Workspace Blog).

Dive into Technavio's robust research methodology, blending expert interviews, extensive data synthesis, and validated models for unparalleled Sales Enablement Platform Market insights. See full methodology.

Market Scope

Report Coverage

Details

Page number

204

Base year

2024

Historic period

2019-2023

Forecast period

2025-2029

Growth momentum & CAGR

Accelerate at a CAGR of 17.1%

Market growth 2025-2029

USD 6430.9 million

Market structure

Fragmented

YoY growth 2024-2025(%)

15.5

Key countries

US, China, UK, Germany, France, Japan, Brazil, Italy, India, and South Korea

Competitive landscape

Leading Companies, Market Positioning of Companies, Competitive Strategies, and Industry Risks

Request Free Sample

Research Analyst Overview

  • The sales enablement market continues to evolve, with various solutions emerging to address the dynamic needs of sales teams. Contract management systems streamline the agreement process, ensuring compliance and efficiency. Quote generation tools enable accurate and timely pricing, while sales content personalization tailors messaging to individual prospects. Incentive program management tools motivate sales representatives, aligning their efforts with business objectives. Competitive intelligence tools provide valuable insights into competitors, empowering teams to differentiate and outperform. Customer relationship management (CRM) systems facilitate effective communication and engagement, fostering long-term customer relationships. Gamification strategies introduce an element of fun and competition, boosting sales performance and morale.
  • Sales operations efficiency solutions optimize processes, reducing manual tasks and increasing productivity. Sales forecasting techniques employ data analysis to predict future sales trends and inform strategic decisions. Sales engagement platforms unify various sales tools, enhancing collaboration and communication. Lead qualification tools assess prospect readiness, ensuring resources are allocated effectively. Content management systems house and distribute sales materials, ensuring accessibility and consistency. Sales activity monitoring tracks team performance, offering insights into areas for improvement. Win-loss analysis reviews provide valuable feedback on sales strategies, informing continuous improvement. Revenue attribution modeling allocates revenue to specific sales activities, enabling accurate performance measurement.
  • Onboarding new employees is simplified with customer success platforms, providing essential resources and guidance. Sales communication tracking ensures messages are delivered effectively and efficiently. Content syndication platforms expand reach and visibility, while sales team collaboration tools foster a collaborative environment. Sales territory management optimizes resource allocation, balancing workloads and maximizing potential. Sales pipeline management tools provide real-time visibility into the sales process, enabling proactive intervention and improvement. Sales process automation streamlines repetitive tasks, freeing up time for more strategic activities. Marketing automation integration aligns sales and marketing efforts, ensuring a seamless customer journey. Sales analytics dashboards offer actionable insights, informing data-driven decision-making.
  • Proposal generation software accelerates the proposal process, enhancing the customer experience. Customer segmentation strategies enable targeted marketing and sales efforts, increasing conversion rates. Sales playbooks creation standardizes best practices, ensuring consistency and efficiency. The deal registration process ensures alignment and collaboration between sales and marketing teams. Sales performance metrics offer valuable insights into team performance, enabling continuous improvement. Sales quota attainment is tracked and analyzed, informing adjustments to sales targets. Sales coaching modules provide personalized training and development, enhancing team capabilities. Training content delivery is optimized, ensuring sales representatives are equipped with the latest knowledge and skills.
  • Lead nurturing workflows engage prospects, moving them through the sales funnel. Sales content repository offers a centralized location for sales materials, ensuring accessibility and consistency.

What are the Key Data Covered in this Sales Enablement Platform Market Research and Growth Report?

  • What is the expected growth of the Sales Enablement Platform Market between 2025 and 2029?

    • USD 6.43 billion, at a CAGR of 17.1%

  • What segmentation does the market report cover?

    • The report segmented by End-user (Consumer goods and retail, IT and telecom, Media and entertainment, Healthcare and life sciences, and Others), Component (Platform and Services), Deployment (Cloud-based and On-premises), and Geography (North America, Europe, APAC, Middle East and Africa, and South America)

  • Which regions are analyzed in the report?

    • North America, Europe, APAC, Middle East and Africa, and South America

  • What are the key growth drivers and market challenges?

    • Rising technological innovation, Concern related to data security and privacy in sales enablement platforms

  • Who are the major players in the Sales Enablement Platform Market?

    • Key Companies Bigtincan Holdings Ltd., ClientPoint Inc., Dropbox Inc., GetAccept Inc., Gong.io Inc., Highspot Inc., Mediafly Inc., Mindtickle Inc., PAPERFLITE, Pitcher AG, QorusDocs Ltd., Qstream Inc., Quark Software Inc., Rallyware Inc., Salesforce Inc., Seismic Software Inc., Showpad Inc., and Upland Software Inc.

Market Research Insights

  • The market encompasses a range of solutions designed to optimize sales content, measure sales effectiveness, and align sales and marketing efforts. According to recent industry estimates, the global sales productivity software market is projected to reach USD25.1 billion by 2026, growing at a compound annual growth rate (CAGR) of 12.3% from 2021. Sales enablement platforms play a crucial role in this market, providing features such as sales content optimization, sales training effectiveness, sales data visualization, and sales process optimization. Another key aspect of sales enablement platforms is their integration with salesforce and other CRM systems, enabling seamless lead routing automation, deal flow management, and salesforce alignment.
  • Furthermore, these platforms offer sales team performance metrics, allowing for continuous improvement and alignment with sales and marketing goals. For instance, sales pipeline velocity can be tracked, enabling teams to identify bottlenecks and improve sales rep productivity. Overall, sales enablement platforms contribute significantly to sales team performance and revenue cycle management by providing essential tools for sales content optimization, sales effectiveness measurement, and sales team alignment.

We can help! Our analysts can customize this sales enablement platform market research report to meet your requirements.

Get in touch

1 Executive Summary

  • 1.1 Market overview
    • Executive Summary - Chart on Market Overview
    • Executive Summary - Data Table on Market Overview
    • Executive Summary - Chart on Global Market Characteristics
    • Executive Summary - Chart on Market by Geography
    • Executive Summary - Chart on Market Segmentation by End-user
    • Executive Summary - Chart on Market Segmentation by Component
    • Executive Summary - Chart on Market Segmentation by Deployment
    • Executive Summary - Chart on Incremental Growth
    • Executive Summary - Data Table on Incremental Growth
    • Executive Summary - Chart on Company Market Positioning

2 Technavio Analysis

  • 2.1 Analysis of price sensitivity, lifecycle, customer purchase basket, adoption rates, and purchase criteria
    • Analysis of price sensitivity, lifecycle, customer purchase basket, adoption rates, and purchase criteria
  • 2.2 Criticality of inputs and Factors of differentiation
    • Overview on criticality of inputs and factors of differentiation
  • 2.3 Factors of disruption
    • Overview on factors of disruption
  • 2.4 Impact of drivers and challenges
    • Impact of drivers and challenges in 2024 and 2029

3 Market Landscape

  • 3.1 Market ecosystem
    • Parent Market
    • Data Table on - Parent Market
  • 3.2 Market characteristics
    • Market characteristics analysis
  • 3.3 Value chain analysis
    • Value chain analysis

4 Market Sizing

  • 4.1 Market definition
    • Offerings of companies included in the market definition
  • 4.2 Market segment analysis
    • Market segments
  • 4.3 Market size 2024
    • 4.4 Market outlook: Forecast for 2024-2029
      • Chart on Global - Market size and forecast 2024-2029 ($ million)
      • Data Table on Global - Market size and forecast 2024-2029 ($ million)
      • Chart on Global Market: Year-over-year growth 2024-2029 (%)
      • Data Table on Global Market: Year-over-year growth 2024-2029 (%)

    5 Historic Market Size

    • 5.1 Global Sales Enablement Platform Market 2019 - 2023
      • Historic Market Size - Data Table on Global Sales Enablement Platform Market 2019 - 2023 ($ million)
    • 5.2 End-user segment analysis 2019 - 2023
      • Historic Market Size - End-user Segment 2019 - 2023 ($ million)
    • 5.3 Component segment analysis 2019 - 2023
      • Historic Market Size - Component Segment 2019 - 2023 ($ million)
    • 5.4 Deployment segment analysis 2019 - 2023
      • Historic Market Size - Deployment Segment 2019 - 2023 ($ million)
    • 5.5 Geography segment analysis 2019 - 2023
      • Historic Market Size - Geography Segment 2019 - 2023 ($ million)
    • 5.6 Country segment analysis 2019 - 2023
      • Historic Market Size - Country Segment 2019 - 2023 ($ million)

    6 Qualitative Analysis

    • 6.1 The AI impact on global sales enablement platform market

      7 Five Forces Analysis

      • 7.1 Five forces summary
        • Five forces analysis - Comparison between 2024 and 2029
      • 7.2 Bargaining power of buyers
        • Bargaining power of buyers - Impact of key factors 2024 and 2029
      • 7.3 Bargaining power of suppliers
        • Bargaining power of suppliers - Impact of key factors in 2024 and 2029
      • 7.4 Threat of new entrants
        • Threat of new entrants - Impact of key factors in 2024 and 2029
      • 7.5 Threat of substitutes
        • Threat of substitutes - Impact of key factors in 2024 and 2029
      • 7.6 Threat of rivalry
        • Threat of rivalry - Impact of key factors in 2024 and 2029
      • 7.7 Market condition
        • Chart on Market condition - Five forces 2024 and 2029

      8 Market Segmentation by End-user

      • 8.1 Market segments
        • Chart on End-user - Market share 2024-2029 (%)
        • Data Table on End-user - Market share 2024-2029 (%)
      • 8.2 Comparison by End-user
        • Chart on Comparison by End-user
        • Data Table on Comparison by End-user
      • 8.3 Consumer goods and retail - Market size and forecast 2024-2029
        • Chart on Consumer goods and retail - Market size and forecast 2024-2029 ($ million)
        • Data Table on Consumer goods and retail - Market size and forecast 2024-2029 ($ million)
        • Chart on Consumer goods and retail - Year-over-year growth 2024-2029 (%)
        • Data Table on Consumer goods and retail - Year-over-year growth 2024-2029 (%)
      • 8.4 IT and telecom - Market size and forecast 2024-2029
        • Chart on IT and telecom - Market size and forecast 2024-2029 ($ million)
        • Data Table on IT and telecom - Market size and forecast 2024-2029 ($ million)
        • Chart on IT and telecom - Year-over-year growth 2024-2029 (%)
        • Data Table on IT and telecom - Year-over-year growth 2024-2029 (%)
      • 8.5 Media and entertainment - Market size and forecast 2024-2029
        • Chart on Media and entertainment - Market size and forecast 2024-2029 ($ million)
        • Data Table on Media and entertainment - Market size and forecast 2024-2029 ($ million)
        • Chart on Media and entertainment - Year-over-year growth 2024-2029 (%)
        • Data Table on Media and entertainment - Year-over-year growth 2024-2029 (%)
      • 8.6 Healthcare and life sciences - Market size and forecast 2024-2029
        • Chart on Healthcare and life sciences - Market size and forecast 2024-2029 ($ million)
        • Data Table on Healthcare and life sciences - Market size and forecast 2024-2029 ($ million)
        • Chart on Healthcare and life sciences - Year-over-year growth 2024-2029 (%)
        • Data Table on Healthcare and life sciences - Year-over-year growth 2024-2029 (%)
      • 8.7 Others - Market size and forecast 2024-2029
        • Chart on Others - Market size and forecast 2024-2029 ($ million)
        • Data Table on Others - Market size and forecast 2024-2029 ($ million)
        • Chart on Others - Year-over-year growth 2024-2029 (%)
        • Data Table on Others - Year-over-year growth 2024-2029 (%)
      • 8.8 Market opportunity by End-user
        • Market opportunity by End-user ($ million)
        • Data Table on Market opportunity by End-user ($ million)

      9 Market Segmentation by Component

      • 9.1 Market segments
        • Chart on Component - Market share 2024-2029 (%)
        • Data Table on Component - Market share 2024-2029 (%)
      • 9.2 Comparison by Component
        • Chart on Comparison by Component
        • Data Table on Comparison by Component
      • 9.3 Platform - Market size and forecast 2024-2029
        • Chart on Platform - Market size and forecast 2024-2029 ($ million)
        • Data Table on Platform - Market size and forecast 2024-2029 ($ million)
        • Chart on Platform - Year-over-year growth 2024-2029 (%)
        • Data Table on Platform - Year-over-year growth 2024-2029 (%)
      • 9.4 Services - Market size and forecast 2024-2029
        • Chart on Services - Market size and forecast 2024-2029 ($ million)
        • Data Table on Services - Market size and forecast 2024-2029 ($ million)
        • Chart on Services - Year-over-year growth 2024-2029 (%)
        • Data Table on Services - Year-over-year growth 2024-2029 (%)
      • 9.5 Market opportunity by Component
        • Market opportunity by Component ($ million)
        • Data Table on Market opportunity by Component ($ million)

      10 Market Segmentation by Deployment

      • 10.1 Market segments
        • Chart on Deployment - Market share 2024-2029 (%)
        • Data Table on Deployment - Market share 2024-2029 (%)
      • 10.2 Comparison by Deployment
        • Chart on Comparison by Deployment
        • Data Table on Comparison by Deployment
      • 10.3 Cloud-based - Market size and forecast 2024-2029
        • Chart on Cloud-based - Market size and forecast 2024-2029 ($ million)
        • Data Table on Cloud-based - Market size and forecast 2024-2029 ($ million)
        • Chart on Cloud-based - Year-over-year growth 2024-2029 (%)
        • Data Table on Cloud-based - Year-over-year growth 2024-2029 (%)
      • 10.4 On-premises - Market size and forecast 2024-2029
        • Chart on On-premises - Market size and forecast 2024-2029 ($ million)
        • Data Table on On-premises - Market size and forecast 2024-2029 ($ million)
        • Chart on On-premises - Year-over-year growth 2024-2029 (%)
        • Data Table on On-premises - Year-over-year growth 2024-2029 (%)
      • 10.5 Market opportunity by Deployment
        • Market opportunity by Deployment ($ million)
        • Data Table on Market opportunity by Deployment ($ million)

      11 Customer Landscape

      • 11.1 Customer landscape overview
        • Analysis of price sensitivity, lifecycle, customer purchase basket, adoption rates, and purchase criteria

      12 Geographic Landscape

      • 12.1 Geographic segmentation
        • Chart on Market share by geography 2024-2029 (%)
        • Data Table on Market share by geography 2024-2029 (%)
      • 12.2 Geographic comparison
        • Chart on Geographic comparison
        • Data Table on Geographic comparison
      • 12.3 North America - Market size and forecast 2024-2029
        • Chart on North America - Market size and forecast 2024-2029 ($ million)
        • Data Table on North America - Market size and forecast 2024-2029 ($ million)
        • Chart on North America - Year-over-year growth 2024-2029 (%)
        • Data Table on North America - Year-over-year growth 2024-2029 (%)
      • 12.4 Europe - Market size and forecast 2024-2029
        • Chart on Europe - Market size and forecast 2024-2029 ($ million)
        • Data Table on Europe - Market size and forecast 2024-2029 ($ million)
        • Chart on Europe - Year-over-year growth 2024-2029 (%)
        • Data Table on Europe - Year-over-year growth 2024-2029 (%)
      • 12.5 APAC - Market size and forecast 2024-2029
        • Chart on APAC - Market size and forecast 2024-2029 ($ million)
        • Data Table on APAC - Market size and forecast 2024-2029 ($ million)
        • Chart on APAC - Year-over-year growth 2024-2029 (%)
        • Data Table on APAC - Year-over-year growth 2024-2029 (%)
      • 12.6 Middle East and Africa - Market size and forecast 2024-2029
        • Chart on Middle East and Africa - Market size and forecast 2024-2029 ($ million)
        • Data Table on Middle East and Africa - Market size and forecast 2024-2029 ($ million)
        • Chart on Middle East and Africa - Year-over-year growth 2024-2029 (%)
        • Data Table on Middle East and Africa - Year-over-year growth 2024-2029 (%)
      • 12.7 South America - Market size and forecast 2024-2029
        • Chart on South America - Market size and forecast 2024-2029 ($ million)
        • Data Table on South America - Market size and forecast 2024-2029 ($ million)
        • Chart on South America - Year-over-year growth 2024-2029 (%)
        • Data Table on South America - Year-over-year growth 2024-2029 (%)
      • 12.8 US - Market size and forecast 2024-2029
        • Chart on US - Market size and forecast 2024-2029 ($ million)
        • Data Table on US - Market size and forecast 2024-2029 ($ million)
        • Chart on US - Year-over-year growth 2024-2029 (%)
        • Data Table on US - Year-over-year growth 2024-2029 (%)
      • 12.9 China - Market size and forecast 2024-2029
        • Chart on China - Market size and forecast 2024-2029 ($ million)
        • Data Table on China - Market size and forecast 2024-2029 ($ million)
        • Chart on China - Year-over-year growth 2024-2029 (%)
        • Data Table on China - Year-over-year growth 2024-2029 (%)
      • 12.10 UK - Market size and forecast 2024-2029
        • Chart on UK - Market size and forecast 2024-2029 ($ million)
        • Data Table on UK - Market size and forecast 2024-2029 ($ million)
        • Chart on UK - Year-over-year growth 2024-2029 (%)
        • Data Table on UK - Year-over-year growth 2024-2029 (%)
      • 12.11 Germany - Market size and forecast 2024-2029
        • Chart on Germany - Market size and forecast 2024-2029 ($ million)
        • Data Table on Germany - Market size and forecast 2024-2029 ($ million)
        • Chart on Germany - Year-over-year growth 2024-2029 (%)
        • Data Table on Germany - Year-over-year growth 2024-2029 (%)
      • 12.12 Japan - Market size and forecast 2024-2029
        • Chart on Japan - Market size and forecast 2024-2029 ($ million)
        • Data Table on Japan - Market size and forecast 2024-2029 ($ million)
        • Chart on Japan - Year-over-year growth 2024-2029 (%)
        • Data Table on Japan - Year-over-year growth 2024-2029 (%)
      • 12.13 France - Market size and forecast 2024-2029
        • Chart on France - Market size and forecast 2024-2029 ($ million)
        • Data Table on France - Market size and forecast 2024-2029 ($ million)
        • Chart on France - Year-over-year growth 2024-2029 (%)
        • Data Table on France - Year-over-year growth 2024-2029 (%)
      • 12.14 Brazil - Market size and forecast 2024-2029
        • Chart on Brazil - Market size and forecast 2024-2029 ($ million)
        • Data Table on Brazil - Market size and forecast 2024-2029 ($ million)
        • Chart on Brazil - Year-over-year growth 2024-2029 (%)
        • Data Table on Brazil - Year-over-year growth 2024-2029 (%)
      • 12.15 India - Market size and forecast 2024-2029
        • Chart on India - Market size and forecast 2024-2029 ($ million)
        • Data Table on India - Market size and forecast 2024-2029 ($ million)
        • Chart on India - Year-over-year growth 2024-2029 (%)
        • Data Table on India - Year-over-year growth 2024-2029 (%)
      • 12.16 Italy - Market size and forecast 2024-2029
        • Chart on Italy - Market size and forecast 2024-2029 ($ million)
        • Data Table on Italy - Market size and forecast 2024-2029 ($ million)
        • Chart on Italy - Year-over-year growth 2024-2029 (%)
        • Data Table on Italy - Year-over-year growth 2024-2029 (%)
      • 12.17 South Korea - Market size and forecast 2024-2029
        • Chart on South Korea - Market size and forecast 2024-2029 ($ million)
        • Data Table on South Korea - Market size and forecast 2024-2029 ($ million)
        • Chart on South Korea - Year-over-year growth 2024-2029 (%)
        • Data Table on South Korea - Year-over-year growth 2024-2029 (%)
      • 12.18 Market opportunity by geography
        • Market opportunity by geography ($ million)
        • Data Tables on Market opportunity by geography ($ million)

      13 Drivers, Challenges, and Opportunity/Restraints

      • 13.1 Market drivers
        • 13.2 Market challenges
          • 13.3 Impact of drivers and challenges
            • Impact of drivers and challenges in 2024 and 2029
          • 13.4 Market opportunities/restraints

            14 Competitive Landscape

            • 14.1 Overview
              • 14.2 Competitive Landscape
                • Overview on criticality of inputs and factors of differentiation
              • 14.3 Landscape disruption
                • Overview on factors of disruption
              • 14.4 Industry risks
                • Impact of key risks on business

              15 Competitive Analysis

              • 15.1 Companies profiled
                • Companies covered
              • 15.2 Company ranking index
                • Company ranking index
              • 15.3 Market positioning of companies
                • Matrix on companies position and classification
              • 15.4 Bigtincan Holdings Ltd.
                • Bigtincan Holdings Ltd. - Overview
                • Bigtincan Holdings Ltd. - Product / Service
                • Bigtincan Holdings Ltd. - Key offerings
                • SWOT
              • 15.5 ClientPoint Inc.
                • ClientPoint Inc. - Overview
                • ClientPoint Inc. - Product / Service
                • ClientPoint Inc. - Key offerings
                • SWOT
              • 15.6 Dropbox Inc.
                • Dropbox Inc. - Overview
                • Dropbox Inc. - Product / Service
                • Dropbox Inc. - Key offerings
                • SWOT
              • 15.7 GetAccept Inc.
                • GetAccept Inc. - Overview
                • GetAccept Inc. - Product / Service
                • GetAccept Inc. - Key offerings
                • SWOT
              • 15.8 Highspot Inc.
                • Highspot Inc. - Overview
                • Highspot Inc. - Product / Service
                • Highspot Inc. - Key offerings
                • SWOT
              • 15.9 Mediafly Inc.
                • Mediafly Inc. - Overview
                • Mediafly Inc. - Product / Service
                • Mediafly Inc. - Key offerings
                • SWOT
              • 15.10 Mindtickle Inc.
                • Mindtickle Inc. - Overview
                • Mindtickle Inc. - Product / Service
                • Mindtickle Inc. - Key offerings
                • SWOT
              • 15.11 Pitcher AG
                • Pitcher AG - Overview
                • Pitcher AG - Product / Service
                • Pitcher AG - Key offerings
                • SWOT
              • 15.12 QorusDocs Ltd.
                • QorusDocs Ltd. - Overview
                • QorusDocs Ltd. - Product / Service
                • QorusDocs Ltd. - Key offerings
                • SWOT
              • 15.13 Quark Software Inc.
                • Quark Software Inc. - Overview
                • Quark Software Inc. - Product / Service
                • Quark Software Inc. - Key offerings
                • SWOT
              • 15.14 Rallyware Inc.
                • Rallyware Inc. - Overview
                • Rallyware Inc. - Product / Service
                • Rallyware Inc. - Key offerings
                • SWOT
              • 15.15 Salesforce Inc.
                • Salesforce Inc. - Overview
                • Salesforce Inc. - Product / Service
                • Salesforce Inc. - Key news
                • Salesforce Inc. - Key offerings
                • SWOT
              • 15.16 Seismic Software Inc.
                • Seismic Software Inc. - Overview
                • Seismic Software Inc. - Product / Service
                • Seismic Software Inc. - Key offerings
                • SWOT
              • 15.17 Showpad Inc.
                • Showpad Inc. - Overview
                • Showpad Inc. - Product / Service
                • Showpad Inc. - Key offerings
                • SWOT
              • 15.18 Upland Software Inc.
                • Upland Software Inc. - Overview
                • Upland Software Inc. - Product / Service
                • Upland Software Inc. - Key offerings
                • SWOT

              16 Appendix

              • 16.1 Scope of the report
                • 16.2 Inclusions and exclusions checklist
                  • Inclusions checklist
                  • Exclusions checklist
                • 16.3 Currency conversion rates for US$
                  • Currency conversion rates for US$
                • 16.4 Research methodology
                  • Research methodology
                • 16.5 Data procurement
                  • Information sources
                • 16.6 Data validation
                  • Data validation
                • 16.7 Validation techniques employed for market sizing
                  • Validation techniques employed for market sizing
                • 16.8 Data synthesis
                  • Data synthesis
                • 16.9 360 degree market analysis
                  • 360 degree market analysis
                • 16.10 List of abbreviations
                  • List of abbreviations

                Research Methodology

                Technavio presents a detailed picture of the market by way of study, synthesis, and summation of data from multiple sources. The analysts have presented the various facets of the market with a particular focus on identifying the key industry influencers. The data thus presented is comprehensive, reliable, and the result of extensive research, both primary and secondary.

                INFORMATION SOURCES

                Primary sources

                • Manufacturers and suppliers
                • Channel partners
                • Industry experts
                • Strategic decision makers

                Secondary sources

                • Industry journals and periodicals
                • Government data
                • Financial reports of key industry players
                • Historical data
                • Press releases

                DATA ANALYSIS

                Data Synthesis

                • Collation of data
                • Estimation of key figures
                • Analysis of derived insights

                Data Validation

                • Triangulation with data models
                • Reference against proprietary databases
                • Corroboration with industry experts

                REPORT WRITING

                Qualitative

                • Market drivers
                • Market challenges
                • Market trends
                • Five forces analysis

                Quantitative

                • Market size and forecast
                • Market segmentation
                • Geographical insights
                • Competitive landscape

                Interested in this report?

                Get your sample now to see our research methodology and insights!

                Download Now

                Frequently Asked Questions

                Sales Enablement Platform market growth will increase by $ 6430.9 mn during 2025-2029 .

                The Sales Enablement Platform market is expected to grow at a CAGR of 17.1% during 2025-2029 .

                Sales Enablement Platform market is segmented by End-user( Consumer goods and retail, IT and telecom, Media and entertainment, Healthcare and life sciences, Others) Component( Platform, Services) Deployment( Cloud-based, On-premises, APAC, Middle East and Africa, South America)

                Bigtincan Holdings Ltd., ClientPoint Inc., Dropbox Inc., GetAccept Inc., Gong.io Inc., Highspot Inc., Mediafly Inc., Mindtickle Inc., PAPERFLITE, Pitcher AG, QorusDocs Ltd., Qstream Inc., Quark Software Inc., Rallyware Inc., Salesforce Inc., Seismic Software Inc., Showpad Inc., Upland Software Inc. are a few of the key vendors in the Sales Enablement Platform market.

                APAC will register the highest growth rate of 28% among the other regions. Therefore, the Sales Enablement Platform market in APAC is expected to garner significant business opportunities for the vendors during the forecast period.

                US, China, UK, Germany, France, Japan, Brazil, Italy, India, South Korea

                • Rising technological innovationIn 2024 is the driving factor this market.
                • sales enablement platforms have evolved significantly to meet the growing demands of businesses striving for efficiency and customer engagement. With increasing competition is the driving factor this market.
                • consulting firms and enterprises are leveraging advanced technologies to optimize their marketing strategies and operations. These platforms now integrate AI-driven analytics is the driving factor this market.
                • enabling businesses to make data-backed decisions and refine their marketing investments. AI adoption has become a key trend is the driving factor this market.
                • helping organizations predict customer behaviors is the driving factor this market.
                • personalize interactions is the driving factor this market.
                • and automate sales processes.Businesses recognize the importance of customer-centric digital experiences is the driving factor this market.
                • leading to a surge in investments in sales enablement tools. These platforms facilitate seamless collaboration between marketing and sales teams is the driving factor this market.
                • ensuring that content is relevant is the driving factor this market.
                • timely is the driving factor this market.
                • and aligned with customer expectations. Additionally is the driving factor this market.
                • AI-powered chatbots and virtual assistants are enhancing customer engagement by providing real-time support and personalized recommendations.Another major shift in 2024 is the emphasis on advanced personalization in sales processes. Companies are utilizing AI-driven personalization engines to tailor content and recommendations based on customer data is the driving factor this market.
                • improving conversion rates and customer satisfaction. The integration of sales automation platforms has streamlined workflows is the driving factor this market.
                • reducing manual efforts and enhancing efficiency.As customers continue to rely on online research before making purchase decisions is the driving factor this market.
                • businesses are focusing on delivering high-quality is the driving factor this market.
                • data-driven content that educates and informs their target audience. Sales enablement platforms play a crucial role in ensuring that organizations provide a sophisticated digital experience is the driving factor this market.
                • fostering customer loyalty and driving business growth.These advancements highlight the growing importance of AI is the driving factor this market.
                • automation is the driving factor this market.
                • and personalization in modern sales enablement strategies is the driving factor this market.
                • helping businesses stay competitive in an ever-evolving market landscape. Thus is the driving factor this market.
                • these reasons are expected to increase the demand for sales enablement platforms is the driving factor this market.
                • which will propel the growth of the global sales enablement platform market during the forecast period. is the driving factor this market.

                The Sales Enablement Platform market vendors should focus on grabbing business opportunities from the Consumer goods and retail segment as it accounted for the largest market share in the base year.