Scientific Instrument Market Analysis North America, Europe, Asia, Rest of World (ROW) - US, China, Germany, UK, India - Size and Forecast 2024-2028

Scientific Instrument Market Analysis North America, Europe, Asia, Rest of World (ROW) - US, China, Germany, UK, India - Size and Forecast 2024-2028

Published: Jul 2024 182 Pages SKU: IRTNTR44883

Market Overview at a Glance

$19.97 B
Market Opportunity
5.45%
CAGR
4.77
YoY growth 2023-2024(%)

Scientific Instrument Market Size 2024-2028 

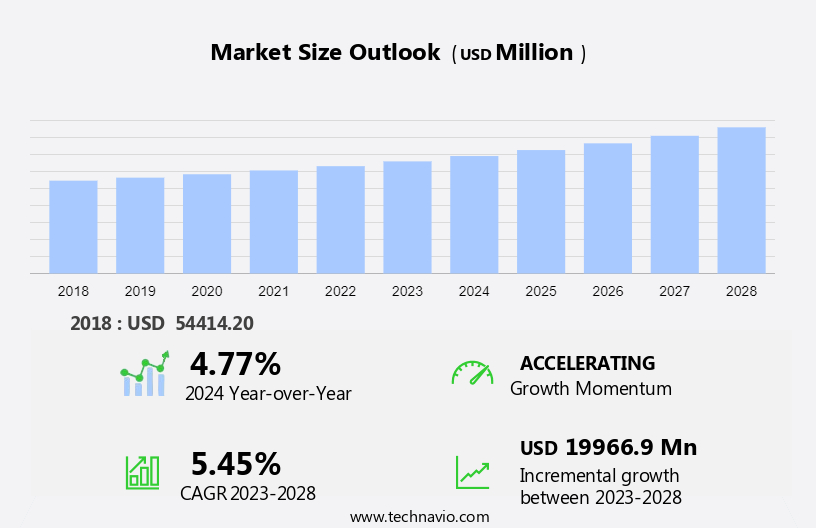
The scientific instrument market size is forecast to increase by USD 19.97 billion at a CAGR of 5.45% between 2023 and 2028. The market is witnessing significant growth due to several key drivers. One of the primary factors is the increasing investment in the pharmaceutical sector for drug discovery and development. Additionally, the growing adoption of portable scientific instruments in various settings, including hospitals and diagnostic laboratories, is fueling market expansion. However, the lack of adequately trained professionals poses a challenge to the market's growth. Moreover, the public health emergency caused by chronic conditions such as diabetes, respiratory diseases, cardiovascular diseases, and neurological diseases is driving the demand for advanced scientific instruments in healthcare settings. The research segment is also experiencing significant growth due to the increasing focus on developing new therapeutics and treatments for various diseases, particularly in areas like sample preparation and genomics. Laboratory automation is another trend gaining traction in the market due to its ability to increase efficiency and reduce errors in scientific research, genomic studies, and diagnostic proce The market is poised for growth due to the increasing investment in drug discovery, the adoption of portable instruments, and the growing demand for advanced instruments in healthcare and research settings. However, the lack of trained professionals remains a significant challenge that needs to be addressed to fully capitalize on the market opportunities.

What will be the Size of the Market During the Forecast Period?

Scientific Instrument Market Size

 Request Free Sample

The market encompasses a wide range of tools utilized in various sectors for measuring, analyzing, verifying, and understanding physical quantities. These instruments play a crucial role in research institutions, laboratories, government agencies, and the pharmaceutical industry, among others. Instruments such as microscopes, spectrometers, x-ray diffraction systems, and thermal analyzers are integral components of scientific research. They facilitate the investigation of various phenomena, from microscopic structures to complex chemical reactions. Laboratories, including those in universities, research institutions, hospitals, and government agencies, are significant consumers of scientific instruments. These facilities rely on advanced, often automated, solutions to ensure accurate data analysis and maintain high standards of research and development.

Moreover, portable and handheld instruments have gained popularity in recent years due to their convenience and versatility. They enable field research, making it possible to collect data in real-time and in various environments. These instruments have proven particularly valuable in sectors like drug safety, public health emergencies, and clinical analyzers. The market caters to diverse industries, including pharmaceuticals, where precise measurements are essential for ensuring product quality and safety. In the context of a public health emergency, these instruments can be invaluable in diagnosing and understanding the nature of the crisis. Data analysis is a critical aspect of scientific research, and scientific instruments play a pivotal role in this process.

Market Segmentation

The market research report provides comprehensive data (region-wise segment analysis), with forecasts and estimates in "USD billion" for the period 2024-2028, as well as historical data from 2018-2022 for the following segments.

  • Product
    • Laboratory analytical instruments and consumables
    • Measuring and monitoring devices
  • End-user
    • Pharmaceutical and biotechnology companies
    • Hospitals and diagnostic laboratories
    • Others
  • Geography
    • North America
      • US
    • Europe
      • Germany
      • UK
    • Asia
      • China
      • India
    • Rest of World (ROW)

By Product Insights

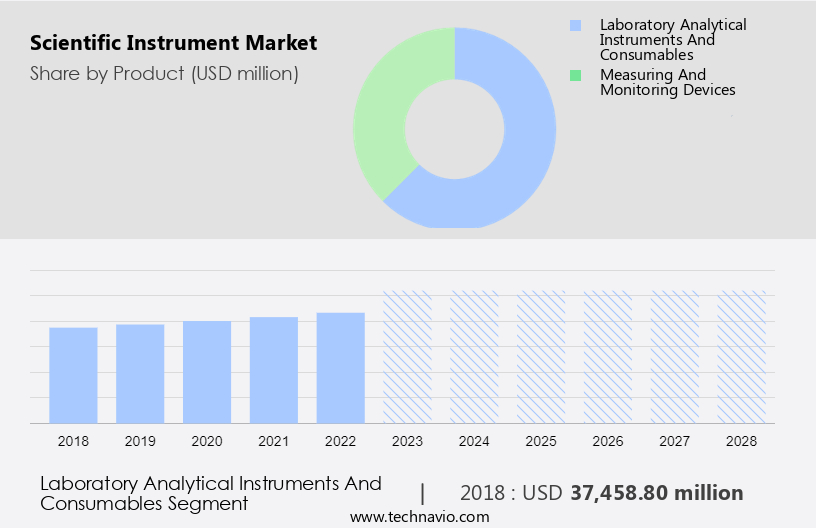
The laboratory analytical instruments and consumables segment is estimated to witness significant growth during the forecast period. The market encompasses a range of laboratory analytical tools and consumables, such as mass spectrometers, chromatographs, and electron microscopes, which are essential for Environmental Science research in various fields, including metabolomics, genomics, and proteomics. These instruments facilitate the identification and analysis of specific substances using techniques like spectroscopy, mass spectrometry, electrochemical analysis, thermal analysis, separation analysis, and microscopy. Raman spectroscopy, specifically, has gained significant attention in the pharmaceutical industry due to its ability to reveal the chemical structure, concentration, and behavior of molecules in various forms, including solids, liquids, gels, gases, slurries, and powders.

Furthermore, in this sector, Raman spectroscopy plays a crucial role in drug development by determining the structural composition of therapeutic drug agents, defining the structural properties of dynamic molecules, and characterizing intermolecular interactions for drug discovery. Post-approval, Raman spectroscopy is employed to ensure the manufactured drug consists of the intended compound and to detect any potentially harmful substances from packaging that may contaminate the drug. This non-destructive technique offers numerous advantages, such as high sensitivity, rapid analysis, and minimal sample preparation, making it an indispensable tool in the pharmaceutical industry.

Scientific Instrument Market Size

Get a glance at the market share of various segments Request Free Sample

The laboratory analytical instruments and consumables segment was valued at USD 37.46 billion in 2018 and showed a gradual increase during the forecast period.

Regional Insights

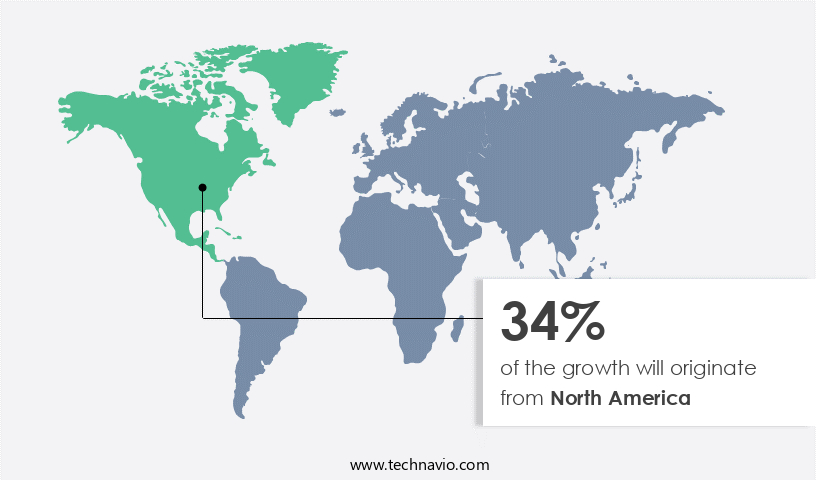
North America is estimated to contribute 34% to the growth of the global market during the forecast period. Technavio's analysts have elaborately explained the regional trends and drivers that shape the market during the forecast period.

Scientific Instrument Market Share by Geography

For more insights on the market share of various regions Request Free Sample

In North America, the market for scientific instruments experiences significant growth due to substantial investments in healthcare research and testing, particularly in the United States. The region's well-established distribution networks for scientific instruments in countries like the US and Canada contribute to market expansion. Furthermore, pharmaceutical companies' heightened focus on drug discovery and development drives the market's growth in North America. Notably, countries in the region have increased their healthcare funding activities, further boosting the demand for scientific instruments. Advanced technologies, such as avionics and environmental monitoring, are essential components of the market in North America. These instruments find extensive applications in various industries, including healthcare, food and beverage, and environmental monitoring.

Specifically, in healthcare, scientific clinical analyzers, chromatographs, and particle analyzers are widely used for analyzing biological samples like blood, urine, and tissue. These instruments aid in determining critical health indicators, such as glucose levels and cholesterol levels, as well as blood cell counts. The market for these instruments is expected to continue growing in the forecast period due to the increasing demand for accurate and efficient diagnostic tools.

Our researchers analyzed the data with 2023 as the base year, along with the key drivers, trends, and challenges. A holistic analysis of drivers will help companies refine their marketing strategies to gain a competitive advantage.

Market Driver

Increasing investments in drug discovery is the key driver of the market. In the realm of pharmaceutical and biotech research, the identification of new drugs to combat chronic diseases and personalized medicine is a priority. This focus has led to a significant increase in research and development (R&D) investments. Consequently, the demand for scientific instruments is on the rise, particularly during the initial stages of drug discovery. These instruments facilitate the screening of various compounds, enhancing efficiency, consistency, and precision. Protein targets are crucial in drug discovery, and techniques such as protein crystallization and crystallography are employed to identify them. By determining the structural components of a protein that can be manipulated to suppress or amplify a specific therapeutic function, these methods contribute significantly to the drug discovery process.

Clinical laboratories, medical diagnosis, cancer research, and theoretical research all rely on scientific instruments for measuring, analyzing, and verifying physical quantities. These instruments play a pivotal role in the diagnosis and treatment planning of various diseases, including infectious diseases and cancer. In the biotech and pharmaceutical industries, scientific instruments are indispensable tools for advancing research and development.

Market Trends

The growing adoption of portable scientific instruments is the upcoming trend in the market. The market has witnessed a significant trend towards the development of compact and portable devices to cater to the space constraints in laboratories, particularly for outpatient and inpatient facilities. This demand has driven companies to innovate and redesign their traditional scientific equipment using advanced miniaturization technologies such as fluidics and integrated printed circuit boards (PCBs). Conventional scientific instruments, including laboratory centrifuges, often have wires and components located at the bottom and rear, making them bulky and inefficient.

However, the integration of circuit-based and fluidics-based miniaturization technologies has enabled the elimination of complex wires, pumps, and valves in miniaturized equipment, leading to more compact designs. The use of these technologies not only saves space but also streamlines laboratory workflows, making scientific research more efficient. From a business perspective, this trend presents an opportunity for companies to differentiate themselves in the market and cater to the evolving needs of healthcare and research institutions.

Market Challenge

Lack of trained professionals is a key challenge affecting the market growth. In the dynamic landscape of scientific instruments, advancements are continually reshaping the industry. For industries such as pharmaceuticals and healthcare, staying current with these technological innovations is crucial. However, keeping up with these changes can be challenging for end-users due to the complex nature of scientific instruments and the high cost of acquiring and training a skilled workforce. Clinical analyzers, a significant segment of scientific instruments, are extensively used in hospitals and diagnostic laboratories to diagnose and monitor chronic conditions like diabetes, respiratory diseases, cardiovascular diseases, and neurological diseases. Proper calibration of these instruments is essential to ensure their accuracy and reliability in delivering results.

The research segment, which includes the development of new therapeutics, also relies heavily on scientific instruments for research and development. The use of laboratory automation has become increasingly popular to streamline processes and improve efficiency. Calibration of scientific instruments is a specialized skill that requires technical expertise. Outsourcing this function to third-party providers can help ensure that instruments are calibrated correctly and maintain their accuracy. This approach can save time and resources for end-users, allowing them to focus on their core business functions. In conclusion, scientific instruments play a vital role in the healthcare industry, particularly in the diagnosis and monitoring of chronic conditions.

Exclusive Customer Landscape

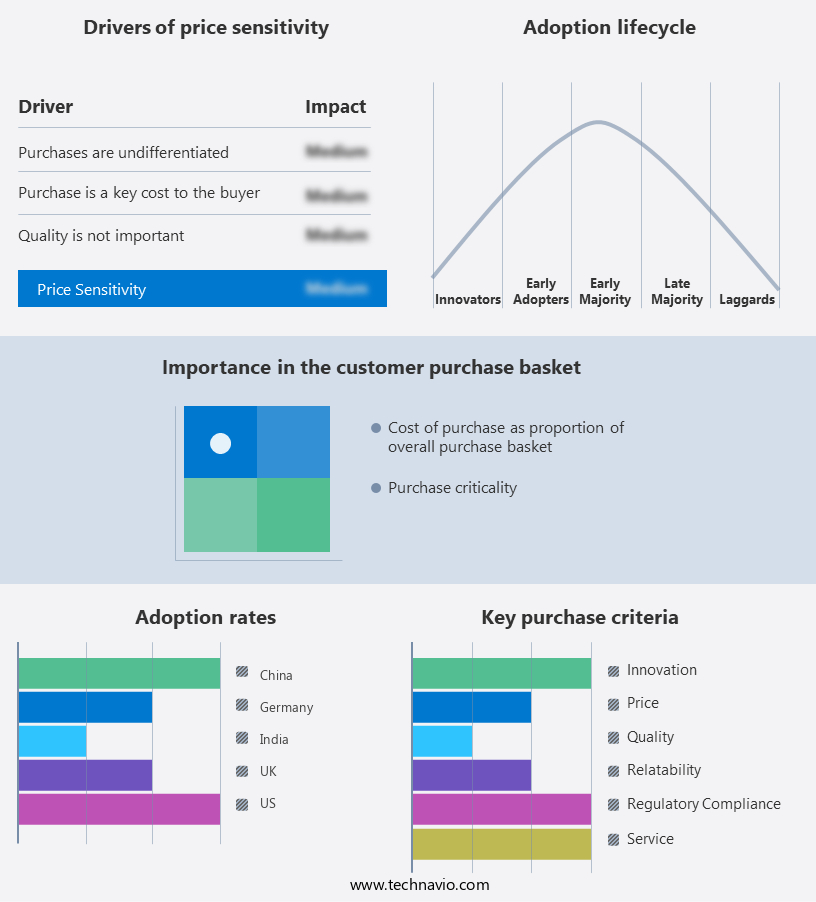
The market forecasting report includes the adoption lifecycle of the market, covering from the innovator's stage to the laggard's stage. It focuses on adoption rates in different regions based on penetration. Furthermore, the report also includes key purchase criteria and drivers of price sensitivity to help companies evaluate and develop their market growth analysis strategies.

Scientific Instrument Market Share by Geography

 Customer Landscape

Key Companies & Market Insights

Companies are implementing various strategies, such as strategic alliances, partnerships, mergers and acquisitions, geographical expansion, and product/service launches, to enhance their presence in the market.

ABB Ltd. - The company offers a wide range of scientific instruments. Under the electrification segment, the company offers solutions across the full electrical value chain from the substation to the point of consumption.

The market research and growth report includes detailed analyses of the competitive landscape of the market and information about key companies, including:

  • ACMAS Technologies Pvt. Ltd.
  • Agilent Technologies Inc.
  • Alcon Scientific
  • Bio Rad Laboratories Inc.
  • Bruker Corp.
  • Carl Zeiss AG
  • Danaher Corp.
  • Hitachi Ltd.
  • HORIBA Ltd.
  • Labappara
  • M.K.Scientific Instruments
  • MAC
  • Merck KGaA
  • Oxford Instruments plc
  • Shimadzu Corp.
  • SM Scientific Instruments Pvt. Ltd.
  • Thermo Fisher Scientific Inc.
  • Thorlabs Inc.
  • Waters Corp.

Qualitative and quantitative analysis of companies has been conducted to help clients understand the wider business environment as well as the strengths and weaknesses of key market players. Data is qualitatively analyzed to categorize companies as pure play, category-focused, industry-focused, and diversified; it is quantitatively analyzed to categorize companies as dominant, leading, strong, tentative, and weak.

Research Analyst Overview

The market encompasses a wide range of tools utilized in various industries for measuring, analyzing, and verifying physical quantities. These instruments play a crucial role in sectors such as biotechnology, materials science, environmental science, and healthcare companies. Products include microscopes like electron and DNA sequencers, spectrometer systems, mass spectrometers, particle accelerators, and molecular analyzers. Biomarker detection systems, drug development, and precision medicine are significant applications. Pharmaceutical companies, academic institutions, private organizations, and startups are key buyers. Portable and handheld instruments facilitate field research and biotechnology research.

Further, applications span from chronic diseases like diabetes and its complications, infectious diseases, and cancer to aerospace engineering, celestial bodies exploration, and avionics technology. Environmental monitoring, quality control, and laboratory automation are other essential areas. Scientific clinical analyzers process biological samples such as blood, urine, and tissue for medical diagnosis and treatment planning. Instruments are used in pharmaceutical sectors, public health emergencies, hospitals, and diagnostic laboratories. The research segment focuses on developing automated solutions for data analysis and improving instruments for therapeutics, outpatients, and inpatients.

Market Scope

Report Coverage

Details

Page number

182

Base year

2023

Historic period

2018-2022

Forecast period

2024-2028

Growth momentum & CAGR

Accelerate at a CAGR of 5.45%

Market Growth 2024-2028

USD 19.97 billion

Market structure

Fragmented

YoY growth 2023-2024(%)

4.77

Regional analysis

North America, Europe, Asia, and Rest of World (ROW)

Performing market contribution

North America at 34%

Key countries

US, China, Germany, UK, and India

Competitive landscape

Leading Companies, Market Positioning of Companies, Competitive Strategies, and Industry Risks

Key companies profiled

ABB Ltd., ACMAS Technologies Pvt. Ltd., Agilent Technologies Inc., Alcon Scientific, Bio Rad Laboratories Inc., Bruker Corp., Carl Zeiss AG, Danaher Corp., Hitachi Ltd., HORIBA Ltd., Labappara, M.K.Scientific Instruments, MAC, Merck KGaA, Oxford Instruments plc, Shimadzu Corp., SM Scientific Instruments Pvt. Ltd., Thermo Fisher Scientific Inc., Thorlabs Inc., and Waters Corp.

Market dynamics

Parent market analysis, market growth inducers and obstacles, market forecast, fast-growing and slow-growing segment analysis, COVID-19 impact and recovery analysis and future consumer dynamics, market condition analysis for the forecast period

Customization purview

If our market report has not included the data that you are looking for, you can reach out to our analysts and get segments customized.

Request Free Sample

What are the Key Data Covered in this Market Research and Growth Report?

  • CAGR of the market during the forecast period
  • Detailed information on factors that will drive the market growth and forecasting between 2024 and 2028
  • Precise estimation of the size of the market  and its contribution of the market in focus to the parent market
  • Accurate predictions about upcoming market growth and trends and changes in consumer behaviour
  • Growth of the market across North America, Europe, Asia, and Rest of World (ROW)
  • Thorough analysis of the market's competitive landscape and detailed information about companies
  • Comprehensive analysis of factors that will challenge the growth of market companies

We can help! Our analysts can customize this market research report to meet your requirements. Get in touch

1 Executive Summary

  • 1.1 Market overview
    • Executive Summary - Chart on Market Overview
    • Executive Summary - Data Table on Market Overview
    • Executive Summary - Chart on Global Market Characteristics
    • Executive Summary - Chart on Market by Geography
    • Executive Summary - Chart on Market Segmentation by Product
    • Executive Summary - Chart on Market Segmentation by End-user
    • Executive Summary - Chart on Incremental Growth
    • Executive Summary - Data Table on Incremental Growth
    • Executive Summary - Chart on Company Market Positioning

2 Market Landscape

  • 2.1 Market ecosystem
    • Parent Market
    • Data Table on - Parent Market
  • 2.2 Market characteristics
    • Market characteristics analysis
  • 2.3 Value chain analysis
    • Value Chain Analysis

3 Market Sizing

  • 3.1 Market definition
    • Offerings of companies included in the market definition
  • 3.2 Market segment analysis
    • Market segments
  • 3.3 Market size 2023
    • 3.4 Market outlook: Forecast for 2023-2028
      • Chart on Global - Market size and forecast 2023-2028 ($ million)
      • Data Table on Global - Market size and forecast 2023-2028 ($ million)
      • Chart on Global Market: Year-over-year growth 2023-2028 (%)
      • Data Table on Global Market: Year-over-year growth 2023-2028 (%)

    4 Historic Market Size

    • 4.1 Global Scientific Instrument Market 2018 - 2022
      • Historic Market Size - Data Table on Global Scientific Instrument Market 2018 - 2022 ($ million)
    • 4.2 Product segment analysis 2018 - 2022
      • Historic Market Size - Product Segment 2018 - 2022 ($ million)
    • 4.3 End-user segment analysis 2018 - 2022
      • Historic Market Size - End-user Segment 2018 - 2022 ($ million)
    • 4.4 Geography segment analysis 2018 - 2022
      • Historic Market Size - Geography Segment 2018 - 2022 ($ million)
    • 4.5 Country segment analysis 2018 - 2022
      • Historic Market Size - Country Segment 2018 - 2022 ($ million)

    5 Five Forces Analysis

    • 5.1 Five forces summary
      • Five forces analysis - Comparison between 2023 and 2028
    • 5.2 Bargaining power of buyers
      • Bargaining power of buyers - Impact of key factors 2023 and 2028
    • 5.3 Bargaining power of suppliers
      • Bargaining power of suppliers - Impact of key factors in 2023 and 2028
    • 5.4 Threat of new entrants
      • Threat of new entrants - Impact of key factors in 2023 and 2028
    • 5.5 Threat of substitutes
      • Threat of substitutes - Impact of key factors in 2023 and 2028
    • 5.6 Threat of rivalry
      • Threat of rivalry - Impact of key factors in 2023 and 2028
    • 5.7 Market condition
      • Chart on Market condition - Five forces 2023 and 2028

    6 Market Segmentation by Product

    • 6.1 Market segments
      • Chart on Product - Market share 2023-2028 (%)
      • Data Table on Product - Market share 2023-2028 (%)
    • 6.2 Comparison by Product
      • Chart on Comparison by Product
      • Data Table on Comparison by Product
    • 6.3 Laboratory analytical instruments and consumables - Market size and forecast 2023-2028
      • Chart on Laboratory analytical instruments and consumables - Market size and forecast 2023-2028 ($ million)
      • Data Table on Laboratory analytical instruments and consumables - Market size and forecast 2023-2028 ($ million)
      • Chart on Laboratory analytical instruments and consumables - Year-over-year growth 2023-2028 (%)
      • Data Table on Laboratory analytical instruments and consumables - Year-over-year growth 2023-2028 (%)
    • 6.4 Measuring and monitoring devices - Market size and forecast 2023-2028
      • Chart on Measuring and monitoring devices - Market size and forecast 2023-2028 ($ million)
      • Data Table on Measuring and monitoring devices - Market size and forecast 2023-2028 ($ million)
      • Chart on Measuring and monitoring devices - Year-over-year growth 2023-2028 (%)
      • Data Table on Measuring and monitoring devices - Year-over-year growth 2023-2028 (%)
    • 6.5 Market opportunity by Product
      • Market opportunity by Product ($ million)
      • Data Table on Market opportunity by Product ($ million)

    7 Market Segmentation by End-user

    • 7.1 Market segments
      • Chart on End-user - Market share 2023-2028 (%)
      • Data Table on End-user - Market share 2023-2028 (%)
    • 7.2 Comparison by End-user
      • Chart on Comparison by End-user
      • Data Table on Comparison by End-user
    • 7.3 Pharmaceutical and biotechnology companies - Market size and forecast 2023-2028
      • Chart on Pharmaceutical and biotechnology companies - Market size and forecast 2023-2028 ($ million)
      • Data Table on Pharmaceutical and biotechnology companies - Market size and forecast 2023-2028 ($ million)
      • Chart on Pharmaceutical and biotechnology companies - Year-over-year growth 2023-2028 (%)
      • Data Table on Pharmaceutical and biotechnology companies - Year-over-year growth 2023-2028 (%)
    • 7.4 Hospitals and diagnostic laboratories - Market size and forecast 2023-2028
      • Chart on Hospitals and diagnostic laboratories - Market size and forecast 2023-2028 ($ million)
      • Data Table on Hospitals and diagnostic laboratories - Market size and forecast 2023-2028 ($ million)
      • Chart on Hospitals and diagnostic laboratories - Year-over-year growth 2023-2028 (%)
      • Data Table on Hospitals and diagnostic laboratories - Year-over-year growth 2023-2028 (%)
    • 7.5 Others - Market size and forecast 2023-2028
      • Chart on Others - Market size and forecast 2023-2028 ($ million)
      • Data Table on Others - Market size and forecast 2023-2028 ($ million)
      • Chart on Others - Year-over-year growth 2023-2028 (%)
      • Data Table on Others - Year-over-year growth 2023-2028 (%)
    • 7.6 Market opportunity by End-user
      • Market opportunity by End-user ($ million)
      • Data Table on Market opportunity by End-user ($ million)

    8 Customer Landscape

    • 8.1 Customer landscape overview
      • Analysis of price sensitivity, lifecycle, customer purchase basket, adoption rates, and purchase criteria

    9 Geographic Landscape

    • 9.1 Geographic segmentation
      • Chart on Market share by geography 2023-2028 (%)
      • Data Table on Market share by geography 2023-2028 (%)
    • 9.2 Geographic comparison
      • Chart on Geographic comparison
      • Data Table on Geographic comparison
    • 9.3 North America - Market size and forecast 2023-2028
      • Chart on North America - Market size and forecast 2023-2028 ($ million)
      • Data Table on North America - Market size and forecast 2023-2028 ($ million)
      • Chart on North America - Year-over-year growth 2023-2028 (%)
      • Data Table on North America - Year-over-year growth 2023-2028 (%)
    • 9.4 Europe - Market size and forecast 2023-2028
      • Chart on Europe - Market size and forecast 2023-2028 ($ million)
      • Data Table on Europe - Market size and forecast 2023-2028 ($ million)
      • Chart on Europe - Year-over-year growth 2023-2028 (%)
      • Data Table on Europe - Year-over-year growth 2023-2028 (%)
    • 9.5 Asia - Market size and forecast 2023-2028
      • Chart on Asia - Market size and forecast 2023-2028 ($ million)
      • Data Table on Asia - Market size and forecast 2023-2028 ($ million)
      • Chart on Asia - Year-over-year growth 2023-2028 (%)
      • Data Table on Asia - Year-over-year growth 2023-2028 (%)
    • 9.6 Rest of World (ROW) - Market size and forecast 2023-2028
      • Chart on Rest of World (ROW) - Market size and forecast 2023-2028 ($ million)
      • Data Table on Rest of World (ROW) - Market size and forecast 2023-2028 ($ million)
      • Chart on Rest of World (ROW) - Year-over-year growth 2023-2028 (%)
      • Data Table on Rest of World (ROW) - Year-over-year growth 2023-2028 (%)
    • 9.7 US - Market size and forecast 2023-2028
      • Chart on US - Market size and forecast 2023-2028 ($ million)
      • Data Table on US - Market size and forecast 2023-2028 ($ million)
      • Chart on US - Year-over-year growth 2023-2028 (%)
      • Data Table on US - Year-over-year growth 2023-2028 (%)
    • 9.8 China - Market size and forecast 2023-2028
      • Chart on China - Market size and forecast 2023-2028 ($ million)
      • Data Table on China - Market size and forecast 2023-2028 ($ million)
      • Chart on China - Year-over-year growth 2023-2028 (%)
      • Data Table on China - Year-over-year growth 2023-2028 (%)
    • 9.9 Germany - Market size and forecast 2023-2028
      • Chart on Germany - Market size and forecast 2023-2028 ($ million)
      • Data Table on Germany - Market size and forecast 2023-2028 ($ million)
      • Chart on Germany - Year-over-year growth 2023-2028 (%)
      • Data Table on Germany - Year-over-year growth 2023-2028 (%)
    • 9.10 UK - Market size and forecast 2023-2028
      • Chart on UK - Market size and forecast 2023-2028 ($ million)
      • Data Table on UK - Market size and forecast 2023-2028 ($ million)
      • Chart on UK - Year-over-year growth 2023-2028 (%)
      • Data Table on UK - Year-over-year growth 2023-2028 (%)
    • 9.11 India - Market size and forecast 2023-2028
      • Chart on India - Market size and forecast 2023-2028 ($ million)
      • Data Table on India - Market size and forecast 2023-2028 ($ million)
      • Chart on India - Year-over-year growth 2023-2028 (%)
      • Data Table on India - Year-over-year growth 2023-2028 (%)
    • 9.12 Market opportunity by geography
      • Market opportunity by geography ($ million)
      • Data Tables on Market opportunity by geography ($ million)

    10 Drivers, Challenges, and Opportunity/Restraints

    • 10.1 Market drivers
      • 10.2 Market challenges
        • 10.3 Impact of drivers and challenges
          • Impact of drivers and challenges in 2023 and 2028
        • 10.4 Market opportunities/restraints

          11 Competitive Landscape

          • 11.1 Overview
            • 11.2 Competitive Landscape
              • Overview on criticality of inputs and factors of differentiation
            • 11.3 Landscape disruption
              • Overview on factors of disruption
            • 11.4 Industry risks
              • Impact of key risks on business

            12 Competitive Analysis

            • 12.1 Companies profiled
              • Companies covered
            • 12.2 Market positioning of companies
              • Matrix on companies position and classification
            • 12.3 ABB Ltd.
              • ABB Ltd. - Overview
              • ABB Ltd. - Business segments
              • ABB Ltd. - Key news
              • ABB Ltd. - Key offerings
              • ABB Ltd. - Segment focus
            • 12.4 Agilent Technologies Inc.
              • Agilent Technologies Inc. - Overview
              • Agilent Technologies Inc. - Business segments
              • Agilent Technologies Inc. - Key news
              • Agilent Technologies Inc. - Key offerings
              • Agilent Technologies Inc. - Segment focus
            • 12.5 Alcon Scientific
              • Alcon Scientific - Overview
              • Alcon Scientific - Product / Service
              • Alcon Scientific - Key offerings
            • 12.6 Bio Rad Laboratories Inc.
              • Bio Rad Laboratories Inc. - Overview
              • Bio Rad Laboratories Inc. - Business segments
              • Bio Rad Laboratories Inc. - Key news
              • Bio Rad Laboratories Inc. - Key offerings
              • Bio Rad Laboratories Inc. - Segment focus
            • 12.7 Bruker Corp.
              • Bruker Corp. - Overview
              • Bruker Corp. - Business segments
              • Bruker Corp. - Key news
              • Bruker Corp. - Key offerings
              • Bruker Corp. - Segment focus
            • 12.8 Carl Zeiss AG
              • Carl Zeiss AG - Overview
              • Carl Zeiss AG - Product / Service
              • Carl Zeiss AG - Key news
              • Carl Zeiss AG - Key offerings
            • 12.9 Danaher Corp.
              • Danaher Corp. - Overview
              • Danaher Corp. - Business segments
              • Danaher Corp. - Key news
              • Danaher Corp. - Key offerings
              • Danaher Corp. - Segment focus
            • 12.10 Hitachi Ltd.
              • Hitachi Ltd. - Overview
              • Hitachi Ltd. - Business segments
              • Hitachi Ltd. - Key news
              • Hitachi Ltd. - Key offerings
              • Hitachi Ltd. - Segment focus
            • 12.11 HORIBA Ltd.
              • HORIBA Ltd. - Overview
              • HORIBA Ltd. - Business segments
              • HORIBA Ltd. - Key news
              • HORIBA Ltd. - Key offerings
              • HORIBA Ltd. - Segment focus
            • 12.12 Labappara
              • Labappara - Overview
              • Labappara - Product / Service
              • Labappara - Key offerings
            • 12.13 Merck KGaA
              • Merck KGaA - Overview
              • Merck KGaA - Business segments
              • Merck KGaA - Key news
              • Merck KGaA - Key offerings
              • Merck KGaA - Segment focus
            • 12.14 Oxford Instruments plc
              • Oxford Instruments plc - Overview
              • Oxford Instruments plc - Business segments
              • Oxford Instruments plc - Key offerings
              • Oxford Instruments plc - Segment focus
            • 12.15 Shimadzu Corp.
              • Shimadzu Corp. - Overview
              • Shimadzu Corp. - Business segments
              • Shimadzu Corp. - Key news
              • Shimadzu Corp. - Key offerings
              • Shimadzu Corp. - Segment focus
            • 12.16 Thermo Fisher Scientific Inc.
              • Thermo Fisher Scientific Inc. - Overview
              • Thermo Fisher Scientific Inc. - Business segments
              • Thermo Fisher Scientific Inc. - Key news
              • Thermo Fisher Scientific Inc. - Key offerings
              • Thermo Fisher Scientific Inc. - Segment focus
            • 12.17 Waters Corp.
              • Waters Corp. - Overview
              • Waters Corp. - Business segments
              • Waters Corp. - Key news
              • Waters Corp. - Key offerings
              • Waters Corp. - Segment focus

            13 Appendix

            • 13.1 Scope of the report
              • 13.2 Inclusions and exclusions checklist
                • Inclusions checklist
                • Exclusions checklist
              • 13.3 Currency conversion rates for US$
                • Currency conversion rates for US$
              • 13.4 Research methodology
                • Research methodology
              • 13.5 Data procurement
                • Information sources
              • 13.6 Data validation
                • Data validation
              • 13.7 Validation techniques employed for market sizing
                • Validation techniques employed for market sizing
              • 13.8 Data synthesis
                • Data synthesis
              • 13.9 360 degree market analysis
                • 360 degree market analysis
              • 13.10 List of abbreviations
                • List of abbreviations

              Research Methodology

              Technavio presents a detailed picture of the market by way of study, synthesis, and summation of data from multiple sources. The analysts have presented the various facets of the market with a particular focus on identifying the key industry influencers. The data thus presented is comprehensive, reliable, and the result of extensive research, both primary and secondary.

              INFORMATION SOURCES

              Primary sources

              • Manufacturers and suppliers
              • Channel partners
              • Industry experts
              • Strategic decision makers

              Secondary sources

              • Industry journals and periodicals
              • Government data
              • Financial reports of key industry players
              • Historical data
              • Press releases

              DATA ANALYSIS

              Data Synthesis

              • Collation of data
              • Estimation of key figures
              • Analysis of derived insights

              Data Validation

              • Triangulation with data models
              • Reference against proprietary databases
              • Corroboration with industry experts

              REPORT WRITING

              Qualitative

              • Market drivers
              • Market challenges
              • Market trends
              • Five forces analysis

              Quantitative

              • Market size and forecast
              • Market segmentation
              • Geographical insights
              • Competitive landscape

              Interested in this report?

              Get your sample now to see our research methodology and insights!

              Download Now

              Frequently Asked Questions

              Scientific Instrument market growth will increase by $ 19966.9 mn during 2024-2028.

              The Scientific Instrument market is expected to grow at a CAGR of 5.45% during 2024-2028.

              Scientific Instrument market is segmented by Product( Laboratory analytical instruments and consumables, Measuring and monitoring devices) End-user( Pharmaceutical and biotechnology companies, Hospitals and diagnostic laboratories, Others, South America, MEA)

              ABB Ltd., ACMAS Technologies Pvt. Ltd., Agilent Technologies Inc., Alcon Scientific, Bio Rad Laboratories Inc., Bruker Corp., Carl Zeiss AG, Danaher Corp., Hitachi Ltd., HORIBA Ltd., Labappara, M.K.Scientific Instruments, MAC, Merck KGaA, Oxford Instruments plc, Shimadzu Corp., SM Scientific Instruments Pvt. Ltd., Thermo Fisher Scientific Inc., Thorlabs Inc., Waters Corp. are a few of the key vendors in the Scientific Instrument market.

              North America will register the highest growth rate of 34% among the other regions. Therefore, the Scientific Instrument market in North America is expected to garner significant business opportunities for the vendors during the forecast period.

              US, China, Germany, UK, India

              • Increasing investments in drug discoveryDue to the increasing prevalence of chronic diseases and the growing demand for personalized medicine is the driving factor this market.
              • pharmaceutical and biotechnology companies are increasing their R and D investments in discovering new drugs. This has increased the demand for scientific instruments that are required during the initial phase of the drug discovery process for the identification of protein targets. Scientific instruments are essential for drug discovery is the driving factor this market.
              • especially for screening different compounds. The use of scientific instruments in drug discovery streamlines screening operations; increases throughput is the driving factor this market.
              • consistency is the driving factor this market.
              • and reliability; and eliminates human error.Protein crystallization and crystallography techniques are used to identify potential drug targets by identifying the structural components that can be altered in a protein to suppress or increase a particular therapeutic function. Most drug discovery processes begin with the identification of protein targets is the driving factor this market.
              • which requires the 3D structure of the specific protein that needs to be determined. This is done to understand the properties of the protein is the driving factor this market.
              • its behavior in the human body is the driving factor this market.
              • and its reaction to the introduced drug. This process involves the use of scientific instruments to store and move large volumes of molecule samples with high levels of precision.Due to the increasing prevalence of chronic and infectious diseases across the world is the driving factor this market.
              • pharmaceutical and biotechnology companies are focusing on developing new drugs. In the US is the driving factor this market.
              • about 1.5 million people are diagnosed with cancer each year. Protein structure research is the driving factor this market.
              • which is achieved through protein crystallization and crystallography using scientific instruments is the driving factor this market.
              • helps identify potential drug targets in the protein structure that can be triggered to accelerate a therapeutic function or suppress an infection. This has resulted in an increased demand for scientific instruments.Many countries worldwide have increased their R and D investments to save time and effort in drug approval processes. In the last few years is the driving factor this market.
              • the governments of several developed and developing countries have been supporting research for the discovery and development of new drugs. The rapid advances in scientific instruments have enabled pharmaceutical companies to mitigate risks in drug formulation. Therefore is the driving factor this market.
              • with the growing emphasis on drug discovery R and D procedures and significant investments made in them is the driving factor this market.
              • the demand for scientific instruments is expected to increase is the driving factor this market.
              • which is the driving factor this market.
              • in turn is the driving factor this market.
              • will spur the growth of the market in focus during the forecast period. is the driving factor this market.

              The Scientific Instrument market vendors should focus on grabbing business opportunities from the Laboratory analytical instruments and consumables segment as it accounted for the largest market share in the base year.
              RIA - Research AI Assistant
              Ask RIA