APAC Shunt Reactor Market Analysis - Size and Forecast 2024-2028

APAC Shunt Reactor Market Analysis - Size and Forecast 2024-2028

Published: Dec 2024 139 Pages SKU: IRTNTR72561

Market Overview at a Glance

$160.5 Mn
Market Opportunity
2.8%
CAGR
2.7
YoY growth 2023-2024(%)

APAC Shunt Reactor Market Size 2024-2028 

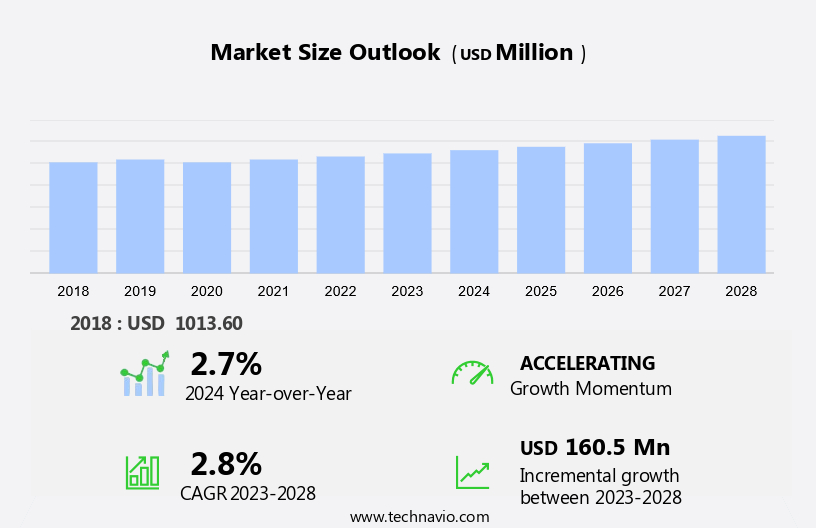
The APAC shunt reactor market size is forecast to increase by USD 160.5 million at a CAGR of 2.8% between 2023 and 2028.

  • The market is experiencing significant growth due to several key drivers. One major factor is the increasing demand for electricity transmission and distribution, particularly in developing nations undergoing industrialization. Another trend is the integration of shunt reactors with smart grid technologies, which enhances power system stability and flexibility. However, the high initial investment required for shunt reactor implementation remains a challenge. Additionally, electric utilities are increasingly focusing on renewable energy integration and addressing climate change concerns, making shunt reactors an essential component in mitigating power factor issues and ensuring grid reliability. Effective insulation and cooling systems are crucial in ensuring the efficient operation of shunt reactors, further driving market growth.

What will be the size of the Market during the forecast period?

Shunt Reactor Market in APAC Size

 Request Free Sample

  • The market is witnessing significant growth due to the increasing integration of renewable energy sources, such as wind power and solar power, into the power grid. Renewable energy sources are becoming increasingly popular as part of the clean energy transition, but they present unique challenges for grid operators. Renewable energy sources generate reactive power, which is necessary for maintaining grid stability and voltage regulation. However, the intermittent nature of these sources can lead to voltage fluctuations and power quality issues. Shunt reactors provide an effective solution to these challenges by compensating for the reactive power needs of the grid.
  • Grid stabilization is a critical aspect of power system efficiency, ensuring the reliability of electricity supply. Voltage fluctuations can cause significant energy loss and damage to equipment. Shunt reactors help mitigate these issues by providing reactive power compensation, ensuring that the voltage levels remain within acceptable limits. High-power applications, such as high-voltage transmission lines, require specialized reactive power solutions. Oil-immersed shunt reactors are commonly used In these applications due to their high power rating and ability to handle large currents. These reactors offer significant benefits, including energy loss minimization and improved power system efficiency. The aging technology of traditional power generation methods contributes to a growing carbon footprint and the need for more sustainable energy solutions.

How is this market segmented and which is the largest segment?

The market research report provides comprehensive data (region-wise segment analysis), with forecasts and estimates in "USD million" for the period 2024-2028, as well as historical data from 2018-2022 for the following segments.
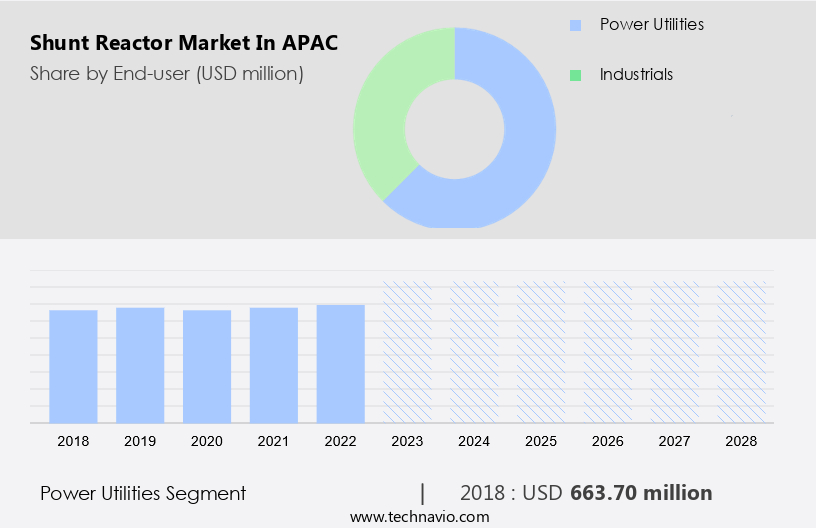
  • End-user
    • Power utilities
    • Industrials
  • Geography
    • APAC
      • China
      • India
      • Japan

By End-user Insights

  • The power utilities segment is estimated to witness significant growth during the forecast period.

Shunt reactors are essential components in electricity transmission systems used by power utilities to ensure voltage control, reactive power compensation, and system stability. These reactors mitigate the Ferranti effect, which arises when the capacitive current of power lines exceeds the current of the connected load, leading to increased line voltage. The Ferranti effect is particularly prevalent in renewable energy integration and during climate change-induced weather events, resulting in increased greenhouse gas emissions and potential power system instability. Shunt reactors provide insulation and cooling to prevent overheating and ensure efficient energy transfer. Their flexibility in handling variable loads makes them indispensable in modern power systems.

Shunt Reactor Market in APAC Size

Get a glance at the market share of various segments Request Free Sample

The power utilities segment was valued at  USD 663.70 million in 2018 and showed a gradual increase during the forecast period.

Market Dynamics

Our researchers analyzed the data with 2023 as the base year, along with the key drivers, trends, and challenges. A holistic analysis of drivers will help companies refine their marketing strategies to gain a competitive advantage.

What are the key market drivers leading to the rise in adoption of APAC Shunt Reactor Market?

Increased industrialization in developing nations is the key driver of the market.

  • In the Asia Pacific region, the industrialization process in developing countries is driving the demand for shunt reactors. Countries such as India, Vietnam, Indonesia, and the Philippines are undergoing rapid economic growth, leading to an increased need for a dependable and efficient power supply to support expanding industries, infrastructure, and urbanization. Shunt reactors are essential in managing reactive power, enhancing voltage stability, and reducing energy losses in high-demand power grids. As industrialization advances, these nations are investing significantly in upgrading and expanding their power transmission and distribution networks. The integration of renewable energy sources, including wind and solar, into national grids intensifies the requirement for reactive power compensation offered by shunt reactors.
  • This ensures grid efficiency and reliability, which is crucial for the integration of renewable energy sources into the power grid. Moreover, the implementation of smart city projects In the region further prioritizes the importance of a stable and efficient power supply. Shunt reactors play a vital role in maintaining grid stability and minimizing power fluctuations, making them an indispensable component of modern power systems.

What are the market trends shaping the APAC Shunt Reactor Market?

Integration of shunt reactors with smart grid technologies is the upcoming trend In the market.

  • Shunt reactors are essential components In the integration of renewable energy sources, such as wind and solar power, into the power grid. In Asia Pacific (APAC), the adoption of these renewable energy sources is increasing, leading to the need for advanced grid technologies to maintain stability and reliability. Shunt reactors, specifically those used in smart grids, play a crucial role in managing reactive power and minimizing transmission losses. Smart grids enable real-time monitoring, control, and optimization of power flows, making them ideal for addressing the fluctuating power supply challenges posed by renewable energy sources. Shunt reactors, integrated into these smart grids, can dynamically adjust reactive power levels, ensuring efficient energy distribution and minimizing voltage fluctuations.
  • The importance of shunt reactors in APAC is further highlighted by the region's push for modernized and efficient power infrastructure. As the demand for reliable and high-quality power increases, the market for shunt reactors is expected to grow. Oil-immersed shunt reactors, in particular, are suitable for high-power applications and can effectively manage the reactive power requirements of the grid.

What challenges does APAC Shunt Reactor Market face during the growth?

High initial investment is a key challenge affecting the market growth.

  • Shunt reactors play a crucial role in energy loss minimization and power quality improvement in electric utilities' TandD infrastructure, particularly in high-voltage transmission networks. Oil-immersed reactors are commonly used for reactive power compensation and grid stability. However, the high initial investment required for their installation and integration poses a challenge for the market. The cost of advanced materials, manufacturing processes, and skilled labor can deter smaller utilities and developing nations from adopting these solutions. Instead, they may prioritize immediate infrastructure needs, such as expanding basic electricity access. Integrating shunt reactors into existing grid systems can also be complex and costly, necessitating specialized equipment, adherence to safety standards, and skilled personnel.
  • Smart Grid Technology is a potential solution to mitigate these challenges by improving grid efficiency and reducing the need for reactive power compensation in certain situations. Therefore, the market may experience growth as economies develop and grid modernization efforts continue.

Exclusive Market Customer Landscape

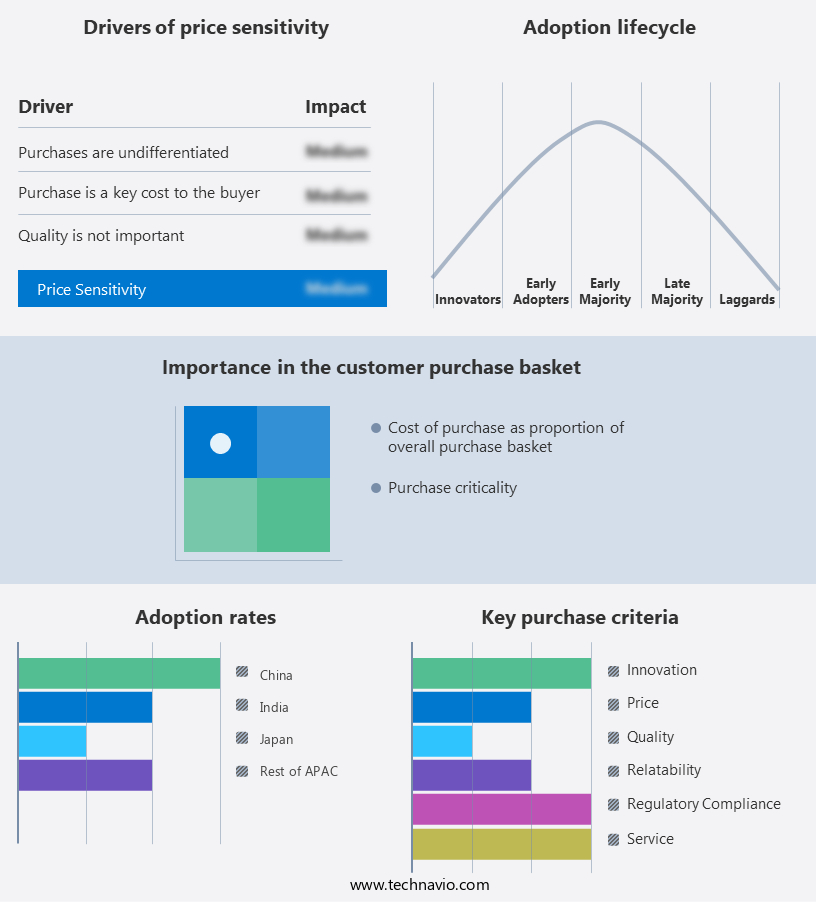
The market forecasting report includes the adoption lifecycle of the market, covering from the innovator's stage to the laggard's stage. It focuses on adoption rates in different regions based on penetration. Furthermore, the report also includes key purchase criteria and drivers of price sensitivity to help companies evaluate and develop their market growth analysis strategies.

Shunt Reactor Market in APAC Share by Geography

 Customer Landscape

Key Companies & Market Insights

Companies are implementing various strategies, such as strategic alliances, market forecast partnerships, mergers and acquisitions, geographical expansion, and product/service launches, to enhance their presence In the market.

The market research and growth report includes detailed analyses of the competitive landscape of the market and information about key companies, including:

  • ABB Ltd.
  • ALSTOM SA
  • CG Power and Industrial Solutions Ltd.
  • Clariant Power System Ltd.
  • ENPAY Endustriyel Pazarlama ve Yat?r?m A.S.
  • Fuji Electric Co. Ltd.
  • Hitachi Ltd.
  • Hyosung Heavy Industries Corp.
  • Hyundai Motor Group
  • Mitsubishi Electric Corp.
  • Precise Engineering Models Pvt. Ltd.
  • Shrihans Electricals Pvt. Ltd.
  • Siemens AG
  • Starlit Electricals
  • Sumitomo Electric Industries Ltd.
  • Tamura Corp
  • Toshiba Corp.
  • TSEA
  • Zaporozhtransformator PrJSC

Qualitative and quantitative analysis of companies has been conducted to help clients understand the wider business environment as well as the strengths and weaknesses of key market players. Data is qualitatively analyzed to categorize companies as pure play, category-focused, industry-focused, and diversified; it is quantitatively analyzed to categorize companies as dominant, leading, strong, tentative, and weak.

Research Analyst Overview

Shunt reactors are essential components In the power grid, playing a crucial role in renewable energy sources integration, grid stabilization, and voltage regulation. These reactors are designed to provide reactive power, improve power factor, and ensure voltage stability in high-power applications. Both oil-immersed and air-core types are used, with oil-immersed reactors being commonly employed in high-voltage transmission lines. Renewable energy sources, such as wind power and solar power, are increasingly being integrated into the power grid. It helps mitigate voltage fluctuations and ensure power quality, enabling the smooth integration of these clean energy sources. Grid reliability is a significant concern, and contributes to energy loss minimization and grid operators' ability to maintain voltage regulation.

In addition, variable reactors offer flexibility in handling varying power requirements and can be used in smart city projects and HVDC systems. The clean energy transition is a global priority, with renewable energy becoming an essential part of electricity transmission. Shunt reactors are essential in this context, reducing the carbon footprint by minimizing energy losses and ensuring grid reliability. Power system efficiency is a critical factor In the electricity industry, and contributes significantly to it by providing reactive power and maintaining voltage stability. Transformers and other T&D infrastructure benefit from the use of shunt reactors, reducing power outages and improving overall power supply quality. Smart grid technology integration further enhances the capabilities of shunt reactors, ensuring a more efficient and reliable power grid.

Market Scope

Report Coverage

Details

Page number

139

Base year

2023

Historic period

2018-2022

Forecast period

2024-2028

Growth momentum & CAGR

Accelerate at a CAGR of 2.8%

Market growth 2024-2028

USD 160.5 million

Market structure

Fragmented

YoY growth 2023-2024(%)

2.7

Competitive landscape

Leading Companies, Market Report, Market Positioning of Companies, Competitive Strategies, and Industry Risks

Request Free Sample

What are the Key Data Covered in this Market Research Report?

  • CAGR of the market during the forecast period
  • Detailed information on factors that will drive the market growth and forecasting between 2024 and 2028
  • Precise estimation of the size of the market  and its contribution of the market in focus to the parent market
  • Accurate predictions about upcoming market growth and trends and changes in consumer behaviour
  • Growth of the market across APAC
  • Thorough analysis of the market's competitive landscape and detailed information about companies
  • Comprehensive analysis of factors that will challenge the growth of market companies

We can help! Our analysts can customize this market research report to meet your requirements Get in touch

1 Executive Summary

  • 1.1 Market overview
    • Executive Summary - Chart on Market Overview
    • Executive Summary - Data Table on Market Overview
    • Executive Summary - Chart on Country Market Characteristics
    • Executive Summary - Chart on Market by Geography
    • Executive Summary - Chart on Market Segmentation by End-user
    • Executive Summary - Chart on Incremental Growth
    • Executive Summary - Data Table on Incremental Growth
    • Executive Summary - Chart on Company Market Positioning

2 Technavio Analysis

  • 2.1 Analysis of price sensitivity, lifecycle, customer purchase basket, adoption rates, and purchase criteria
    • Analysis of price sensitivity, lifecycle, customer purchase basket, adoption rates, and purchase criteria
  • 2.2 Criticality of inputs and Factors of differentiation
    • Overview on criticality of inputs and factors of differentiation
  • 2.3 Factors of disruption
    • Overview on factors of disruption
  • 2.4 Impact of drivers and challenges
    • Impact of drivers and challenges in 2023 and 2028

3 Market Landscape

  • 3.1 Market ecosystem
    • Parent Market
    • Data Table on - Parent Market
  • 3.2 Market characteristics
    • Market characteristics analysis
  • 3.3 Value chain analysis
    • Value chain analysis

4 Market Sizing

  • 4.1 Market definition
    • Offerings of companies included in the market definition
  • 4.2 Market segment analysis
    • Market segments
  • 4.3 Market size 2023
    • 4.4 Market outlook: Forecast for 2023-2028
      • Chart on APAC - Market size and forecast 2023-2028 ($ million)
      • Data Table on Regional - Market size and forecast 2023-2028 ($ million)
      • Chart on APAC: Year-over-year growth 2023-2028 (%)
      • Data Table on Regional - Market size and forecast 2023-2028 ($ million)

    5 Historic Market Size

    • 5.1 Shunt Reactor Market in APAC 2018 - 2022
      • Historic Market Size - Data Table on Shunt Reactor Market in APAC 2018 - 2022 ($ million)
    • 5.2 End-user segment analysis 2018 - 2022
      • Historic Market Size - End-user Segment 2018 - 2022 ($ million)
    • 5.3 Geography segment analysis 2018 - 2022
      • Historic Market Size - Geography Segment 2018 - 2022 ($ million)

    6 Qualitative Analysis

    • 6.1 Impact of AI on the Shunt Reactor Market in APAC

      7 Five Forces Analysis

      • 7.1 Five forces summary
        • Five forces analysis - Comparison between 2023 and 2028
      • 7.2 Bargaining power of buyers
        • Bargaining power of buyers - Impact of key factors 2023 and 2028
      • 7.3 Bargaining power of suppliers
        • Bargaining power of suppliers - Impact of key factors in 2023 and 2028
      • 7.4 Threat of new entrants
        • Threat of new entrants - Impact of key factors in 2023 and 2028
      • 7.5 Threat of substitutes
        • Threat of substitutes - Impact of key factors in 2023 and 2028
      • 7.6 Threat of rivalry
        • Threat of rivalry - Impact of key factors in 2023 and 2028
      • 7.7 Market condition
        • Chart on Market condition - Five forces 2023 and 2028

      8 Market Segmentation by End-user

      • 8.1 Market segments
        • Chart on End-user - Market share 2023-2028 (%)
        • Data Table on End-user - Market share 2023-2028 (%)
      • 8.2 Comparison by End-user
        • Chart on Comparison by End-user
        • Data Table on Comparison by End-user
      • 8.3 Power utilities - Market size and forecast 2023-2028
        • Chart on Power utilities - Market size and forecast 2023-2028 ($ million)
        • Data Table on Power utilities - Market size and forecast 2023-2028 ($ million)
        • Chart on Power utilities - Year-over-year growth 2023-2028 (%)
        • Data Table on Power utilities - Year-over-year growth 2023-2028 (%)
      • 8.4 Industrials - Market size and forecast 2023-2028
        • Chart on Industrials - Market size and forecast 2023-2028 ($ million)
        • Data Table on Industrials - Market size and forecast 2023-2028 ($ million)
        • Chart on Industrials - Year-over-year growth 2023-2028 (%)
        • Data Table on Industrials - Year-over-year growth 2023-2028 (%)
      • 8.5 Market opportunity by End-user
        • Market opportunity by End-user ($ million)
        • Data Table on Market opportunity by End-user ($ million)

      9 Customer Landscape

      • 9.1 Customer landscape overview
        • Analysis of price sensitivity, lifecycle, customer purchase basket, adoption rates, and purchase criteria

      10 Geographic Landscape

      • 10.1 Geographic segmentation
        • Chart on Market share by geography - 2023-2028 (%)
        • Data Table on Market share by geography - 2023-2028 (%)
      • 10.2 Geographic comparison
        • Chart on Geographic comparison
        • Data Table on Geographic comparison
      • 10.3 China - Market size and forecast 2023-2028
        • Chart on China - Market size and forecast 2023-2028 ($ million)
        • Data Table on China - Market size and forecast 2023-2028 ($ million)
        • Chart on China - Year-over-year growth 2023-2028 (%)
        • Data Table on China - Year-over-year growth 2023-2028 (%)
      • 10.4 India - Market size and forecast 2023-2028
        • Chart on India - Market size and forecast 2023-2028 ($ million)
        • Data Table on India - Market size and forecast 2023-2028 ($ million)
        • Chart on India - Year-over-year growth 2023-2028 (%)
        • Data Table on India - Year-over-year growth 2023-2028 (%)
      • 10.5 Japan - Market size and forecast 2023-2028
        • Chart on Japan - Market size and forecast 2023-2028 ($ million)
        • Data Table on Japan - Market size and forecast 2023-2028 ($ million)
        • Chart on Japan - Year-over-year growth 2023-2028 (%)
        • Data Table on Japan - Year-over-year growth 2023-2028 (%)
      • 10.6 Rest of APAC - Market size and forecast 2023-2028
        • Chart on Rest of APAC - Market size and forecast 2023-2028 ($ million)
        • Data Table on Rest of APAC - Market size and forecast 2023-2028 ($ million)
        • Chart on Rest of APAC - Year-over-year growth 2023-2028 (%)
        • Data Table on Rest of APAC - Year-over-year growth 2023-2028 (%)
      • 10.7 Market opportunity by geography
        • Market opportunity by geography ($ million)
        • Data Table on Market opportunity by geography ($ million)

      11 Drivers, Challenges, and Opportunity/Restraints

      • 11.1 Market drivers
        • 11.2 Market challenges
          • 11.3 Impact of drivers and challenges
            • Impact of drivers and challenges in 2023 and 2028
          • 11.4 Market opportunities/restraints

            12 Competitive Landscape

            • 12.1 Overview
              • 12.2 Competitive Landscape
                • Overview on criticality of inputs and factors of differentiation
              • 12.3 Landscape disruption
                • Overview on factors of disruption
              • 12.4 Industry risks
                • Impact of key risks on business

              13 Competitive Analysis

              • 13.1 Companies profiled
                • Companies covered
              • 13.2 Company ranking index
                • Company ranking index
              • 13.3 Market positioning of companies
                • Matrix on companies position and classification
              • 13.4 ABB Ltd.
                • ABB Ltd. - Overview
                • ABB Ltd. - Business segments
                • ABB Ltd. - Key news
                • ABB Ltd. - Key offerings
                • ABB Ltd. - Segment focus
                • SWOT
              • 13.5 ALSTOM SA
                • ALSTOM SA - Overview
                • ALSTOM SA - Business segments
                • ALSTOM SA - Key news
                • ALSTOM SA - Key offerings
                • ALSTOM SA - Segment focus
                • SWOT
              • 13.6 Fuji Electric Co. Ltd.
                • Fuji Electric Co. Ltd. - Overview
                • Fuji Electric Co. Ltd. - Business segments
                • Fuji Electric Co. Ltd. - Key news
                • Fuji Electric Co. Ltd. - Key offerings
                • Fuji Electric Co. Ltd. - Segment focus
                • SWOT
              • 13.7 Hitachi Ltd.
                • Hitachi Ltd. - Overview
                • Hitachi Ltd. - Business segments
                • Hitachi Ltd. - Key news
                • Hitachi Ltd. - Key offerings
                • Hitachi Ltd. - Segment focus
                • SWOT
              • 13.8 Hyundai Motor Group
                • Hyundai Motor Group - Overview
                • Hyundai Motor Group - Business segments
                • Hyundai Motor Group - Key news
                • Hyundai Motor Group - Key offerings
                • Hyundai Motor Group - Segment focus
                • SWOT
              • 13.9 Mitsubishi Electric Corp.
                • Mitsubishi Electric Corp. - Overview
                • Mitsubishi Electric Corp. - Business segments
                • Mitsubishi Electric Corp. - Key offerings
                • Mitsubishi Electric Corp. - Segment focus
                • SWOT
              • 13.10 Siemens AG
                • Siemens AG - Overview
                • Siemens AG - Business segments
                • Siemens AG - Key news
                • Siemens AG - Key offerings
                • Siemens AG - Segment focus
                • SWOT
              • 13.11 Toshiba Corp.
                • Toshiba Corp. - Overview
                • Toshiba Corp. - Business segments
                • Toshiba Corp. - Key news
                • Toshiba Corp. - Key offerings
                • Toshiba Corp. - Segment focus
                • SWOT
              • 13.12 TSEA
                • TSEA - Overview
                • TSEA - Product / Service
                • TSEA - Key offerings
                • SWOT
              • 13.13 Zaporozhtransformator PrJSC
                • Zaporozhtransformator PrJSC - Overview
                • Zaporozhtransformator PrJSC - Product / Service
                • Zaporozhtransformator PrJSC - Key offerings
                • SWOT

              14 Appendix

              • 14.1 Scope of the report
                • 14.2 Inclusions and exclusions checklist
                  • Inclusions checklist
                  • Exclusions checklist
                • 14.3 Currency conversion rates for US$
                  • Currency conversion rates for US$
                • 14.4 Research methodology
                  • Research methodology
                • 14.5 Data procurement
                  • Information sources
                • 14.6 Data validation
                  • Data validation
                • 14.7 Validation techniques employed for market sizing
                  • Validation techniques employed for market sizing
                • 14.8 Data synthesis
                  • Data synthesis
                • 14.9 360 degree market analysis
                  • 360 degree market analysis
                • 14.10 List of abbreviations
                  • List of abbreviations

                Research Methodology

                Technavio presents a detailed picture of the market by way of study, synthesis, and summation of data from multiple sources. The analysts have presented the various facets of the market with a particular focus on identifying the key industry influencers. The data thus presented is comprehensive, reliable, and the result of extensive research, both primary and secondary.

                INFORMATION SOURCES

                Primary sources

                • Manufacturers and suppliers
                • Channel partners
                • Industry experts
                • Strategic decision makers

                Secondary sources

                • Industry journals and periodicals
                • Government data
                • Financial reports of key industry players
                • Historical data
                • Press releases

                DATA ANALYSIS

                Data Synthesis

                • Collation of data
                • Estimation of key figures
                • Analysis of derived insights

                Data Validation

                • Triangulation with data models
                • Reference against proprietary databases
                • Corroboration with industry experts

                REPORT WRITING

                Qualitative

                • Market drivers
                • Market challenges
                • Market trends
                • Five forces analysis

                Quantitative

                • Market size and forecast
                • Market segmentation
                • Geographical insights
                • Competitive landscape

                Interested in this report?

                Get your sample now to see our research methodology and insights!

                Download Now

                Frequently Asked Questions

                Shunt Reactor market growth will increase by $ 160.5 mn during 2024-2028 .

                The Shunt Reactor market is expected to grow at a CAGR of 2.8% during 2024-2028 .

                Shunt Reactor market is segmented by End-user( Power utilities, Industrials)

                ABB Ltd., ALSTOM SA, CG Power and Industrial Solutions Ltd., Clariant Power System Ltd., ENPAY Endustriyel Pazarlama ve Yat?r?m A.S., Fuji Electric Co. Ltd., Hitachi Ltd., Hyosung Heavy Industries Corp., Hyundai Motor Group, Mitsubishi Electric Corp., Precise Engineering Models Pvt. Ltd., Shrihans Electricals Pvt. Ltd., Siemens AG, Starlit Electricals, Sumitomo Electric Industries Ltd., Tamura Corp, Toshiba Corp., TSEA, Zaporozhtransformator PrJSC are a few of the key vendors in the Shunt Reactor market.

                APAC will register the highest growth rate of 100% among the other regions. Therefore, the Shunt Reactor market in APAC is expected to garner significant business opportunities for the vendors during the forecast period.

                China, India, Japan, Rest of APAC

                • Increased industrialization in developing nationsIncreased industrialization in developing nations is a significant driver for the shunt reactor market in APAC is the driving factor this market.
                • as countries like India is the driving factor this market.
                • Vietnam is the driving factor this market.
                • Indonesia is the driving factor this market.
                • and the Philippines experience rapid economic growth. Industrialization demands a robust and reliable power supply to support expanding manufacturing hubs is the driving factor this market.
                • industrial facilities is the driving factor this market.
                • and urban infrastructure. Shunt reactors play a crucial role in managing reactive power is the driving factor this market.
                • improving voltage stability is the driving factor this market.
                • and minimizing energy losses in high-demand power grids.As industrialization progresses is the driving factor this market.
                • developing nations are investing heavily in modernizing and expanding their power transmission and distribution infrastructure. The integration of renewable energy sources is the driving factor this market.
                • such as wind and solar is the driving factor this market.
                • into national grids further increases the need for reactive power compensation provided by shunt reactors is the driving factor this market.
                • ensuring grid efficiency and stability.Government initiatives is the driving factor this market.
                • public-private partnerships is the driving factor this market.
                • and foreign investments in energy projects amplify this growth. For example is the driving factor this market.
                • the establishment of industrial corridors and special economic zones in these countries leads to increased energy demand is the driving factor this market.
                • driving the adoption of advanced grid technologies is the driving factor this market.
                • including shunt reactors. Such factors are expected to drive the growth of the shunt reactor market in APAC during the forecast period. is the driving factor this market.

                The Shunt Reactor market vendors should focus on grabbing business opportunities from the Power utilities segment as it accounted for the largest market share in the base year.