Power Transformers Market Analysis, Size, and Forecast 2026-2030: APAC (China, India, and Japan), Europe (Germany, France, and UK), Middle East and Africa (Saudi Arabia, UAE, and South Africa), North America (US, Canada, and Mexico), South America (Brazil and Argentina), and Rest of World (ROW)

Power Transformers Market Analysis, Size, and Forecast 2026-2030:
APAC (China, India, and Japan), Europe (Germany, France, and UK), Middle East and Africa (Saudi Arabia, UAE, and South Africa), North America (US, Canada, and Mexico), South America (Brazil and Argentina), and Rest of World (ROW)

Published: Mar 2026 303 Pages SKU: IRTNTR43204

Market Overview at a Glance

$14.29 B
Market Opportunity
6.4%
CAGR 2025 - 2030
37.7%
APAC Growth
$27.09 B
Liquid immersed segment 2024

Power Transformers Market Size 2026-2030

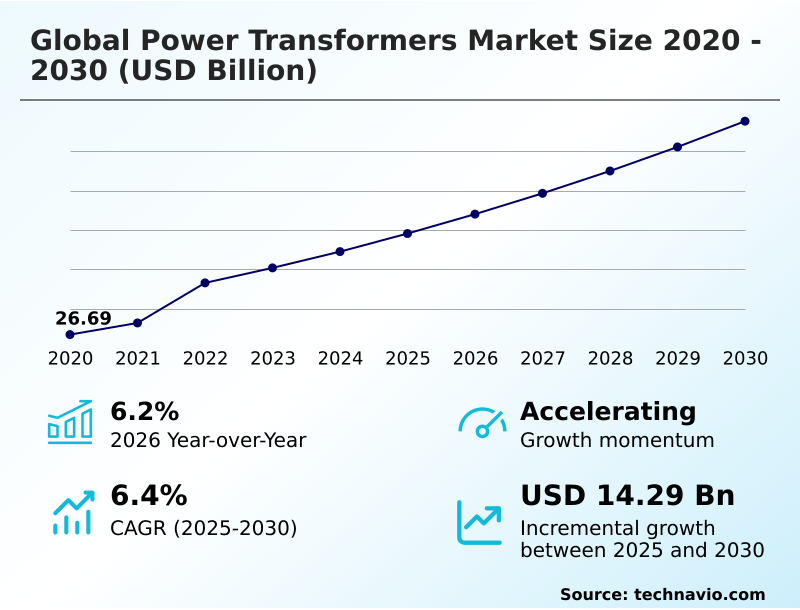
The power transformers market size is valued to increase by USD 14.29 billion, at a CAGR of 6.4% from 2025 to 2030. Imperative for modernization and replacement of aging grid infrastructure will drive the power transformers market.

Major Market Trends & Insights

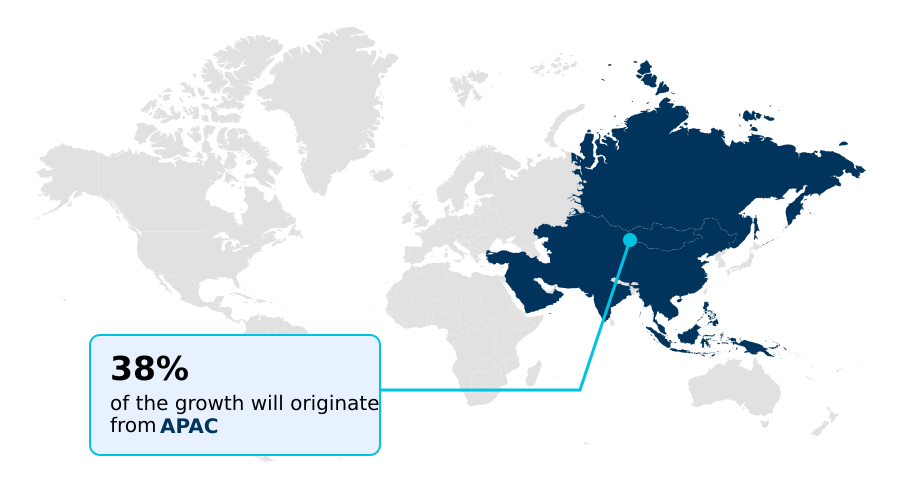
  • APAC dominated the market and accounted for a 37.7% growth during the forecast period.
  • By Type - Liquid immersed segment was valued at USD 27.09 billion in 2024
  • By End-user - Commercial power segment accounted for the largest market revenue share in 2024

Market Size & Forecast

  • Market Opportunities: USD 27.15 billion
  • Market Future Opportunities: USD 14.29 billion
  • CAGR from 2025 to 2030 : 6.4%

Market Summary

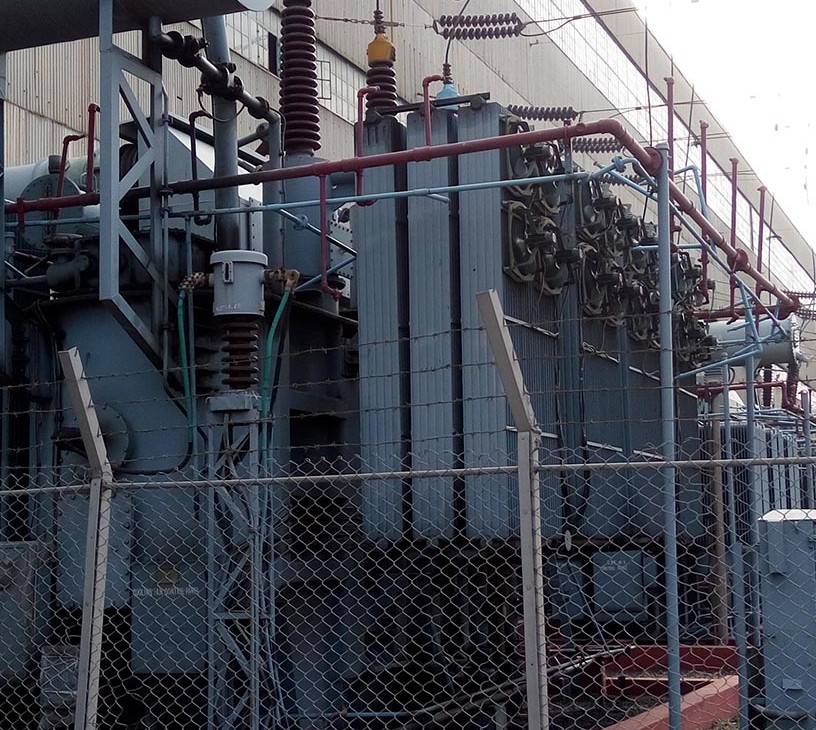
  • The power transformers market is integral to global energy infrastructure, facilitating the efficient transmission and distribution of electricity. These critical assets enable the stepping up of voltage for long-distance transport from generation sources and stepping it down for safe consumption by industrial, commercial, and residential end-users.
  • The sector is driven by the imperative to replace aging grid infrastructure, the accelerated integration of intermittent renewable energy sources, and rising global electricity consumption.
  • Key trends include the adoption of smart transformers equipped with sensors for predictive maintenance, a shift toward higher efficiency designs using advanced materials like amorphous steel, and the development of specialized units for applications such as data centers and electric vehicle charging.
  • For instance, a utility can leverage dissolved gas analysis data from a digital transformer to preemptively address an incipient fault, preventing a costly outage and improving grid reliability by over 25%. However, the market faces challenges from volatile raw material costs and the high capital investment required for new installations and grid modernization projects.

What will be the Size of the Power Transformers Market during the forecast period?

Get Key Insights on Market Forecast (PDF) Request Free Sample

How is the Power Transformers Market Segmented?

The power transformers industry research report provides comprehensive data (region-wise segment analysis), with forecasts and estimates in "USD million" for the period 2026-2030, as well as historical data from 2020-2024 for the following segments.

  • Type
    • Liquid immersed
    • Dry type
  • End-user
    • Commercial power
    • Residential power
    • Industrial power
  • Product type
    • Shell
    • Closed
    • Berry
  • Geography
    • APAC
      • China
      • India
      • Japan
    • Europe
      • Germany
      • France
      • UK
    • Middle East and Africa
      • Saudi Arabia
      • UAE
      • South Africa
    • North America
      • US
      • Canada
      • Mexico
    • South America
      • Brazil
      • Argentina
    • Rest of World (ROW)

By Type Insights

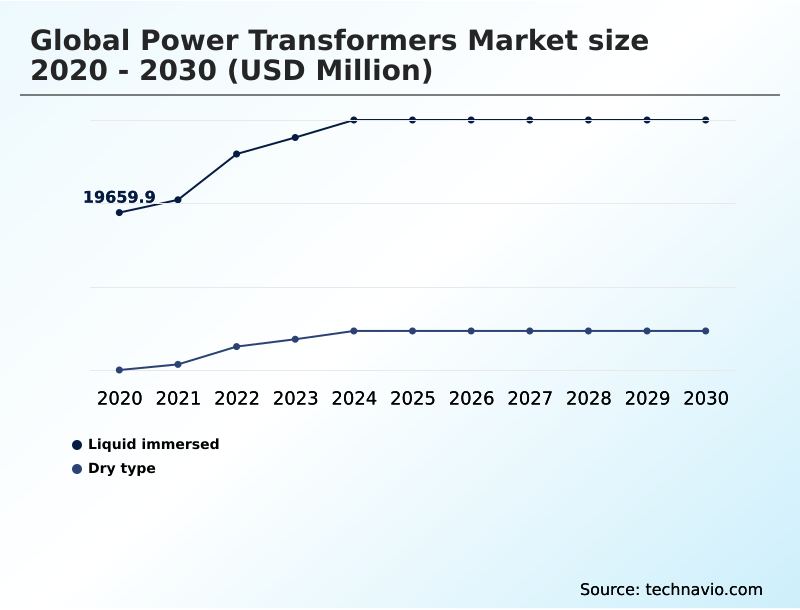
The liquid immersed segment is estimated to witness significant growth during the forecast period.

The global power transformers market is segmented by type, end-user, and geography, reflecting diverse operational needs. The liquid-immersed segment, crucial for high-voltage applications, utilizes dielectric fluids for insulation and efficient heat dissipation.

This design is foundational to electricity transmission grids, enabling compact and power-dense units. Innovations in this area focus on enhancing grid resilience and integrating renewable energy sources.

Modern liquid-immersed units are engineered for higher efficiency, with some designs reducing no-load losses by over 70% compared to legacy equipment.

While essential for bulk power transfer, these transformers require diligent predictive maintenance and management of the insulating liquid to ensure long-term reliability and mitigate environmental risks associated with potential leaks.

The use of advanced dielectric coolant and adherence to stringent maintenance protocols are critical for asset longevity.

Request Free Sample

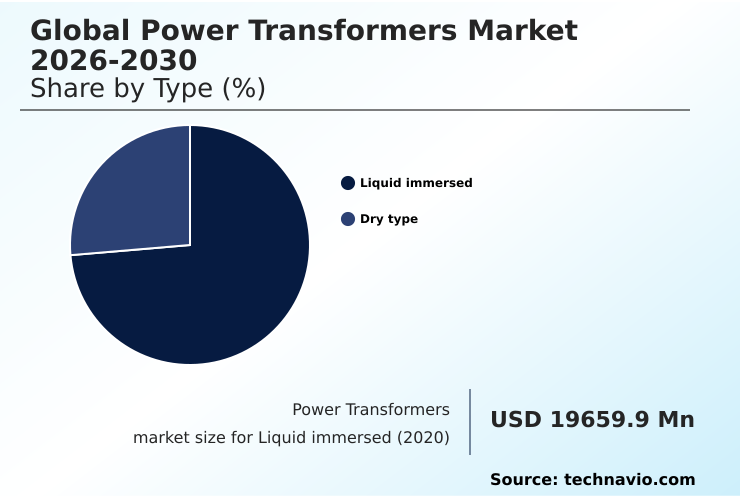
The Liquid immersed segment was valued at USD 27.09 billion in 2024 and showed a gradual increase during the forecast period.

Request Free Sample

Regional Analysis

APAC is estimated to contribute 37.7% to the growth of the global market during the forecast period.Technavio’s analysts have elaborately explained the regional trends and drivers that shape the market during the forecast period.

See How Power Transformers Market Demand is Rising in APAC Request Free Sample

The geographic landscape of the power transformers market is characterized by varied regional priorities and growth trajectories.

APAC leads global expansion, projected to contribute approximately 38% of the market's incremental growth, driven by rapid industrialization and massive grid expansion projects in countries like China and India.

In contrast, mature markets such as North America and Europe focus on modernizing aging grid infrastructure and enhancing grid resilience.

In North America, this involves grid hardening against extreme weather, whereas Europe's focus is on integrating vast offshore wind capacity, necessitating advanced HVDC transmission systems.

The Middle East and Africa are driven by large-scale economic diversification projects and rural electrification, while South America's growth is tied to integrating its significant hydropower and renewable resources.

These distinct regional drivers influence demand for specific transformer technologies, from UHV units in APAC to specialized, resilient models in North America.

Market Dynamics

Our researchers analyzed the data with 2025 as the base year, along with the key drivers, trends, and challenges. A holistic analysis of drivers will help companies refine their marketing strategies to gain a competitive advantage.

  • Strategic decisions in the power transformers market increasingly hinge on a sophisticated analysis of lifecycle costs and specialized applications. The debate over liquid-immersed vs dry-type transformers extends beyond initial price to consider long-term maintenance, safety, and environmental impact.
  • For instance, the superior fire safety of ester fluids for transformer safety makes them a preferred choice in dense urban environments, despite higher upfront costs. Similarly, investing in amorphous steel core transformer efficiency can yield substantial operational savings by reducing no-load losses over the asset's lifespan.
  • The emergence of solid-state transformer grid applications promises revolutionary power flow control, though high costs currently limit widespread deployment. For existing assets, leveraging smart transformers for predictive maintenance is a key strategy to enhance reliability; adopting such approaches can reduce unplanned downtime by a factor of three compared to reactive measures.
  • Furthermore, addressing power quality issues in industrial power systems requires transformers with robust voltage regulation capabilities. As grids become more complex, the ability to manage bidirectional power flows in transformers and integrate large-scale energy storage systems are becoming critical competencies for both operators and manufacturers, shaping the technological roadmap for the entire industry.

What are the key market drivers leading to the rise in the adoption of Power Transformers Industry?

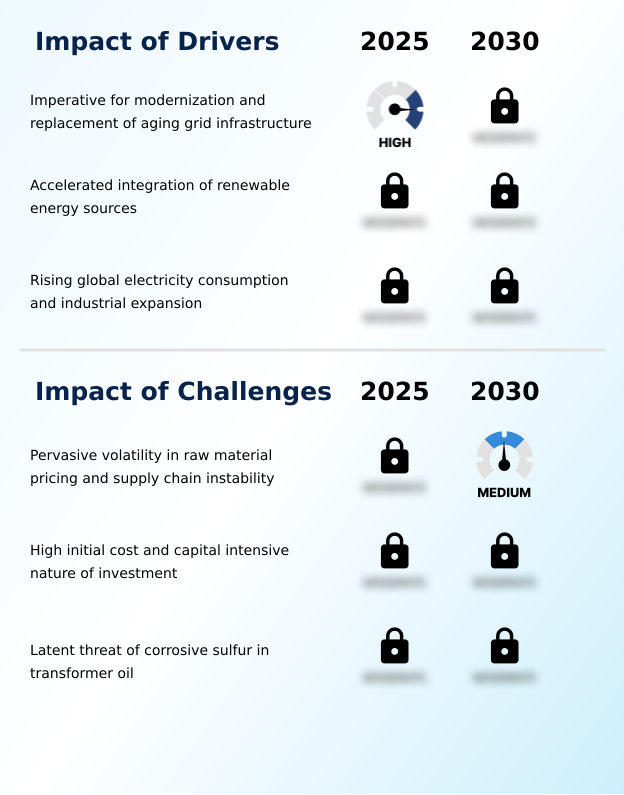
  • The imperative for modernizing and replacing aging grid infrastructure stands as a key driver for the market.

  • The market's growth is propelled by three foundational drivers that are fundamentally altering grid requirements.
  • The imperative to modernize aging grid infrastructure in developed nations creates a consistent replacement demand, with utilities seeking higher efficiency units that can reduce technical losses by up to 15%.
  • Simultaneously, the global transition to renewable energy sources necessitates extensive grid expansion to connect remote solar and wind farms to load centers, requiring specialized generator step-up units and transmission transformers.
  • Finally, rising global electricity consumption, amplified by the electrification of transport and the explosive growth of the digital economy, provides a powerful underlying demand.
  • For instance, data center power requirements are expanding at a rate nearly five times greater than average electricity growth, demanding highly reliable and efficient power infrastructure to support their critical operations.

What are the market trends shaping the Power Transformers Industry?

  • A growing emphasis on enhancing grid resilience and promoting decentralization is emerging as a significant market trend, shaping future investments and technological priorities.

  • Key trends are reshaping the market, driven by the need for a more resilient and sustainable electrical grid. A strategic shift toward decentralized power generation is creating demand for transformers capable of managing bidirectional power flow and the intermittency of renewable energy sources. Technological advancements are focused on improving efficiency and safety, with a notable move toward eco-friendly solutions.
  • The adoption of ester fluids as a dielectric coolant, for example, increases fire safety thresholds by more than 100% compared to conventional mineral oil. Concurrently, the proliferation of specialized end-use sectors, such as data centers and EV charging infrastructure, is fueling demand for application-specific designs.
  • These trends are pushing manufacturers to innovate beyond standard specifications toward intelligent, adaptable, and environmentally responsible transformer technologies.

What challenges does the Power Transformers Industry face during its growth?

  • Pervasive volatility in raw material pricing, coupled with supply chain instability, presents a key challenge affecting industry growth.

  • The market contends with significant operational and financial challenges that temper its growth trajectory. The pervasive volatility in raw material pricing, particularly for copper and grain-oriented electrical steel, creates substantial uncertainty for manufacturers. Unforeseen cost escalations can impact project margins by as much as 25% year-over-year, complicating long-term financial planning.
  • The high initial capital cost of power transformers also acts as a constraint, often delaying essential grid modernization projects. Furthermore, latent technical issues, such as the presence of corrosive sulfur compounds like dibenzyl disulfide in transformer oil, pose a long-term reliability risk.
  • If unmitigated, such contamination can degrade insulation and reduce an asset's operational lifespan by up to 40%, necessitating costly testing and maintenance regimes.

Exclusive Technavio Analysis on Customer Landscape

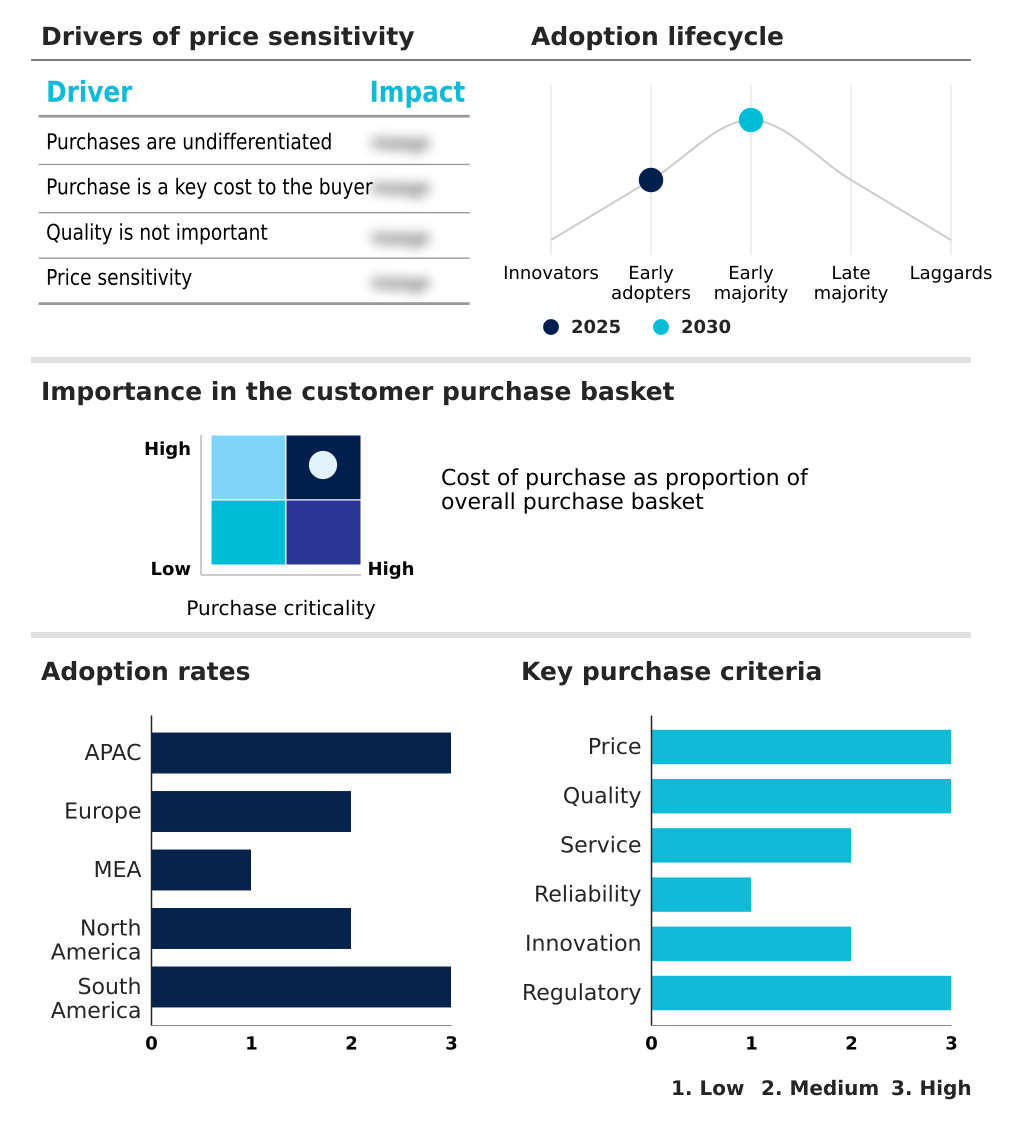
The power transformers market forecasting report includes the adoption lifecycle of the market, covering from the innovator’s stage to the laggard’s stage. It focuses on adoption rates in different regions based on penetration. Furthermore, the power transformers market report also includes key purchase criteria and drivers of price sensitivity to help companies evaluate and develop their market growth analysis strategies.

Customer Landscape of Power Transformers Industry

Competitive Landscape

Companies are implementing various strategies, such as strategic alliances, power transformers market forecast, partnerships, mergers and acquisitions, geographical expansion, and product/service launches, to enhance their presence in the industry.

ALTRAFO Srl - Offerings focus on high-voltage and ultra-high-voltage solutions, featuring eco-efficient and digital-enabled units integral to grid modernization and reliability.

The industry research and growth report includes detailed analyses of the competitive landscape of the market and information about key companies, including:

  • ALTRAFO Srl
  • Altro Transformers Pty. Ltd.
  • CG Power and Industrial Ltd.
  • Eaton Corp. Plc
  • ETEL TRANSFORMERS PTY LTD.
  • Fuji Electric Co. Ltd.
  • GE Vernova Inc.
  • Hammond Power Inc.
  • HD Hyundai Electric Co. Ltd.
  • Hitachi Energy Ltd.
  • Layer Electronics Srl
  • META POWER SOLUTION LLC
  • MGM Transformer Co.
  • Mitsubishi Electric Corp.
  • Schneider Electric SE
  • Siemens Energy AG
  • Southern Electronic Services
  • Triad Magnetics
  • Tyree Industries
  • Wilson Power Solutions India

Qualitative and quantitative analysis of companies has been conducted to help clients understand the wider business environment as well as the strengths and weaknesses of key industry players. Data is qualitatively analyzed to categorize companies as pure play, category-focused, industry-focused, and diversified; it is quantitatively analyzed to categorize companies as dominant, leading, strong, tentative, and weak.

Recent Development and News in Power transformers market

  • In May 2025, GE Vernova Inc. secured a major contract from the Power Grid Corporation of India Ltd. to supply extra high-voltage transformers and shunt reactors for critical HVDC transmission projects, supporting the integration of renewable energy into the national grid.
  • In January 2025, HD Hyundai Electric Co. Ltd. announced an investment of approximately $274 million to increase production capacity at its facilities in Alabama, US, and Ulsan, South Korea, to meet rising demand in the North American market.
  • In January 2025, Siemens Energy AG expanded its portfolio by launching a new line of high-capacity smart power transformers designed to facilitate renewable energy integration and support digital grid management with real-time monitoring capabilities.
  • In November 2024, Hitachi Energy Ltd. began construction on a new transformer factory in Pindamonhangaba, Brazil, as part of a $200 million investment aimed at doubling its domestic production capacity to serve the growing South American market and establish a strategic global hub.

Dive into Technavio’s robust research methodology, blending expert interviews, extensive data synthesis, and validated models for unparalleled Power Transformers Market insights. See full methodology.

Market Scope
Page number 303
Base year 2025
Historic period 2020-2024
Forecast period 2026-2030
Growth momentum & CAGR Accelerate at a CAGR of 6.4%
Market growth 2026-2030 USD 14291.4 million
Market structure Fragmented
YoY growth 2025-2026(%) 6.2%
Key countries China, India, Japan, South Korea, Australia, Indonesia, Germany, France, UK, Italy, Spain, The Netherlands, Saudi Arabia, UAE, South Africa, Egypt, Turkey, US, Canada, Mexico, Brazil, Argentina and Chile
Competitive landscape Leading Companies, Market Positioning of Companies, Competitive Strategies, and Industry Risks

Request Free Sample

Research Analyst Overview

  • The power transformers market is defined by a critical need for technological evolution to support a changing energy landscape. A primary boardroom consideration involves balancing the high capital expenditure of advanced solutions like solid-state transformers against the long-term operational benefits of enhanced efficiency and reliability.
  • The integration of digital technologies is no longer a niche but a central requirement, transforming transformers into intelligent grid assets capable of predictive maintenance and dynamic load management. For example, deploying units with advanced online monitoring systems can improve fault detection accuracy by over 95%, directly impacting grid stability.
  • This shift is driven by the dual pressures of replacing aging infrastructure and accommodating the variable nature of renewable energy sources.
  • Success in this market is increasingly determined by a manufacturer's ability to deliver not just hardware but integrated solutions that enhance grid resilience, optimize asset performance, and align with global decarbonization goals, demanding continuous innovation in materials, design, and digital capabilities.

What are the Key Data Covered in this Power Transformers Market Research and Growth Report?

  • What is the expected growth of the Power Transformers Market between 2026 and 2030?

    • USD 14.29 billion, at a CAGR of 6.4%

  • What segmentation does the market report cover?

    • The report is segmented by Type (Liquid immersed, and Dry type), End-user (Commercial power, Residential power, and Industrial power), Product Type (Shell, Closed, and Berry) and Geography (APAC, Europe, Middle East and Africa, North America, South America)

  • Which regions are analyzed in the report?

    • APAC, Europe, Middle East and Africa, North America and South America

  • What are the key growth drivers and market challenges?

    • Imperative for modernization and replacement of aging grid infrastructure, Pervasive volatility in raw material pricing and supply chain instability

  • Who are the major players in the Power Transformers Market?

    • ALTRAFO Srl, Altro Transformers Pty. Ltd., CG Power and Industrial Ltd., Eaton Corp. Plc, ETEL TRANSFORMERS PTY LTD., Fuji Electric Co. Ltd., GE Vernova Inc., Hammond Power Inc., HD Hyundai Electric Co. Ltd., Hitachi Energy Ltd., Layer Electronics Srl, META POWER SOLUTION LLC, MGM Transformer Co., Mitsubishi Electric Corp., Schneider Electric SE, Siemens Energy AG, Southern Electronic Services, Triad Magnetics, Tyree Industries and Wilson Power Solutions India

Market Research Insights

  • Market dynamics are shaped by a convergence of grid modernization mandates and new demand from power-intensive sectors. The critical need to upgrade aging grid infrastructure is creating a sustained replacement cycle, while the global energy transition necessitates new grid architecture to support renewable energy integration.
  • The rise of the digital economy fuels demand for high-reliability data center power, with consumption in this sector growing five times faster than overall electricity demand. Simultaneously, the expansion of EV charging infrastructure places unprecedented stress on local distribution networks, requiring significant upgrades.
  • The adoption of smart grid development strategies, which can reduce outage durations by up to 40%, is accelerating the deployment of intelligent transformers. These interconnected factors are compelling a shift toward more resilient, efficient, and digitally-enabled transformer solutions across all applications.

We can help! Our analysts can customize this power transformers market research report to meet your requirements.

Get in touch

1. Executive Summary

1.1 Market overview

Executive Summary - Chart on Market Overview
Executive Summary - Data Table on Market Overview
Executive Summary - Chart on Global Market Characteristics
Executive Summary - Chart on Market by Geography
Executive Summary - Chart on Market Segmentation by Type
Executive Summary - Chart on Market Segmentation by End-user
Executive Summary - Chart on Market Segmentation by Product Type
Executive Summary - Chart on Incremental Growth
Executive Summary - Data Table on Incremental Growth
Executive Summary - Chart on Company Market Positioning

2. Technavio Analysis

2.1 Analysis of price sensitivity, lifecycle, customer purchase basket, adoption rates, and purchase criteria

2.2 Criticality of inputs and Factors of differentiation

Chart on Overview on criticality of inputs and factors of differentiation

2.3 Factors of disruption

Chart on Overview on factors of disruption

2.4 Impact of drivers and challenges

Chart on Impact of drivers and challenges in 2025 and 2030

3. Market Landscape

3.1 Market ecosystem

Chart on Parent Market
Data Table on - Parent Market

3.2 Market characteristics

Chart on Market characteristics analysis

3.3 Value chain analysis

Chart on Value chain analysis

4. Market Sizing

4.1 Market definition

Data Table on Offerings of companies included in the market definition

4.2 Market segment analysis

Market segments

4.3 Market size 2025

4.4 Market outlook: Forecast for 2025-2030

Chart on Global - Market size and forecast 2025-2030 ($ million)
Data Table on Global - Market size and forecast 2025-2030 ($ million)
Chart on Global Market: Year-over-year growth 2025-2030 (%)
Data Table on Global Market: Year-over-year growth 2025-2030 (%)

5. Historic Market Size

5.1 Global Power Transformers Market 2020 - 2024

Historic Market Size - Data Table on Global Power Transformers Market 2020 - 2024 ($ million)

5.2 Type segment analysis 2020 - 2024

Historic Market Size - Type Segment 2020 - 2024 ($ million)

5.3 End-user segment analysis 2020 - 2024

Historic Market Size - End-user Segment 2020 - 2024 ($ million)

5.4 Product Type segment analysis 2020 - 2024

Historic Market Size - Product Type Segment 2020 - 2024 ($ million)

5.5 Geography segment analysis 2020 - 2024

Historic Market Size - Geography Segment 2020 - 2024 ($ million)

5.6 Country segment analysis 2020 - 2024

Historic Market Size - Country Segment 2020 - 2024 ($ million)

6. Qualitative Analysis

6.1 Impact of AI on global power transformers market

6.2 Impact of geopolitical conflicts on global power transformers market

7. Five Forces Analysis

7.1 Five forces summary

Five forces analysis - Comparison between 2025 and 2030

7.2 Bargaining power of buyers

Bargaining power of buyers - Impact of key factors 2025 and 2030

7.3 Bargaining power of suppliers

Bargaining power of suppliers - Impact of key factors in 2025 and 2030

7.4 Threat of new entrants

Threat of new entrants - Impact of key factors in 2025 and 2030

7.5 Threat of substitutes

Threat of substitutes - Impact of key factors in 2025 and 2030

7.6 Threat of rivalry

Threat of rivalry - Impact of key factors in 2025 and 2030

7.7 Market condition

Chart on Market condition - Five forces 2025 and 2030

8. Market Segmentation by Type

8.1 Market segments

Chart on Type - Market share 2025-2030 (%)
Data Table on Type - Market share 2025-2030 (%)

8.2 Comparison by Type

Chart on Comparison by Type
Data Table on Comparison by Type

8.3 Liquid immersed - Market size and forecast 2025-2030

Chart on Liquid immersed - Market size and forecast 2025-2030 ($ million)
Data Table on Liquid immersed - Market size and forecast 2025-2030 ($ million)
Chart on Liquid immersed - Year-over-year growth 2025-2030 (%)
Data Table on Liquid immersed - Year-over-year growth 2025-2030 (%)

8.4 Dry type - Market size and forecast 2025-2030

Chart on Dry type - Market size and forecast 2025-2030 ($ million)
Data Table on Dry type - Market size and forecast 2025-2030 ($ million)
Chart on Dry type - Year-over-year growth 2025-2030 (%)
Data Table on Dry type - Year-over-year growth 2025-2030 (%)

8.5 Market opportunity by Type

Market opportunity by Type ($ million)
Data Table on Market opportunity by Type ($ million)

9. Market Segmentation by End-user

9.1 Market segments

Chart on End-user - Market share 2025-2030 (%)
Data Table on End-user - Market share 2025-2030 (%)

9.2 Comparison by End-user

Chart on Comparison by End-user
Data Table on Comparison by End-user

9.3 Commercial power - Market size and forecast 2025-2030

Chart on Commercial power - Market size and forecast 2025-2030 ($ million)
Data Table on Commercial power - Market size and forecast 2025-2030 ($ million)
Chart on Commercial power - Year-over-year growth 2025-2030 (%)
Data Table on Commercial power - Year-over-year growth 2025-2030 (%)

9.4 Residential power - Market size and forecast 2025-2030

Chart on Residential power - Market size and forecast 2025-2030 ($ million)
Data Table on Residential power - Market size and forecast 2025-2030 ($ million)
Chart on Residential power - Year-over-year growth 2025-2030 (%)
Data Table on Residential power - Year-over-year growth 2025-2030 (%)

9.5 Industrial power - Market size and forecast 2025-2030

Chart on Industrial power - Market size and forecast 2025-2030 ($ million)
Data Table on Industrial power - Market size and forecast 2025-2030 ($ million)
Chart on Industrial power - Year-over-year growth 2025-2030 (%)
Data Table on Industrial power - Year-over-year growth 2025-2030 (%)

9.6 Market opportunity by End-user

Market opportunity by End-user ($ million)
Data Table on Market opportunity by End-user ($ million)

10. Market Segmentation by Product Type

10.1 Market segments

Chart on Product Type - Market share 2025-2030 (%)
Data Table on Product Type - Market share 2025-2030 (%)

10.2 Comparison by Product Type

Chart on Comparison by Product Type
Data Table on Comparison by Product Type

10.3 Shell - Market size and forecast 2025-2030

Chart on Shell - Market size and forecast 2025-2030 ($ million)
Data Table on Shell - Market size and forecast 2025-2030 ($ million)
Chart on Shell - Year-over-year growth 2025-2030 (%)
Data Table on Shell - Year-over-year growth 2025-2030 (%)

10.4 Closed - Market size and forecast 2025-2030

Chart on Closed - Market size and forecast 2025-2030 ($ million)
Data Table on Closed - Market size and forecast 2025-2030 ($ million)
Chart on Closed - Year-over-year growth 2025-2030 (%)
Data Table on Closed - Year-over-year growth 2025-2030 (%)

10.5 Berry - Market size and forecast 2025-2030

Chart on Berry - Market size and forecast 2025-2030 ($ million)
Data Table on Berry - Market size and forecast 2025-2030 ($ million)
Chart on Berry - Year-over-year growth 2025-2030 (%)
Data Table on Berry - Year-over-year growth 2025-2030 (%)

10.6 Market opportunity by Product Type

Market opportunity by Product Type ($ million)
Data Table on Market opportunity by Product Type ($ million)

11. Customer Landscape

11.1 Customer landscape overview

Analysis of price sensitivity, lifecycle, customer purchase basket, adoption rates, and purchase criteria

12. Geographic Landscape

12.1 Geographic segmentation

Chart on Market share by geography 2025-2030 (%)
Data Table on Market share by geography 2025-2030 (%)

12.2 Geographic comparison

Chart on Geographic comparison
Data Table on Geographic comparison

12.3 APAC - Market size and forecast 2025-2030

Chart on APAC - Market size and forecast 2025-2030 ($ million)
Data Table on APAC - Market size and forecast 2025-2030 ($ million)
Chart on APAC - Year-over-year growth 2025-2030 (%)
Data Table on APAC - Year-over-year growth 2025-2030 (%)
Chart on Regional Comparison - APAC
Data Table on Regional Comparison - APAC

12.3.1 China - Market size and forecast 2025-2030

Chart on China - Market size and forecast 2025-2030 ($ million)
Data Table on China - Market size and forecast 2025-2030 ($ million)
Chart on China - Year-over-year growth 2025-2030 (%)
Data Table on China - Year-over-year growth 2025-2030 (%)

12.3.2 India - Market size and forecast 2025-2030

Chart on India - Market size and forecast 2025-2030 ($ million)
Data Table on India - Market size and forecast 2025-2030 ($ million)
Chart on India - Year-over-year growth 2025-2030 (%)
Data Table on India - Year-over-year growth 2025-2030 (%)

12.3.3 Japan - Market size and forecast 2025-2030

Chart on Japan - Market size and forecast 2025-2030 ($ million)
Data Table on Japan - Market size and forecast 2025-2030 ($ million)
Chart on Japan - Year-over-year growth 2025-2030 (%)
Data Table on Japan - Year-over-year growth 2025-2030 (%)

12.3.4 South Korea - Market size and forecast 2025-2030

Chart on South Korea - Market size and forecast 2025-2030 ($ million)
Data Table on South Korea - Market size and forecast 2025-2030 ($ million)
Chart on South Korea - Year-over-year growth 2025-2030 (%)
Data Table on South Korea - Year-over-year growth 2025-2030 (%)

12.3.5 Australia - Market size and forecast 2025-2030

Chart on Australia - Market size and forecast 2025-2030 ($ million)
Data Table on Australia - Market size and forecast 2025-2030 ($ million)
Chart on Australia - Year-over-year growth 2025-2030 (%)
Data Table on Australia - Year-over-year growth 2025-2030 (%)

12.3.6 Indonesia - Market size and forecast 2025-2030

Chart on Indonesia - Market size and forecast 2025-2030 ($ million)
Data Table on Indonesia - Market size and forecast 2025-2030 ($ million)
Chart on Indonesia - Year-over-year growth 2025-2030 (%)
Data Table on Indonesia - Year-over-year growth 2025-2030 (%)

12.4 Europe - Market size and forecast 2025-2030

Chart on Europe - Market size and forecast 2025-2030 ($ million)
Data Table on Europe - Market size and forecast 2025-2030 ($ million)
Chart on Europe - Year-over-year growth 2025-2030 (%)
Data Table on Europe - Year-over-year growth 2025-2030 (%)
Chart on Regional Comparison - Europe
Data Table on Regional Comparison - Europe

12.4.1 Germany - Market size and forecast 2025-2030

Chart on Germany - Market size and forecast 2025-2030 ($ million)
Data Table on Germany - Market size and forecast 2025-2030 ($ million)
Chart on Germany - Year-over-year growth 2025-2030 (%)
Data Table on Germany - Year-over-year growth 2025-2030 (%)

12.4.2 France - Market size and forecast 2025-2030

Chart on France - Market size and forecast 2025-2030 ($ million)
Data Table on France - Market size and forecast 2025-2030 ($ million)
Chart on France - Year-over-year growth 2025-2030 (%)
Data Table on France - Year-over-year growth 2025-2030 (%)

12.4.3 UK - Market size and forecast 2025-2030

Chart on UK - Market size and forecast 2025-2030 ($ million)
Data Table on UK - Market size and forecast 2025-2030 ($ million)
Chart on UK - Year-over-year growth 2025-2030 (%)
Data Table on UK - Year-over-year growth 2025-2030 (%)

12.4.4 Italy - Market size and forecast 2025-2030

Chart on Italy - Market size and forecast 2025-2030 ($ million)
Data Table on Italy - Market size and forecast 2025-2030 ($ million)
Chart on Italy - Year-over-year growth 2025-2030 (%)
Data Table on Italy - Year-over-year growth 2025-2030 (%)

12.4.5 Spain - Market size and forecast 2025-2030

Chart on Spain - Market size and forecast 2025-2030 ($ million)
Data Table on Spain - Market size and forecast 2025-2030 ($ million)
Chart on Spain - Year-over-year growth 2025-2030 (%)
Data Table on Spain - Year-over-year growth 2025-2030 (%)

12.4.6 The Netherlands - Market size and forecast 2025-2030

Chart on The Netherlands - Market size and forecast 2025-2030 ($ million)
Data Table on The Netherlands - Market size and forecast 2025-2030 ($ million)
Chart on The Netherlands - Year-over-year growth 2025-2030 (%)
Data Table on The Netherlands - Year-over-year growth 2025-2030 (%)

12.5 Middle East and Africa - Market size and forecast 2025-2030

Chart on Middle East and Africa - Market size and forecast 2025-2030 ($ million)
Data Table on Middle East and Africa - Market size and forecast 2025-2030 ($ million)
Chart on Middle East and Africa - Year-over-year growth 2025-2030 (%)
Data Table on Middle East and Africa - Year-over-year growth 2025-2030 (%)
Chart on Regional Comparison - Middle East and Africa
Data Table on Regional Comparison - Middle East and Africa

12.5.1 Saudi Arabia - Market size and forecast 2025-2030

Chart on Saudi Arabia - Market size and forecast 2025-2030 ($ million)
Data Table on Saudi Arabia - Market size and forecast 2025-2030 ($ million)
Chart on Saudi Arabia - Year-over-year growth 2025-2030 (%)
Data Table on Saudi Arabia - Year-over-year growth 2025-2030 (%)

12.5.2 UAE - Market size and forecast 2025-2030

Chart on UAE - Market size and forecast 2025-2030 ($ million)
Data Table on UAE - Market size and forecast 2025-2030 ($ million)
Chart on UAE - Year-over-year growth 2025-2030 (%)
Data Table on UAE - Year-over-year growth 2025-2030 (%)

12.5.3 South Africa - Market size and forecast 2025-2030

Chart on South Africa - Market size and forecast 2025-2030 ($ million)
Data Table on South Africa - Market size and forecast 2025-2030 ($ million)
Chart on South Africa - Year-over-year growth 2025-2030 (%)
Data Table on South Africa - Year-over-year growth 2025-2030 (%)

12.5.4 Egypt - Market size and forecast 2025-2030

Chart on Egypt - Market size and forecast 2025-2030 ($ million)
Data Table on Egypt - Market size and forecast 2025-2030 ($ million)
Chart on Egypt - Year-over-year growth 2025-2030 (%)
Data Table on Egypt - Year-over-year growth 2025-2030 (%)

12.5.5 Turkey - Market size and forecast 2025-2030

Chart on Turkey - Market size and forecast 2025-2030 ($ million)
Data Table on Turkey - Market size and forecast 2025-2030 ($ million)
Chart on Turkey - Year-over-year growth 2025-2030 (%)
Data Table on Turkey - Year-over-year growth 2025-2030 (%)

12.6 North America - Market size and forecast 2025-2030

Chart on North America - Market size and forecast 2025-2030 ($ million)
Data Table on North America - Market size and forecast 2025-2030 ($ million)
Chart on North America - Year-over-year growth 2025-2030 (%)
Data Table on North America - Year-over-year growth 2025-2030 (%)
Chart on Regional Comparison - North America
Data Table on Regional Comparison - North America

12.6.1 US - Market size and forecast 2025-2030

Chart on US - Market size and forecast 2025-2030 ($ million)
Data Table on US - Market size and forecast 2025-2030 ($ million)
Chart on US - Year-over-year growth 2025-2030 (%)
Data Table on US - Year-over-year growth 2025-2030 (%)

12.6.2 Canada - Market size and forecast 2025-2030

Chart on Canada - Market size and forecast 2025-2030 ($ million)
Data Table on Canada - Market size and forecast 2025-2030 ($ million)
Chart on Canada - Year-over-year growth 2025-2030 (%)
Data Table on Canada - Year-over-year growth 2025-2030 (%)

12.6.3 Mexico - Market size and forecast 2025-2030

Chart on Mexico - Market size and forecast 2025-2030 ($ million)
Data Table on Mexico - Market size and forecast 2025-2030 ($ million)
Chart on Mexico - Year-over-year growth 2025-2030 (%)
Data Table on Mexico - Year-over-year growth 2025-2030 (%)

12.7 South America - Market size and forecast 2025-2030

Chart on South America - Market size and forecast 2025-2030 ($ million)
Data Table on South America - Market size and forecast 2025-2030 ($ million)
Chart on South America - Year-over-year growth 2025-2030 (%)
Data Table on South America - Year-over-year growth 2025-2030 (%)
Chart on Regional Comparison - South America
Data Table on Regional Comparison - South America

12.7.1 Brazil - Market size and forecast 2025-2030

Chart on Brazil - Market size and forecast 2025-2030 ($ million)
Data Table on Brazil - Market size and forecast 2025-2030 ($ million)
Chart on Brazil - Year-over-year growth 2025-2030 (%)
Data Table on Brazil - Year-over-year growth 2025-2030 (%)

12.7.2 Argentina - Market size and forecast 2025-2030

Chart on Argentina - Market size and forecast 2025-2030 ($ million)
Data Table on Argentina - Market size and forecast 2025-2030 ($ million)
Chart on Argentina - Year-over-year growth 2025-2030 (%)
Data Table on Argentina - Year-over-year growth 2025-2030 (%)

12.7.3 Chile - Market size and forecast 2025-2030

Chart on Chile - Market size and forecast 2025-2030 ($ million)
Data Table on Chile - Market size and forecast 2025-2030 ($ million)
Chart on Chile - Year-over-year growth 2025-2030 (%)
Data Table on Chile - Year-over-year growth 2025-2030 (%)

12.8 Market opportunity by geography

Market opportunity by geography ($ million)
Data Tables on Market opportunity by geography ($ million)

13. Drivers, Challenges, and Opportunity

13.1 Market drivers

Imperative for modernization and replacement of aging grid infrastructure
Accelerated integration of renewable energy sources
Rising global electricity consumption and industrial expansion

13.2 Market challenges

Pervasive volatility in raw material pricing and supply chain instability
High initial cost and capital intensive nature of investment
Latent threat of corrosive sulfur in transformer oil

13.3 Impact of drivers and challenges

Impact of drivers and challenges in 2025 and 2030

13.4 Market opportunities

Growing emphasis on grid resilience and decentralization
Technological advancements and pursuit of efficiency and sustainability
Proliferation of specialized applications and high-growth end-use sectors

14. Competitive Landscape

14.1 Overview

14.2

Overview on criticality of inputs and factors of differentiation

14.3 Landscape disruption

Overview on factors of disruption

14.4 Industry risks

Impact of key risks on business

15. Competitive Analysis

15.1 Companies profiled

Companies covered

15.2 Company ranking index

15.3 Market positioning of companies

Matrix on companies position and classification

15.4 ALTRAFO Srl

ALTRAFO Srl - Overview
ALTRAFO Srl - Product / Service
ALTRAFO Srl - Key offerings
SWOT

15.5 Altro Transformers Pty. Ltd.

Altro Transformers Pty. Ltd. - Overview
Altro Transformers Pty. Ltd. - Product / Service
Altro Transformers Pty. Ltd. - Key offerings
SWOT

15.6 CG Power and Industrial Ltd.

CG Power and Industrial Ltd. - Overview
CG Power and Industrial Ltd. - Business segments
CG Power and Industrial Ltd. - Key offerings
CG Power and Industrial Ltd. - Segment focus
SWOT

15.7 Eaton Corp. Plc

Eaton Corp. Plc - Overview
Eaton Corp. Plc - Business segments
Eaton Corp. Plc - Key news
Eaton Corp. Plc - Key offerings
Eaton Corp. Plc - Segment focus
SWOT

15.8 Fuji Electric Co. Ltd.

Fuji Electric Co. Ltd. - Overview
Fuji Electric Co. Ltd. - Business segments
Fuji Electric Co. Ltd. - Key news
Fuji Electric Co. Ltd. - Key offerings
Fuji Electric Co. Ltd. - Segment focus
SWOT

15.9 GE Vernova Inc.

GE Vernova Inc. - Overview
GE Vernova Inc. - Business segments
GE Vernova Inc. - Key offerings
GE Vernova Inc. - Segment focus
SWOT

15.10 Hammond Power Inc.

Hammond Power Inc. - Overview
Hammond Power Inc. - Product / Service
Hammond Power Inc. - Key offerings
SWOT

15.11 HD Hyundai Electric Co. Ltd.

HD Hyundai Electric Co. Ltd. - Overview
HD Hyundai Electric Co. Ltd. - Business segments
HD Hyundai Electric Co. Ltd. - Key offerings
HD Hyundai Electric Co. Ltd. - Segment focus
SWOT

15.12 Hitachi Energy Ltd.

Hitachi Energy Ltd. - Overview
Hitachi Energy Ltd. - Product / Service
Hitachi Energy Ltd. - Key offerings
SWOT

15.13 Layer Electronics Srl

Layer Electronics Srl - Overview
Layer Electronics Srl - Product / Service
Layer Electronics Srl - Key offerings
SWOT

15.14 MGM Transformer Co.

MGM Transformer Co. - Overview
MGM Transformer Co. - Product / Service
MGM Transformer Co. - Key offerings
SWOT

15.15 Mitsubishi Electric Corp.

Mitsubishi Electric Corp. - Overview
Mitsubishi Electric Corp. - Business segments
Mitsubishi Electric Corp. - Key offerings
Mitsubishi Electric Corp. - Segment focus
SWOT

15.16 Schneider Electric SE

Schneider Electric SE - Overview
Schneider Electric SE - Business segments
Schneider Electric SE - Key news
Schneider Electric SE - Key offerings
Schneider Electric SE - Segment focus
SWOT

15.17 Siemens Energy AG

Siemens Energy AG - Overview
Siemens Energy AG - Business segments
Siemens Energy AG - Key news
Siemens Energy AG - Key offerings
Siemens Energy AG - Segment focus
SWOT

15.18 Southern Electronic Services

Southern Electronic Services - Overview
Southern Electronic Services - Product / Service
Southern Electronic Services - Key offerings
SWOT

16. Appendix

16.1 Scope of the report

Market definition
Objectives
Notes and caveats

16.2 Inclusions and exclusions checklist

Inclusions checklist
Exclusions checklist

16.3 Currency conversion rates for US$

16.4 Research methodology

16.5 Data procurement

Information sources

16.6 Data validation

16.7 Validation techniques employed for market sizing

16.8 Data synthesis

16.9 360 degree market analysis

16.10 List of abbreviations

Research Methodology

Technavio presents a detailed picture of the market by way of study, synthesis, and summation of data from multiple sources. The analysts have presented the various facets of the market with a particular focus on identifying the key industry influencers. The data thus presented is comprehensive, reliable, and the result of extensive research, both primary and secondary.

INFORMATION SOURCES

Primary sources

  • Manufacturers and suppliers
  • Channel partners
  • Industry experts
  • Strategic decision makers

Secondary sources

  • Industry journals and periodicals
  • Government data
  • Financial reports of key industry players
  • Historical data
  • Press releases

DATA ANALYSIS

Data Synthesis

  • Collation of data
  • Estimation of key figures
  • Analysis of derived insights

Data Validation

  • Triangulation with data models
  • Reference against proprietary databases
  • Corroboration with industry experts

REPORT WRITING

Qualitative

  • Market drivers
  • Market challenges
  • Market trends
  • Five forces analysis

Quantitative

  • Market size and forecast
  • Market segmentation
  • Geographical insights
  • Competitive landscape

Interested in this report?

Get your sample now to see our research methodology and insights!

Download Now

Frequently Asked Questions

Power Transformers market growth will increase by USD 14291.4 million during 2026-2030.

The Power Transformers market is expected to grow at a CAGR of 6.4% during 2026-2030.

Power Transformers market is segmented by Type (Liquid immersed, Dry type) End-user (Commercial power, Residential power, Industrial power) Product type (Shell, Closed, Berry)

ALTRAFO Srl, Altro Transformers Pty. Ltd., CG Power and Industrial Ltd., Eaton Corp. Plc, ETEL TRANSFORMERS PTY LTD., Fuji Electric Co. Ltd., GE Vernova Inc., Hammond Power Inc., HD Hyundai Electric Co. Ltd., Hitachi Energy Ltd., Layer Electronics Srl, META POWER SOLUTION LLC, MGM Transformer Co., Mitsubishi Electric Corp., Schneider Electric SE, Siemens Energy AG, Southern Electronic Services, Triad Magnetics, Tyree Industries, Wilson Power Solutions India are a few of the key vendors in the Power Transformers market.

APAC will register the highest growth rate of 37.7% among the other regions. Therefore, the Power Transformers market in APAC is expected to garner significant business opportunities for the vendors during the forecast period.

China, India, Japan, South Korea, Australia, Indonesia, Germany, France, UK, Italy, Spain, The Netherlands, Saudi Arabia, UAE, South Africa, Egypt, Turkey, US, Canada, Mexico, Brazil, Argentina, Chile

  • Imperative for modernization and replacement of aging grid infrastructure is the driving factor this market.

The Power Transformers market vendors should focus on grabbing business opportunities from the Type segment as it accounted for the largest market share in the base year.
RIA - Research AI Assistant
Ask RIA