Silicon Carbide (sic) Market Analysis, Size, and Forecast 2026-2030: APAC (China, Japan, and South Korea), North America (US, Canada, and Mexico), Europe (Germany, France, and UK), South America (Brazil and Argentina), Middle East and Africa (Saudi Arabia, UAE, and South Africa), and Rest of World (ROW)

Silicon Carbide (sic) Market Analysis, Size, and Forecast 2026-2030:
APAC (China, Japan, and South Korea), North America (US, Canada, and Mexico), Europe (Germany, France, and UK), South America (Brazil and Argentina), Middle East and Africa (Saudi Arabia, UAE, and South Africa), and Rest of World (ROW)

Published: Apr 2026 322 Pages SKU: IRTNTR75684

Market Overview at a Glance

$18.07 B
Market Opportunity
42.2%
CAGR 2025 - 2030
53.4%
APAC Growth
$1.06 B
Power electronics segment 2024

Silicon Carbide (sic) Market Size 2026-2030

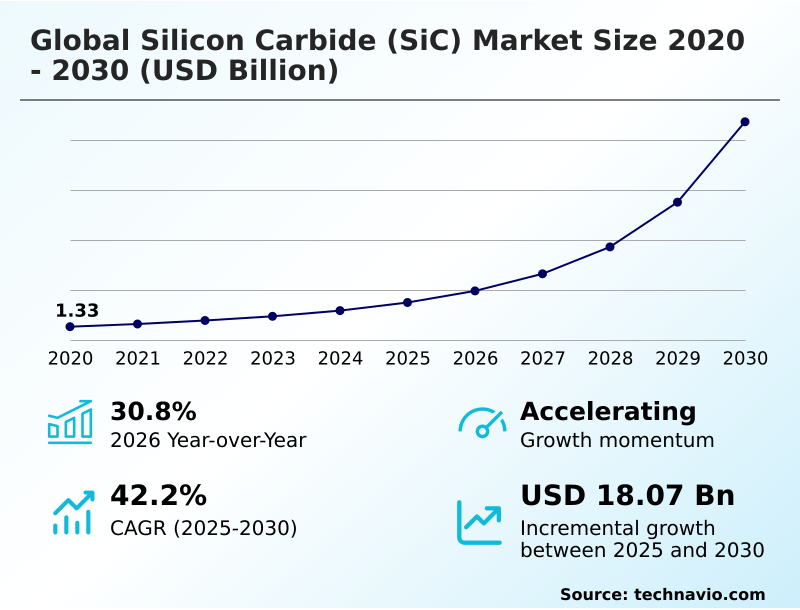
The silicon carbide (sic) market size is valued to increase by USD 18.07 billion, at a CAGR of 42.2% from 2025 to 2030. Transition toward eight-inch wafer manufacturing for economies of scale will drive the silicon carbide (sic) market.

Major Market Trends & Insights

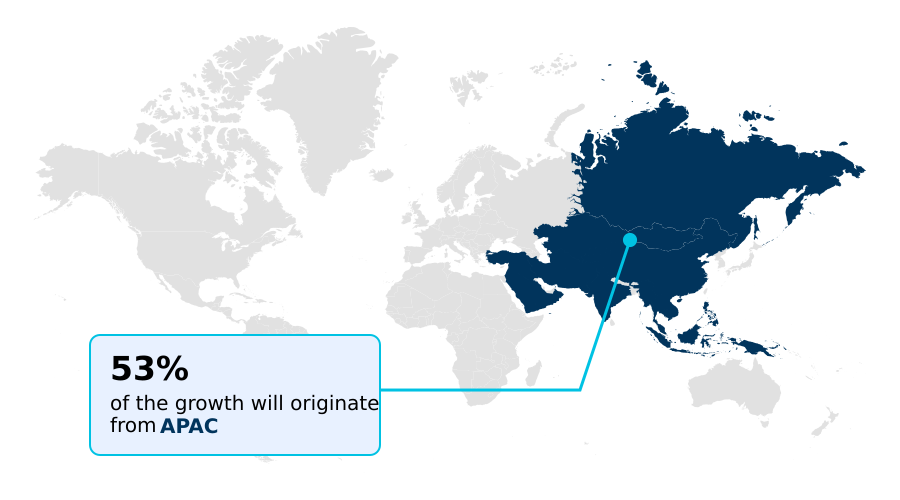
  • APAC dominated the market and accounted for a 53.4% growth during the forecast period.
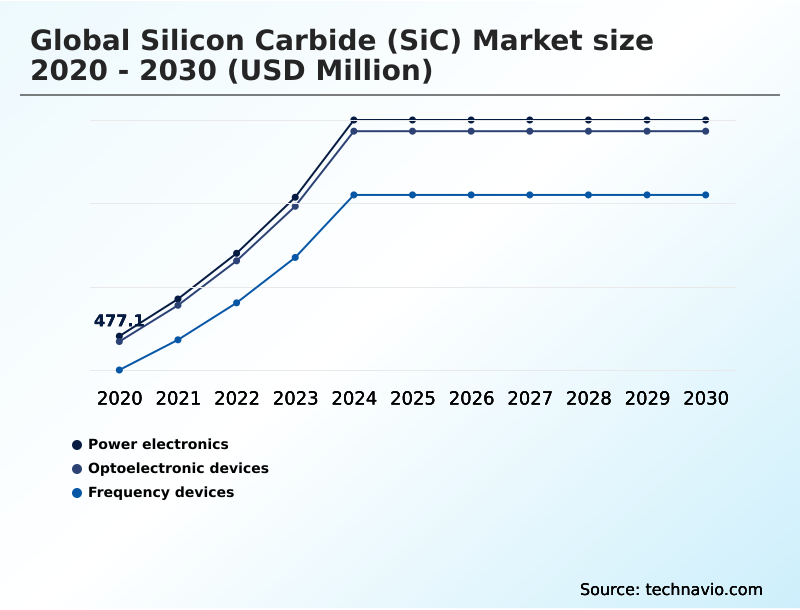
  • By Product - Power electronics segment was valued at USD 1.06 billion in 2024
  • By Application - Automotive segment accounted for the largest market revenue share in 2024

Market Size & Forecast

  • Market Opportunities: USD 20.50 billion
  • Market Future Opportunities: USD 18.07 billion
  • CAGR from 2025 to 2030 : 42.2%

Market Summary

  • The Silicon Carbide (SiC) market is undergoing a pivotal transformation, fundamentally reshaping power management across multiple industries. This shift is characterized by the replacement of traditional silicon with advanced wide-bandgap semiconductor materials to meet the escalating demands for higher energy efficiency, power density, and thermal performance.
  • Key applications in electric vehicles, such as traction inverters and onboard chargers, leverage SiC's capabilities to extend driving range and accelerate charging times. Similarly, the renewable energy sector utilizes SiC-based photovoltaic inverters for more effective energy harvesting.
  • A critical operational consideration for businesses is supply chain resilience; for example, an automotive original equipment manufacturer must secure a stable substrate supply of high-quality SiC wafers to avoid production delays. This involves navigating challenges in crystal growth and wafer fabrication, where the transition to 200mm wafer production is crucial for achieving economies of scale.
  • The inherent material properties of SiC enable the development of more compact and efficient power modules, driving innovation in industrial automation and electrical grid modernization.

What will be the Size of the Silicon Carbide (sic) Market during the forecast period?

Get Key Insights on Market Forecast (PDF) Request Free Sample

How is the Silicon Carbide (sic) Market Segmented?

The silicon carbide (sic) industry research report provides comprehensive data (region-wise segment analysis), with forecasts and estimates in "USD million" for the period 2026-2030, as well as historical data from 2020-2024 for the following segments.

  • Product
    • Power electronics
    • Optoelectronic devices
    • Frequency devices
  • Application
    • Automotive
    • Energy and power
    • Aerospace and defense
    • Data and communication devices
    • Others
  • Device
    • SiC discrete device
    • SiC module
  • Measurement
    • Up to 150mm
    • Greater than 150mm
  • Geography
    • APAC
      • China
      • Japan
      • South Korea
    • North America
      • US
      • Canada
      • Mexico
    • Europe
      • Germany
      • France
      • UK
    • South America
      • Brazil
      • Argentina
    • Middle East and Africa
      • Saudi Arabia
      • UAE
      • South Africa
    • Rest of World (ROW)

By Product Insights

The power electronics segment is estimated to witness significant growth during the forecast period.

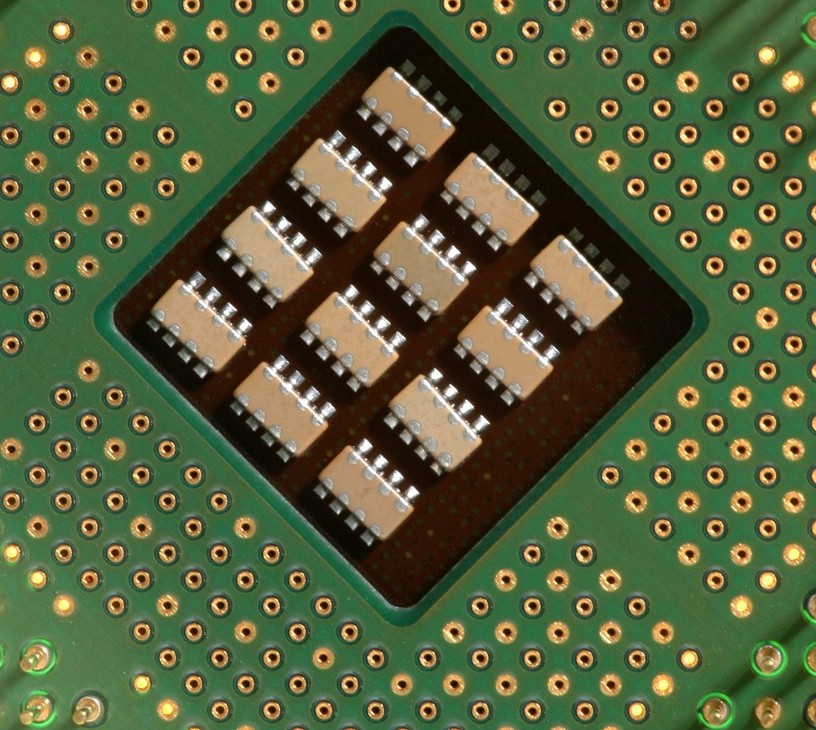
The power electronics segment is pivotal, driven by the need for enhanced energy conversion efficiency. This involves the use of wide-bandgap semiconductor devices like MOSFETs and Schottky barrier diodes, which offer superior performance over silicon, particularly in high-voltage architecture.

These components are critical for automotive traction inverters and photovoltaic inverters, where they enable greater driving ranges and improved energy harvesting. The focus is on reducing switching losses and improving power density.

For instance, optimized integrated gate drivers can lead to a 12% improvement in energy throughput.

The ongoing shift toward advanced ceramic materials and better heat dissipation techniques is also central to this segment, ensuring reliability in demanding industrial automation and high-performance computing environments.

Request Free Sample

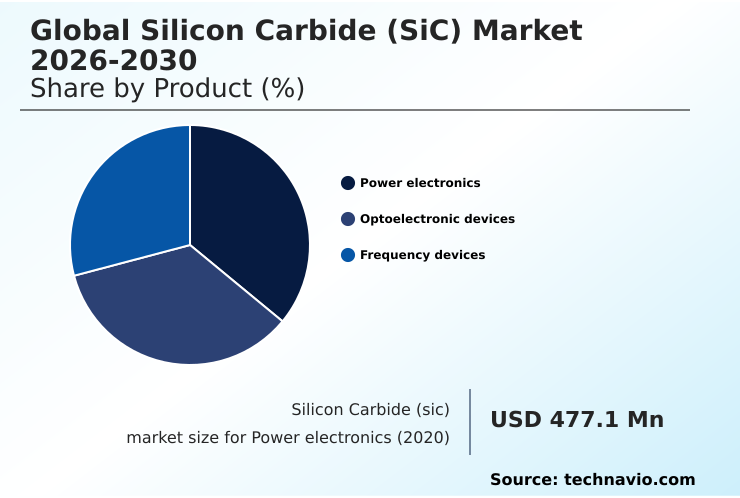
The Power electronics segment was valued at USD 1.06 billion in 2024 and showed a gradual increase during the forecast period.

Request Free Sample

Regional Analysis

APAC is estimated to contribute 53.4% to the growth of the global market during the forecast period.Technavio’s analysts have elaborately explained the regional trends and drivers that shape the market during the forecast period.

See How Silicon Carbide (sic) Market Demand is Rising in APAC Request Free Sample

The geographic landscape is dominated by APAC, which is projected to account for over 53% of the incremental market expansion, significantly outpacing North America's 16% share.

This growth is fueled by massive investments in semiconductor manufacturing and the region's central role in the electric vehicle supply chain. China, in particular, drives demand for traction inverters and power modules.

In contrast, North America and Europe focus on high-value applications and technological innovation, including electrical grid modernization and advanced R&D in wafer fabrication.

The emphasis in these regions is on enhancing substrate supply security and improving yield improvement in 200mm wafer production, which is critical for maintaining a competitive edge in the global power semiconductor race.

This regional dynamic highlights a global market structured around high-volume production in one area and specialized, high-performance development in others.

Market Dynamics

Our researchers analyzed the data with 2025 as the base year, along with the key drivers, trends, and challenges. A holistic analysis of drivers will help companies refine their marketing strategies to gain a competitive advantage.

  • The strategic evaluation of silicon carbide vs gallium nitride applications is a central theme, as enterprises determine the optimal technology for their specific needs. For high-voltage, high-power systems like electric vehicle powertrains, the power density advantages of SiC are clear, making it the preferred choice.
  • The cost-benefit of SiC inverters becomes particularly compelling when considering long-term operational savings from enhanced efficiency. However, a primary hurdle remains: the challenges in large-diameter SiC crystal growth, which directly impact manufacturing costs and scalability. Consequently, a great deal of focus is on improving yield in 200mm SiC wafers to make the technology more accessible.
  • Effective thermal management in SiC power modules is another critical area, as it dictates device longevity and performance, with advancements in this area directly correlating to a vehicle's reliability. The impact of SiC on EV charging speed is profound, with 800-volt systems enabling ultra-fast charging capabilities that reduce consumer range anxiety.
  • As the industry matures, SiC for renewable energy grid integration is set to expand, driven by the need for more efficient and resilient power grids. For mission-critical sectors, the role of SiC in aerospace power systems highlights its robustness. Meanwhile, the growing energy demands of hyperscale facilities make SiC in high-power AI data centers a non-negotiable path toward sustainability.
  • All these applications hinge on stringent reliability testing for automotive SiC modules and robust SiC supply chain risk mitigation strategies to ensure market stability.

What are the key market drivers leading to the rise in the adoption of Silicon Carbide (sic) Industry?

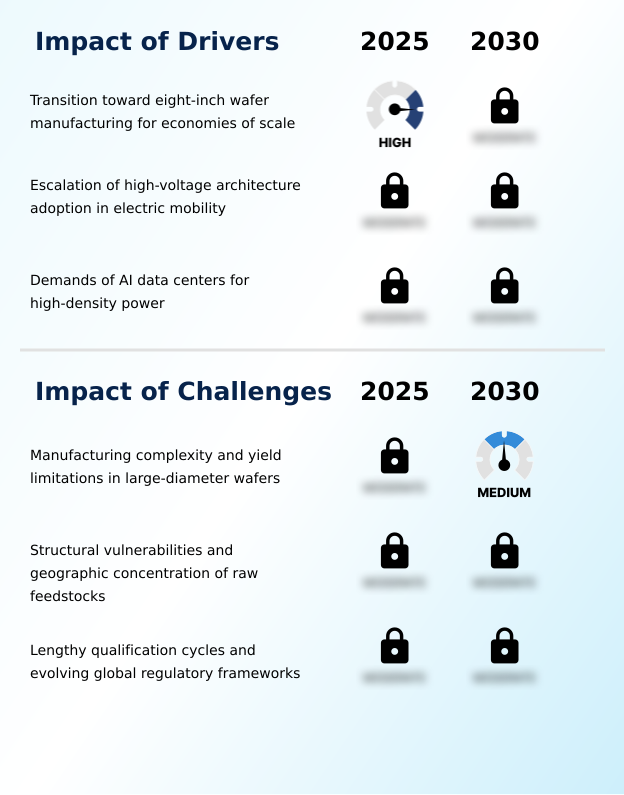
  • The transition toward eight-inch wafer manufacturing to achieve economies of scale is a key driver for the market, aiming to reduce costs and increase throughput.

  • A primary driver is the industry's aggressive push toward 200mm wafer production, which is essential for achieving economies of scale and reducing the per-die cost of power modules.
  • This transition enables manufacturers to meet the escalating demand from the automotive sector for affordable traction inverters.
  • The shift to an 800-volt electrical architecture in new electric vehicles mandates the use of SiC MOSFETs to achieve faster charging and extended range, with some platforms realizing a 10% gain in overall powertrain efficiency.
  • This automotive-led demand is bolstered by requirements from smart grid infrastructure, where SiC's ability to handle high voltages improves grid stability and performance.
  • The continuous refinement of wafer fabrication and epitaxial growth processes is critical to lowering costs and accelerating the displacement of silicon.

What are the market trends shaping the Silicon Carbide (sic) Industry?

  • A significant market trend is the surge in advanced power architectures for AI data centers. This is driving demand for high-efficiency power management solutions capable of handling increased power densities.

  • Market trends are increasingly shaped by the electrification of heavy industry and the rise of high-density power architectures for AI data centers. The transition to high-voltage architecture in industrial automation and mining machinery is driving demand for robust power semiconductor devices capable of operating in harsh environments.
  • This trend is complemented by the surge in high-performance computing, where SiC-based power supply units offer superior energy conversion efficiency, reducing operational costs. For example, data centers adopting these technologies have reported up to a 20% reduction in cooling energy consumption. The focus on developing advanced ceramic materials and improving heat dissipation allows for more compact and reliable systems.
  • These developments are paving the way for wider adoption in solid-state transformers and other grid-scale energy storage applications.

What challenges does the Silicon Carbide (sic) Industry face during its growth?

  • Manufacturing complexity and yield limitations associated with large-diameter wafers present a key challenge to industry growth, impacting production costs and scalability.

  • A significant challenge remains the manufacturing complexity and low yield rates associated with large-diameter wafer fabrication. The inherent difficulty in the crystal growth of SiC leads to a higher incidence of micropipe defects and basal plane dislocations, which limits the usable die per wafer and keeps costs high.
  • This issue is particularly acute in the transition to 200mm substrates, where process stability issues can lead to yield rates for automotive-grade devices remaining below 60%. Furthermore, the supply chain is vulnerable due to the geographic concentration of high-purity raw material suppliers and the long lead times for specialized equipment like ion implantation tools.
  • These factors create a structural bottleneck that can slow the adoption of SiC in more cost-sensitive industrial motor drives and consumer applications.

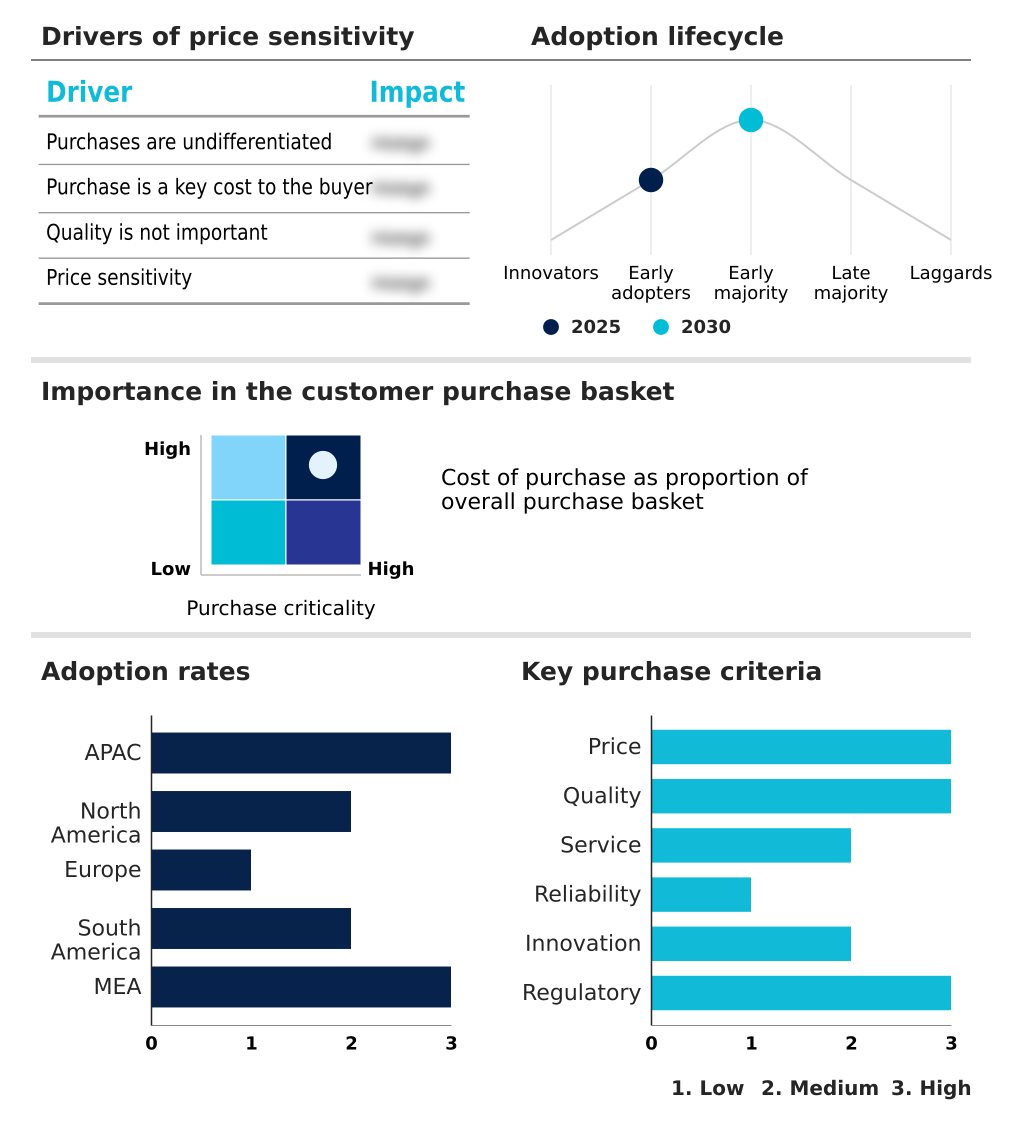
Exclusive Technavio Analysis on Customer Landscape

The silicon carbide (sic) market forecasting report includes the adoption lifecycle of the market, covering from the innovator’s stage to the laggard’s stage. It focuses on adoption rates in different regions based on penetration. Furthermore, the silicon carbide (sic) market report also includes key purchase criteria and drivers of price sensitivity to help companies evaluate and develop their market growth analysis strategies.

Customer Landscape of Silicon Carbide (sic) Industry

Competitive Landscape

Companies are implementing various strategies, such as strategic alliances, silicon carbide (sic) market forecast, partnerships, mergers and acquisitions, geographical expansion, and product/service launches, to enhance their presence in the industry.

AGSCO Corp. - Key offerings include high-performance silicon carbide abrasives and advanced materials engineered for industrial surface treatment and finishing applications, enhancing durability and precision.

The industry research and growth report includes detailed analyses of the competitive landscape of the market and information about key companies, including:

  • AGSCO Corp.
  • Asuzac Fine Ceramics Co Ltd
  • CeramTec GmbH
  • Compagnie de Saint Gobain SA
  • CoorsTek Inc.
  • Dow Chemical Co.
  • ESD SIC bv
  • ESK SiC GmbH
  • Hongwu International Group Ltd.
  • Imerys S.A.
  • Infineon Technologies AG
  • Kyocera Corp.
  • Mersen Corporate Services SAS
  • Miller and Co.
  • Morgan Advanced Materials
  • Murugappa Group
  • ON Semiconductor Corp.
  • SNAM Abrasives Pvt. Ltd.
  • Tokai Carbon Co. Ltd.
  • Xiamen Powerway Co. Ltd.

Qualitative and quantitative analysis of companies has been conducted to help clients understand the wider business environment as well as the strengths and weaknesses of key industry players. Data is qualitatively analyzed to categorize companies as pure play, category-focused, industry-focused, and diversified; it is quantitatively analyzed to categorize companies as dominant, leading, strong, tentative, and weak.

Recent Development and News in Silicon carbide (sic) market

  • In March 2025, Infineon Technologies AG initiated the volume ramp-up of its 200mm silicon carbide wafer production at its new facility in Kulim, Malaysia, to meet the surging demand from the automotive sector.
  • In January 2025, Wolfspeed Inc. launched a new top-side cooled power module package specifically designed to meet the extreme thermal demands of high-density AI server architectures, enhancing power delivery efficiency.
  • In November 2024, a major joint venture in China announced it had entered the risk production stage for 8-inch automotive-grade SiC wafers, aiming to resolve long-term reliability issues before initiating full-scale manufacturing.
  • In September 2024, onsemi launched a new series of intelligent power modules incorporating proprietary SiC MOSFETs, targeting high-efficiency three-phase industrial motor drives and renewable energy systems.

Dive into Technavio’s robust research methodology, blending expert interviews, extensive data synthesis, and validated models for unparalleled Silicon Carbide (sic) Market insights. See full methodology.

Market Scope
Page number 322
Base year 2025
Historic period 2020-2024
Forecast period 2026-2030
Growth momentum & CAGR Accelerate at a CAGR of 42.2%
Market growth 2026-2030 USD 18069.9 million
Market structure Fragmented
YoY growth 2025-2026(%) 30.8%
Key countries China, Japan, South Korea, India, Australia, Indonesia, US, Canada, Mexico, Germany, France, UK, Italy, Spain, The Netherlands, Brazil, Argentina, Chile, Saudi Arabia, UAE, South Africa, Turkey and Israel
Competitive landscape Leading Companies, Market Positioning of Companies, Competitive Strategies, and Industry Risks

Request Free Sample

Research Analyst Overview

  • The Silicon Carbide (SiC) market's trajectory is defined by the industry-wide strategic shift toward 200mm wafer production, a move critical for reducing the per-die cost and scaling output for mass-market applications. This transition is a key boardroom topic, influencing capital expenditure decisions and long-term supply agreements.
  • Mastering the complexities of crystal growth and epitaxial growth on larger substrates is now the primary benchmark for technological leadership. Companies are focused on yield improvement to make high-performance discrete components and power modules more economically viable.
  • The adoption of SiC is driven by its superior thermal management and energy conversion efficiency, which are indispensable for next-generation electric vehicles and electrical grid modernization. For instance, the use of SiC in high-voltage architecture allows for system designs that are over 20% more compact than their silicon-based predecessors.
  • The success of this wide-bandgap semiconductor technology hinges on securing a resilient substrate supply and advancing semiconductor manufacturing processes to meet the demands of high-frequency devices and power electronics.

What are the Key Data Covered in this Silicon Carbide (sic) Market Research and Growth Report?

  • What is the expected growth of the Silicon Carbide (sic) Market between 2026 and 2030?

    • USD 18.07 billion, at a CAGR of 42.2%

  • What segmentation does the market report cover?

    • The report is segmented by Product (Power electronics, Optoelectronic devices, and Frequency devices), Application (Automotive, Energy and power, Aerospace and defense, Data and communication devices, and Others), Device (SiC discrete device, and SiC module), Measurement (Up to 150mm, and Greater than 150mm) and Geography (APAC, North America, Europe, South America, Middle East and Africa)

  • Which regions are analyzed in the report?

    • APAC, North America, Europe, South America and Middle East and Africa

  • What are the key growth drivers and market challenges?

    • Transition toward eight-inch wafer manufacturing for economies of scale, Manufacturing complexity and yield limitations in large-diameter wafers

  • Who are the major players in the Silicon Carbide (sic) Market?

    • AGSCO Corp., Asuzac Fine Ceramics Co Ltd, CeramTec GmbH, Compagnie de Saint Gobain SA, CoorsTek Inc., Dow Chemical Co., ESD SIC bv, ESK SiC GmbH, Hongwu International Group Ltd., Imerys S.A., Infineon Technologies AG, Kyocera Corp., Mersen Corporate Services SAS, Miller and Co., Morgan Advanced Materials, Murugappa Group, ON Semiconductor Corp., SNAM Abrasives Pvt. Ltd., Tokai Carbon Co. Ltd. and Xiamen Powerway Co. Ltd.

Market Research Insights

  • The market's dynamics are shaped by a strategic push toward high-efficiency power conversion, where the adoption of trench MOSFETs has resulted in a 30% reduction in on-resistance compared to previous generations. This enhancement is critical for applications in industrial motor drives and high-performance computing, where minimizing energy loss is paramount.
  • The successful implementation of physical vapor transport techniques has improved wafer quality, leading to a 15% increase in device reliability under high-stress conditions. Innovations in packaging, such as silver sintering, improve heat dissipation, allowing power supply units to operate at higher capacities without thermal degradation.
  • As a result, systems utilizing advanced SiC components demonstrate a significant improvement in overall power density, enabling more compact and lightweight designs for applications ranging from onboard chargers to smart grid infrastructure, with some systems achieving a 40% smaller footprint.

We can help! Our analysts can customize this silicon carbide (sic) market research report to meet your requirements.

Get in touch

1. Executive Summary

1.1 Market overview

Executive Summary - Chart on Market Overview
Executive Summary - Data Table on Market Overview
Executive Summary - Chart on Global Market Characteristics
Executive Summary - Chart on Market by Geography
Executive Summary - Chart on Market Segmentation by Product
Executive Summary - Chart on Market Segmentation by Application
Executive Summary - Chart on Market Segmentation by Device
Executive Summary - Chart on Market Segmentation by Measurement
Executive Summary - Chart on Incremental Growth
Executive Summary - Data Table on Incremental Growth
Executive Summary - Chart on Company Market Positioning

2. Technavio Analysis

2.1 Analysis of price sensitivity, lifecycle, customer purchase basket, adoption rates, and purchase criteria

2.2 Criticality of inputs and Factors of differentiation

Chart on Overview on criticality of inputs and factors of differentiation

2.3 Factors of disruption

Chart on Overview on factors of disruption

2.4 Impact of drivers and challenges

Chart on Impact of drivers and challenges in 2025 and 2030

3. Market Landscape

3.1 Market ecosystem

Chart on Parent Market
Data Table on - Parent Market

3.2 Market characteristics

Chart on Market characteristics analysis

3.3 Value chain analysis

Chart on Value chain analysis

4. Market Sizing

4.1 Market definition

Data Table on Offerings of companies included in the market definition

4.2 Market segment analysis

Market segments

4.3 Market size 2025

4.4 Market outlook: Forecast for 2025-2030

Chart on Global - Market size and forecast 2025-2030 ($ million)
Data Table on Global - Market size and forecast 2025-2030 ($ million)
Chart on Global Market: Year-over-year growth 2025-2030 (%)
Data Table on Global Market: Year-over-year growth 2025-2030 (%)

5. Historic Market Size

5.1 Global Silicon Carbide (SiC) Market 2020 - 2024

Historic Market Size - Data Table on Global Silicon Carbide (SiC) Market 2020 - 2024 ($ million)

5.2 Product segment analysis 2020 - 2024

Historic Market Size - Product Segment 2020 - 2024 ($ million)

5.3 Application segment analysis 2020 - 2024

Historic Market Size - Application Segment 2020 - 2024 ($ million)

5.4 Device segment analysis 2020 - 2024

Historic Market Size - Device Segment 2020 - 2024 ($ million)

5.5 Measurement segment analysis 2020 - 2024

Historic Market Size - Measurement Segment 2020 - 2024 ($ million)

5.6 Geography segment analysis 2020 - 2024

Historic Market Size - Geography Segment 2020 - 2024 ($ million)

5.7 Country segment analysis 2020 - 2024

Historic Market Size - Country Segment 2020 - 2024 ($ million)

6. Qualitative Analysis

6.1 Impact of AI in global silicon carbide (SiC) market

6.2 Impact of geopolitical conflict on global silicon carbide (SiC) market

7. Five Forces Analysis

7.1 Five forces summary

Five forces analysis - Comparison between 2025 and 2030

7.2 Bargaining power of buyers

Bargaining power of buyers - Impact of key factors 2025 and 2030

7.3 Bargaining power of suppliers

Bargaining power of suppliers - Impact of key factors in 2025 and 2030

7.4 Threat of new entrants

Threat of new entrants - Impact of key factors in 2025 and 2030

7.5 Threat of substitutes

Threat of substitutes - Impact of key factors in 2025 and 2030

7.6 Threat of rivalry

Threat of rivalry - Impact of key factors in 2025 and 2030

7.7 Market condition

Chart on Market condition - Five forces 2025 and 2030

8. Market Segmentation by Product

8.1 Market segments

Chart on Product - Market share 2025-2030 (%)
Data Table on Product - Market share 2025-2030 (%)

8.2 Comparison by Product

Chart on Comparison by Product
Data Table on Comparison by Product

8.3 Power electronics - Market size and forecast 2025-2030

Chart on Power electronics - Market size and forecast 2025-2030 ($ million)
Data Table on Power electronics - Market size and forecast 2025-2030 ($ million)
Chart on Power electronics - Year-over-year growth 2025-2030 (%)
Data Table on Power electronics - Year-over-year growth 2025-2030 (%)

8.4 Optoelectronic devices - Market size and forecast 2025-2030

Chart on Optoelectronic devices - Market size and forecast 2025-2030 ($ million)
Data Table on Optoelectronic devices - Market size and forecast 2025-2030 ($ million)
Chart on Optoelectronic devices - Year-over-year growth 2025-2030 (%)
Data Table on Optoelectronic devices - Year-over-year growth 2025-2030 (%)

8.5 Frequency devices - Market size and forecast 2025-2030

Chart on Frequency devices - Market size and forecast 2025-2030 ($ million)
Data Table on Frequency devices - Market size and forecast 2025-2030 ($ million)
Chart on Frequency devices - Year-over-year growth 2025-2030 (%)
Data Table on Frequency devices - Year-over-year growth 2025-2030 (%)

8.6 Market opportunity by Product

Market opportunity by Product ($ million)
Data Table on Market opportunity by Product ($ million)

9. Market Segmentation by Application

9.1 Market segments

Chart on Application - Market share 2025-2030 (%)
Data Table on Application - Market share 2025-2030 (%)

9.2 Comparison by Application

Chart on Comparison by Application
Data Table on Comparison by Application

9.3 Automotive - Market size and forecast 2025-2030

Chart on Automotive - Market size and forecast 2025-2030 ($ million)
Data Table on Automotive - Market size and forecast 2025-2030 ($ million)
Chart on Automotive - Year-over-year growth 2025-2030 (%)
Data Table on Automotive - Year-over-year growth 2025-2030 (%)

9.4 Energy and power - Market size and forecast 2025-2030

Chart on Energy and power - Market size and forecast 2025-2030 ($ million)
Data Table on Energy and power - Market size and forecast 2025-2030 ($ million)
Chart on Energy and power - Year-over-year growth 2025-2030 (%)
Data Table on Energy and power - Year-over-year growth 2025-2030 (%)

9.5 Aerospace and defense - Market size and forecast 2025-2030

Chart on Aerospace and defense - Market size and forecast 2025-2030 ($ million)
Data Table on Aerospace and defense - Market size and forecast 2025-2030 ($ million)
Chart on Aerospace and defense - Year-over-year growth 2025-2030 (%)
Data Table on Aerospace and defense - Year-over-year growth 2025-2030 (%)

9.6 Data and communication devices - Market size and forecast 2025-2030

Chart on Data and communication devices - Market size and forecast 2025-2030 ($ million)
Data Table on Data and communication devices - Market size and forecast 2025-2030 ($ million)
Chart on Data and communication devices - Year-over-year growth 2025-2030 (%)
Data Table on Data and communication devices - Year-over-year growth 2025-2030 (%)

9.7 Others - Market size and forecast 2025-2030

Chart on Others - Market size and forecast 2025-2030 ($ million)
Data Table on Others - Market size and forecast 2025-2030 ($ million)
Chart on Others - Year-over-year growth 2025-2030 (%)
Data Table on Others - Year-over-year growth 2025-2030 (%)

9.8 Market opportunity by Application

Market opportunity by Application ($ million)
Data Table on Market opportunity by Application ($ million)

10. Market Segmentation by Device

10.1 Market segments

Chart on Device - Market share 2025-2030 (%)
Data Table on Device - Market share 2025-2030 (%)

10.2 Comparison by Device

Chart on Comparison by Device
Data Table on Comparison by Device

10.3 SiC discrete device - Market size and forecast 2025-2030

Chart on SiC discrete device - Market size and forecast 2025-2030 ($ million)
Data Table on SiC discrete device - Market size and forecast 2025-2030 ($ million)
Chart on SiC discrete device - Year-over-year growth 2025-2030 (%)
Data Table on SiC discrete device - Year-over-year growth 2025-2030 (%)

10.4 SiC module - Market size and forecast 2025-2030

Chart on SiC module - Market size and forecast 2025-2030 ($ million)
Data Table on SiC module - Market size and forecast 2025-2030 ($ million)
Chart on SiC module - Year-over-year growth 2025-2030 (%)
Data Table on SiC module - Year-over-year growth 2025-2030 (%)

10.5 Market opportunity by Device

Market opportunity by Device ($ million)
Data Table on Market opportunity by Device ($ million)

11. Market Segmentation by Measurement

11.1 Market segments

Chart on Measurement - Market share 2025-2030 (%)
Data Table on Measurement - Market share 2025-2030 (%)

11.2 Comparison by Measurement

Chart on Comparison by Measurement
Data Table on Comparison by Measurement

11.3 Up to 150mm - Market size and forecast 2025-2030

Chart on Up to 150mm - Market size and forecast 2025-2030 ($ million)
Data Table on Up to 150mm - Market size and forecast 2025-2030 ($ million)
Chart on Up to 150mm - Year-over-year growth 2025-2030 (%)
Data Table on Up to 150mm - Year-over-year growth 2025-2030 (%)

11.4 Greater than 150mm - Market size and forecast 2025-2030

Chart on Greater than 150mm - Market size and forecast 2025-2030 ($ million)
Data Table on Greater than 150mm - Market size and forecast 2025-2030 ($ million)
Chart on Greater than 150mm - Year-over-year growth 2025-2030 (%)
Data Table on Greater than 150mm - Year-over-year growth 2025-2030 (%)

11.5 Market opportunity by Measurement

Market opportunity by Measurement ($ million)
Data Table on Market opportunity by Measurement ($ million)

12. Customer Landscape

12.1 Customer landscape overview

Analysis of price sensitivity, lifecycle, customer purchase basket, adoption rates, and purchase criteria

13. Geographic Landscape

13.1 Geographic segmentation

Chart on Market share by geography 2025-2030 (%)
Data Table on Market share by geography 2025-2030 (%)

13.2 Geographic comparison

Chart on Geographic comparison
Data Table on Geographic comparison

13.3 APAC - Market size and forecast 2025-2030

Chart on APAC - Market size and forecast 2025-2030 ($ million)
Data Table on APAC - Market size and forecast 2025-2030 ($ million)
Chart on APAC - Year-over-year growth 2025-2030 (%)
Data Table on APAC - Year-over-year growth 2025-2030 (%)
Chart on Regional Comparison - APAC
Data Table on Regional Comparison - APAC

13.3.1 China - Market size and forecast 2025-2030

Chart on China - Market size and forecast 2025-2030 ($ million)
Data Table on China - Market size and forecast 2025-2030 ($ million)
Chart on China - Year-over-year growth 2025-2030 (%)
Data Table on China - Year-over-year growth 2025-2030 (%)

13.3.2 Japan - Market size and forecast 2025-2030

Chart on Japan - Market size and forecast 2025-2030 ($ million)
Data Table on Japan - Market size and forecast 2025-2030 ($ million)
Chart on Japan - Year-over-year growth 2025-2030 (%)
Data Table on Japan - Year-over-year growth 2025-2030 (%)

13.3.3 South Korea - Market size and forecast 2025-2030

Chart on South Korea - Market size and forecast 2025-2030 ($ million)
Data Table on South Korea - Market size and forecast 2025-2030 ($ million)
Chart on South Korea - Year-over-year growth 2025-2030 (%)
Data Table on South Korea - Year-over-year growth 2025-2030 (%)

13.3.4 India - Market size and forecast 2025-2030

Chart on India - Market size and forecast 2025-2030 ($ million)
Data Table on India - Market size and forecast 2025-2030 ($ million)
Chart on India - Year-over-year growth 2025-2030 (%)
Data Table on India - Year-over-year growth 2025-2030 (%)

13.3.5 Australia - Market size and forecast 2025-2030

Chart on Australia - Market size and forecast 2025-2030 ($ million)
Data Table on Australia - Market size and forecast 2025-2030 ($ million)
Chart on Australia - Year-over-year growth 2025-2030 (%)
Data Table on Australia - Year-over-year growth 2025-2030 (%)

13.3.6 Indonesia - Market size and forecast 2025-2030

Chart on Indonesia - Market size and forecast 2025-2030 ($ million)
Data Table on Indonesia - Market size and forecast 2025-2030 ($ million)
Chart on Indonesia - Year-over-year growth 2025-2030 (%)
Data Table on Indonesia - Year-over-year growth 2025-2030 (%)

13.4 North America - Market size and forecast 2025-2030

Chart on North America - Market size and forecast 2025-2030 ($ million)
Data Table on North America - Market size and forecast 2025-2030 ($ million)
Chart on North America - Year-over-year growth 2025-2030 (%)
Data Table on North America - Year-over-year growth 2025-2030 (%)
Chart on Regional Comparison - North America
Data Table on Regional Comparison - North America

13.4.1 US - Market size and forecast 2025-2030

Chart on US - Market size and forecast 2025-2030 ($ million)
Data Table on US - Market size and forecast 2025-2030 ($ million)
Chart on US - Year-over-year growth 2025-2030 (%)
Data Table on US - Year-over-year growth 2025-2030 (%)

13.4.2 Canada - Market size and forecast 2025-2030

Chart on Canada - Market size and forecast 2025-2030 ($ million)
Data Table on Canada - Market size and forecast 2025-2030 ($ million)
Chart on Canada - Year-over-year growth 2025-2030 (%)
Data Table on Canada - Year-over-year growth 2025-2030 (%)

13.4.3 Mexico - Market size and forecast 2025-2030

Chart on Mexico - Market size and forecast 2025-2030 ($ million)
Data Table on Mexico - Market size and forecast 2025-2030 ($ million)
Chart on Mexico - Year-over-year growth 2025-2030 (%)
Data Table on Mexico - Year-over-year growth 2025-2030 (%)

13.5 Europe - Market size and forecast 2025-2030

Chart on Europe - Market size and forecast 2025-2030 ($ million)
Data Table on Europe - Market size and forecast 2025-2030 ($ million)
Chart on Europe - Year-over-year growth 2025-2030 (%)
Data Table on Europe - Year-over-year growth 2025-2030 (%)
Chart on Regional Comparison - Europe
Data Table on Regional Comparison - Europe

13.5.1 Germany - Market size and forecast 2025-2030

Chart on Germany - Market size and forecast 2025-2030 ($ million)
Data Table on Germany - Market size and forecast 2025-2030 ($ million)
Chart on Germany - Year-over-year growth 2025-2030 (%)
Data Table on Germany - Year-over-year growth 2025-2030 (%)

13.5.2 France - Market size and forecast 2025-2030

Chart on France - Market size and forecast 2025-2030 ($ million)
Data Table on France - Market size and forecast 2025-2030 ($ million)
Chart on France - Year-over-year growth 2025-2030 (%)
Data Table on France - Year-over-year growth 2025-2030 (%)

13.5.3 UK - Market size and forecast 2025-2030

Chart on UK - Market size and forecast 2025-2030 ($ million)
Data Table on UK - Market size and forecast 2025-2030 ($ million)
Chart on UK - Year-over-year growth 2025-2030 (%)
Data Table on UK - Year-over-year growth 2025-2030 (%)

13.5.4 Italy - Market size and forecast 2025-2030

Chart on Italy - Market size and forecast 2025-2030 ($ million)
Data Table on Italy - Market size and forecast 2025-2030 ($ million)
Chart on Italy - Year-over-year growth 2025-2030 (%)
Data Table on Italy - Year-over-year growth 2025-2030 (%)

13.5.5 Spain - Market size and forecast 2025-2030

Chart on Spain - Market size and forecast 2025-2030 ($ million)
Data Table on Spain - Market size and forecast 2025-2030 ($ million)
Chart on Spain - Year-over-year growth 2025-2030 (%)
Data Table on Spain - Year-over-year growth 2025-2030 (%)

13.5.6 The Netherlands - Market size and forecast 2025-2030

Chart on The Netherlands - Market size and forecast 2025-2030 ($ million)
Data Table on The Netherlands - Market size and forecast 2025-2030 ($ million)
Chart on The Netherlands - Year-over-year growth 2025-2030 (%)
Data Table on The Netherlands - Year-over-year growth 2025-2030 (%)

13.6 South America - Market size and forecast 2025-2030

Chart on South America - Market size and forecast 2025-2030 ($ million)
Data Table on South America - Market size and forecast 2025-2030 ($ million)
Chart on South America - Year-over-year growth 2025-2030 (%)
Data Table on South America - Year-over-year growth 2025-2030 (%)
Chart on Regional Comparison - South America
Data Table on Regional Comparison - South America

13.6.1 Brazil - Market size and forecast 2025-2030

Chart on Brazil - Market size and forecast 2025-2030 ($ million)
Data Table on Brazil - Market size and forecast 2025-2030 ($ million)
Chart on Brazil - Year-over-year growth 2025-2030 (%)
Data Table on Brazil - Year-over-year growth 2025-2030 (%)

13.6.2 Argentina - Market size and forecast 2025-2030

Chart on Argentina - Market size and forecast 2025-2030 ($ million)
Data Table on Argentina - Market size and forecast 2025-2030 ($ million)
Chart on Argentina - Year-over-year growth 2025-2030 (%)
Data Table on Argentina - Year-over-year growth 2025-2030 (%)

13.6.3 Chile - Market size and forecast 2025-2030

Chart on Chile - Market size and forecast 2025-2030 ($ million)
Data Table on Chile - Market size and forecast 2025-2030 ($ million)
Chart on Chile - Year-over-year growth 2025-2030 (%)
Data Table on Chile - Year-over-year growth 2025-2030 (%)

13.7 Middle East and Africa - Market size and forecast 2025-2030

Chart on Middle East and Africa - Market size and forecast 2025-2030 ($ million)
Data Table on Middle East and Africa - Market size and forecast 2025-2030 ($ million)
Chart on Middle East and Africa - Year-over-year growth 2025-2030 (%)
Data Table on Middle East and Africa - Year-over-year growth 2025-2030 (%)
Chart on Regional Comparison - Middle East and Africa
Data Table on Regional Comparison - Middle East and Africa

13.7.1 Saudi Arabia - Market size and forecast 2025-2030

Chart on Saudi Arabia - Market size and forecast 2025-2030 ($ million)
Data Table on Saudi Arabia - Market size and forecast 2025-2030 ($ million)
Chart on Saudi Arabia - Year-over-year growth 2025-2030 (%)
Data Table on Saudi Arabia - Year-over-year growth 2025-2030 (%)

13.7.2 UAE - Market size and forecast 2025-2030

Chart on UAE - Market size and forecast 2025-2030 ($ million)
Data Table on UAE - Market size and forecast 2025-2030 ($ million)
Chart on UAE - Year-over-year growth 2025-2030 (%)
Data Table on UAE - Year-over-year growth 2025-2030 (%)

13.7.3 South Africa - Market size and forecast 2025-2030

Chart on South Africa - Market size and forecast 2025-2030 ($ million)
Data Table on South Africa - Market size and forecast 2025-2030 ($ million)
Chart on South Africa - Year-over-year growth 2025-2030 (%)
Data Table on South Africa - Year-over-year growth 2025-2030 (%)

13.7.4 Turkey - Market size and forecast 2025-2030

Chart on Turkey - Market size and forecast 2025-2030 ($ million)
Data Table on Turkey - Market size and forecast 2025-2030 ($ million)
Chart on Turkey - Year-over-year growth 2025-2030 (%)
Data Table on Turkey - Year-over-year growth 2025-2030 (%)

13.7.5 Israel - Market size and forecast 2025-2030

Chart on Israel - Market size and forecast 2025-2030 ($ million)
Data Table on Israel - Market size and forecast 2025-2030 ($ million)
Chart on Israel - Year-over-year growth 2025-2030 (%)
Data Table on Israel - Year-over-year growth 2025-2030 (%)

13.8 Market opportunity by geography

Market opportunity by geography ($ million)
Data Tables on Market opportunity by geography ($ million)

14. Drivers, Challenges, and Opportunity

14.1 Market drivers

Transition toward eight-inch wafer manufacturing for economies of scale
Escalation of high-voltage architecture adoption in electric mobility
Demands of AI data centers for high-density power

14.2 Market challenges

Manufacturing complexity and yield limitations in large-diameter wafers
Structural vulnerabilities and geographic concentration of raw feedstocks
Lengthy qualification cycles and evolving global regulatory frameworks

14.3 Impact of drivers and challenges

Impact of drivers and challenges in 2025 and 2030

14.4 Market opportunities

Surge in AI data center power architectures
Electrification of heavy industrial and mining machinery
Transition to large scale 200mm wafer manufacturing

15. Competitive Landscape

15.1 Overview

15.2

Overview on criticality of inputs and factors of differentiation

15.3 Landscape disruption

Overview on factors of disruption

15.4 Industry risks

Impact of key risks on business

16. Competitive Analysis

16.1 Companies profiled

Companies covered

16.2 Company ranking index

16.3 Market positioning of companies

Matrix on companies position and classification

16.4 AGSCO Corp.

AGSCO Corp. - Overview
AGSCO Corp. - Product / Service
AGSCO Corp. - Key offerings
SWOT

16.5 Asuzac Fine Ceramics Co Ltd

Asuzac Fine Ceramics Co Ltd - Overview
Asuzac Fine Ceramics Co Ltd - Product / Service
Asuzac Fine Ceramics Co Ltd - Key offerings
SWOT

16.6 CeramTec GmbH

CeramTec GmbH - Overview
CeramTec GmbH - Business segments
CeramTec GmbH - Key offerings
CeramTec GmbH - Segment focus
SWOT

16.7 Compagnie de Saint Gobain SA

Compagnie de Saint Gobain SA - Overview
Compagnie de Saint Gobain SA - Business segments
Compagnie de Saint Gobain SA - Key offerings
Compagnie de Saint Gobain SA - Segment focus
SWOT

16.8 CoorsTek Inc.

CoorsTek Inc. - Overview
CoorsTek Inc. - Product / Service
CoorsTek Inc. - Key offerings
SWOT

16.9 Dow Chemical Co.

Dow Chemical Co. - Overview
Dow Chemical Co. - Business segments
Dow Chemical Co. - Key offerings
Dow Chemical Co. - Segment focus
SWOT

16.10 Hongwu International Group Ltd.

Hongwu International Group Ltd. - Overview
Hongwu International Group Ltd. - Product / Service
Hongwu International Group Ltd. - Key offerings
SWOT

16.11 Imerys S.A.

Imerys S.A. - Overview
Imerys S.A. - Business segments
Imerys S.A. - Key news
Imerys S.A. - Key offerings
Imerys S.A. - Segment focus
SWOT

16.12 Infineon Technologies AG

Infineon Technologies AG - Overview
Infineon Technologies AG - Business segments
Infineon Technologies AG - Key news
Infineon Technologies AG - Key offerings
Infineon Technologies AG - Segment focus
SWOT

16.13 Mersen Corporate Services SAS

Mersen Corporate Services SAS - Overview
Mersen Corporate Services SAS - Business segments
Mersen Corporate Services SAS - Key offerings
Mersen Corporate Services SAS - Segment focus
SWOT

16.14 Miller and Co.

Miller and Co. - Overview
Miller and Co. - Product / Service
Miller and Co. - Key offerings
SWOT

16.15 Morgan Advanced Materials

Morgan Advanced Materials - Overview
Morgan Advanced Materials - Business segments
Morgan Advanced Materials - Key offerings
Morgan Advanced Materials - Segment focus
SWOT

16.16 Murugappa Group

Murugappa Group - Overview
Murugappa Group - Product / Service
Murugappa Group - Key offerings
SWOT

16.17 ON Semiconductor Corp.

ON Semiconductor Corp. - Overview
ON Semiconductor Corp. - Business segments
ON Semiconductor Corp. - Key news
ON Semiconductor Corp. - Key offerings
ON Semiconductor Corp. - Segment focus
SWOT

16.18 Tokai Carbon Co. Ltd.

Tokai Carbon Co. Ltd. - Overview
Tokai Carbon Co. Ltd. - Product / Service
Tokai Carbon Co. Ltd. - Key offerings
SWOT

17. Appendix

17.1 Scope of the report

Market definition
Objectives
Notes and caveats

17.2 Inclusions and exclusions checklist

Inclusions checklist
Exclusions checklist

17.3 Currency conversion rates for US$

17.4 Research methodology

17.5 Data procurement

Information sources

17.6 Data validation

17.7 Validation techniques employed for market sizing

17.8 Data synthesis

17.9 360 degree market analysis

17.10 List of abbreviations

Research Methodology

Technavio presents a detailed picture of the market by way of study, synthesis, and summation of data from multiple sources. The analysts have presented the various facets of the market with a particular focus on identifying the key industry influencers. The data thus presented is comprehensive, reliable, and the result of extensive research, both primary and secondary.

INFORMATION SOURCES

Primary sources

  • Manufacturers and suppliers
  • Channel partners
  • Industry experts
  • Strategic decision makers

Secondary sources

  • Industry journals and periodicals
  • Government data
  • Financial reports of key industry players
  • Historical data
  • Press releases

DATA ANALYSIS

Data Synthesis

  • Collation of data
  • Estimation of key figures
  • Analysis of derived insights

Data Validation

  • Triangulation with data models
  • Reference against proprietary databases
  • Corroboration with industry experts

REPORT WRITING

Qualitative

  • Market drivers
  • Market challenges
  • Market trends
  • Five forces analysis

Quantitative

  • Market size and forecast
  • Market segmentation
  • Geographical insights
  • Competitive landscape

Interested in this report?

Get your sample now to see our research methodology and insights!

Download Now

Frequently Asked Questions

Silicon Carbide (sic) market growth will increase by USD 18069.9 million during 2026-2030.

The Silicon Carbide (sic) market is expected to grow at a CAGR of 42.2% during 2026-2030.

Silicon Carbide (sic) market is segmented by Product (Power electronics, Optoelectronic devices, Frequency devices) Application (Automotive, Energy and power, Aerospace and defense, Data and communication devices, Others) Device (SiC discrete device, SiC module) Measurement (Up to 150mm, Greater than 150mm)

AGSCO Corp., Asuzac Fine Ceramics Co Ltd, CeramTec GmbH, Compagnie de Saint Gobain SA, CoorsTek Inc., Dow Chemical Co., ESD SIC bv, ESK SiC GmbH, Hongwu International Group Ltd., Imerys S.A., Infineon Technologies AG, Kyocera Corp., Mersen Corporate Services SAS, Miller and Co., Morgan Advanced Materials, Murugappa Group, ON Semiconductor Corp., SNAM Abrasives Pvt. Ltd., Tokai Carbon Co. Ltd., Xiamen Powerway Co. Ltd. are a few of the key vendors in the Silicon Carbide (sic) market.

APAC will register the highest growth rate of 53.4% among the other regions. Therefore, the Silicon Carbide (sic) market in APAC is expected to garner significant business opportunities for the vendors during the forecast period.

China, Japan, South Korea, India, Australia, Indonesia, US, Canada, Mexico, Germany, France, UK, Italy, Spain, The Netherlands, Brazil, Argentina, Chile, Saudi Arabia, UAE, South Africa, Turkey, Israel

  • Transition toward eight-inch wafer manufacturing for economies of scale is the driving factor this market.

The Silicon Carbide (sic) market vendors should focus on grabbing business opportunities from the Product segment as it accounted for the largest market share in the base year.
RIA - Research AI Assistant
Ask RIA