Power Semiconductor Market Analysis, Size, and Forecast 2026-2030: APAC (China, Japan, and South Korea), Europe (Germany, UK, and France), North America (US, Canada, and Mexico), South America (Brazil and Argentina), Middle East and Africa (Saudi Arabia, UAE, and South Africa), and Rest of World (ROW)

Power Semiconductor Market Analysis, Size, and Forecast 2026-2030:
APAC (China, Japan, and South Korea), Europe (Germany, UK, and France), North America (US, Canada, and Mexico), South America (Brazil and Argentina), Middle East and Africa (Saudi Arabia, UAE, and South Africa), and Rest of World (ROW)

Published: May 2026 303 Pages SKU: IRTNTR72116

Market Overview at a Glance

$15.60 B
Market Opportunity
8.9%
CAGR 2025 - 2030
59.1%
APAC Growth
$12.82 B
Automotive segment 2024

Power Semiconductor Market Size 2026-2030

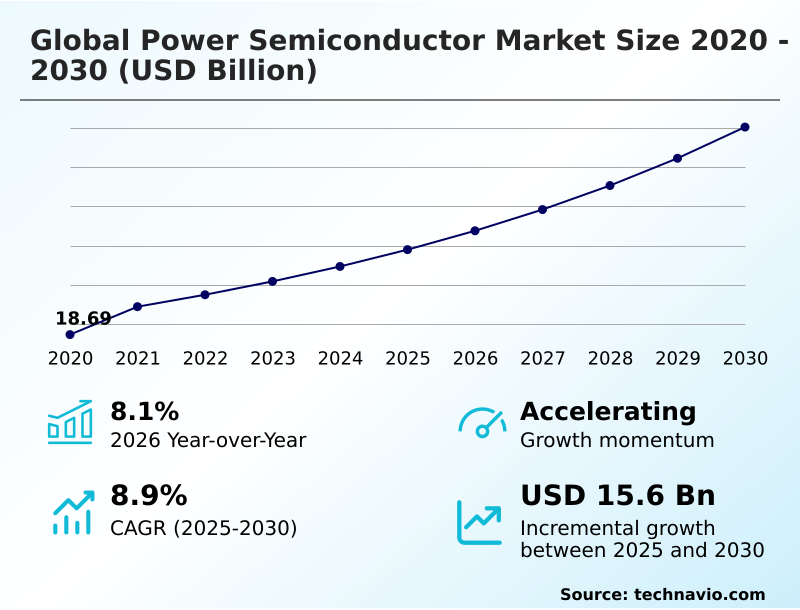
The Power Semiconductor Market size was valued at USD 29.50 billion in 2025, growing at a CAGR of 8.9% during the forecast period 2026-2030.

Major Market Trends & Insights

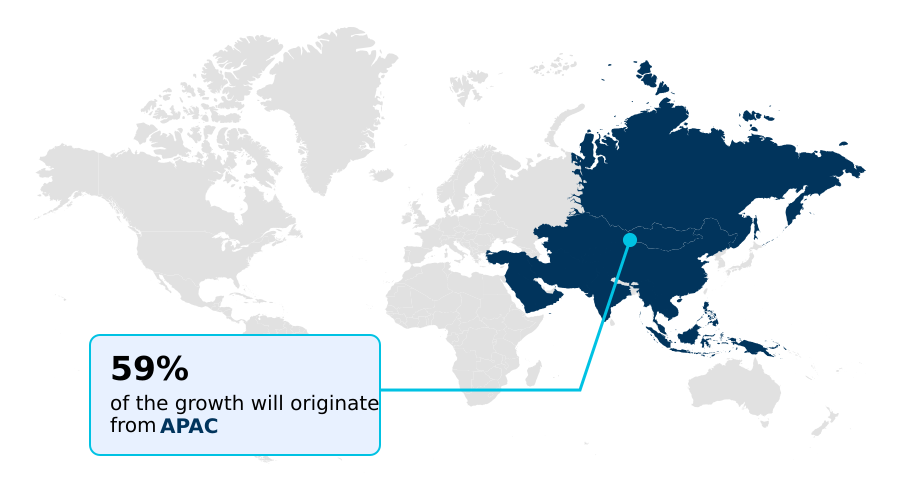
  • APAC dominated the market and accounted for a 59.1% growth during the forecast period.
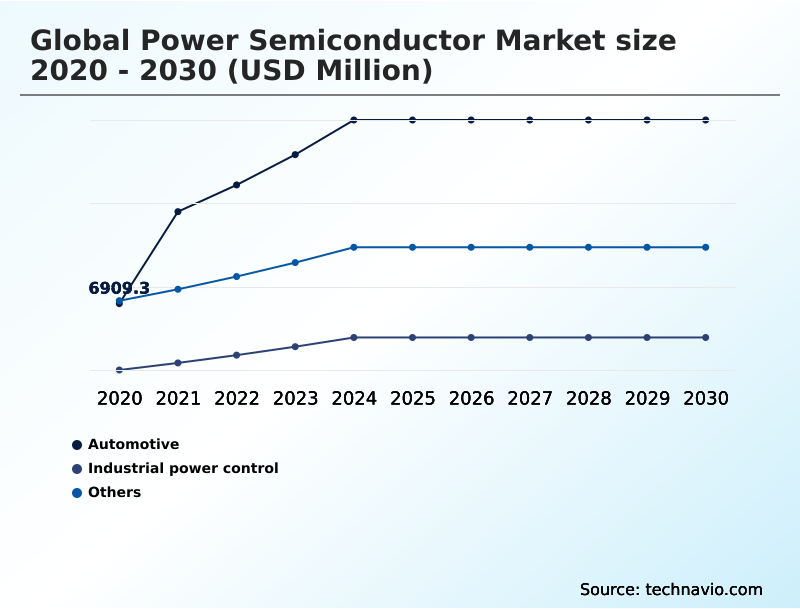
  • By Application - Automotive segment was valued at USD 12.82 billion in 2024
  • By Material - Silicon segment accounted for the largest market revenue share in 2024

Market Size & Forecast

  • Historic Market Opportunities 2020-2024: USD 26.41 billion
  • Market Future Opportunities 2025-2030: USD 15.60 billion
  • CAGR from 2025 to 2030 : 8.9%

Market Summary

  • The power semiconductor market is defined by a rapid innovation cycle, where the demand for higher power density and efficiency leads to continuous material and architectural advancements. For instance, the transition to wide bandgap semiconductors like silicon carbide (SiC) and gallium nitride (GaN) has enabled a 30% reduction in energy loss in certain high-voltage applications compared to traditional silicon.
  • A key driver is the global electrification of the automotive sector, which requires robust components like traction inverters and onboard chargers capable of handling high power loads with minimal heat generation. A real-world operational scenario involves supply chain managers for automotive OEMs collaborating with semiconductor fabs to secure long-term contracts for SiC wafers, mitigating production risks.
  • Conversely, a significant challenge is the high capital expenditure required for new fabrication facilities, creating a barrier to entry and concentrating production among a few key players. This dynamic underscores the critical balance between technological advancement and manufacturing scalability in the industry.

What will be the Size of the Power Semiconductor Market during the forecast period?

Get Key Insights on Market Forecast (PDF) Request Free Sample

How is the Power Semiconductor Market Segmented?

The power semiconductor industry research report provides comprehensive data (region-wise segment analysis), with forecasts and analysis for the period 2026-2030, as well as historical data from 2020-2024 for the following segments.

  • Application
    • Automotive
    • Industrial power control
    • Others
  • Material
    • Silicon
    • Silicon carbide
    • Gallium nitride
  • Component
    • Discrete
    • Module
    • Power ICs
  • Geography
    • APAC
      • China
      • Japan
      • South Korea
    • Europe
      • Germany
      • UK
      • France
    • North America
      • US
      • Canada
      • Mexico
    • South America
      • Brazil
      • Argentina
    • Middle East and Africa
      • Saudi Arabia
      • UAE
      • South Africa
    • Rest of World (ROW)

How is the Power Semiconductor Market Segmented by Application?

The automotive segment is estimated to witness significant growth during the forecast period.

The automotive segment's adoption of advanced power semiconductors has resulted in a 15% improvement in electric vehicle (EV) range due to enhanced power conversion efficiency.

Devices like the silicon carbide MOSFET are integral to this shift, with new traction inverter designs reducing energy losses by over 20% compared to previous silicon-based systems. This enables faster charging and more compact drivetrain components.

The demand for automotive-grade qualification in these components is driven by the need for high reliability in electrified systems and onboard chargers.

As the industry moves towards 800-volt architectures, the role of wide bandgap semiconductors becomes even more critical for managing high-voltage applications and achieving superior fast-switching performance in power supply design.

Request Free Sample

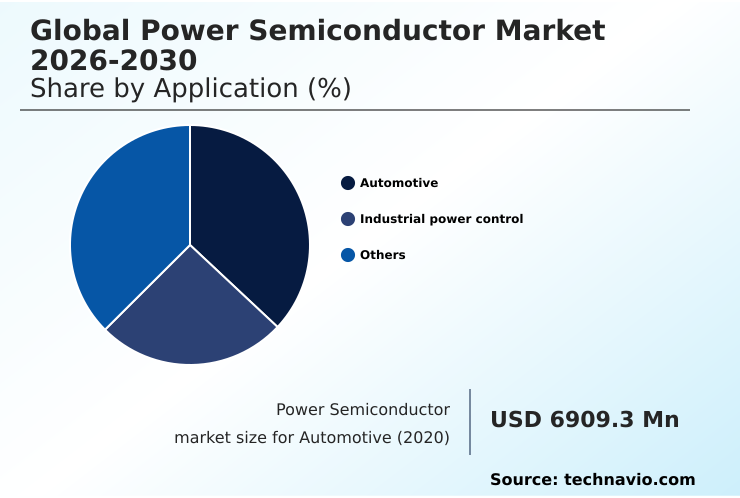
The Automotive segment was valued at USD 12.82 billion in 2024 and showed a gradual increase during the forecast period.

Request Free Sample

How demand for the Power Semiconductor market is rising in the leading region?

APAC is estimated to contribute 59.1% to the growth of the global market during the forecast period.Technavio’s analysts have elaborately explained the regional trends and drivers that shape the market during the forecast period.

See How Power Semiconductor Market demand is rising in APAC Request Free Sample

The geographic landscape of the power semiconductor market is dominated by APAC, which accounts for approximately 59% of the global market, a stark contrast to North America's 13% share.

This dominance is driven by countries like China, Japan, and South Korea, which collectively represent over half of the region's demand, fueled by massive electronics manufacturing and aggressive electric vehicle (EV) production targets.

In contrast, Europe's market, while smaller, is characterized by high-value applications in industrial automation and premium automotive sectors, focusing on automotive-grade qualification.

Regional differences in supply chain localization are notable; APAC benefits from an integrated ecosystem of wafer fabrication and advanced packaging, reducing lead times by up to 20%, whereas North America and Europe are increasingly investing in domestic semiconductor manufacturing to reduce dependency and enhance supply chain resilience for critical energy infrastructure and data center optimization.

What are the key Drivers, Trends, and Challenges in the Power Semiconductor Market?

Our researchers analyzed the data with 2025 as the base year, along with the key drivers, trends, and challenges. A holistic analysis of drivers will help companies refine their marketing strategies to gain a competitive advantage.

  • Navigating the complexities of the power semiconductor market requires a deep understanding of specific use cases and material performance. For instance, evaluating silicon carbide vs gallium nitride for EV applications reveals that SiC is often preferred for high-voltage traction inverters, where its superior thermal conductivity allows for a 10-15% increase in power density over silicon.
  • In contrast, GaN excels in high-frequency onboard chargers and DC-DC converters. When considering how to improve power density in data centers, engineers often turn to GaN-based power management ICs, which can operate at higher switching frequencies, reducing the size of passive components by as much as 40%.
  • The selection of a power semiconductor for renewable energy inverters depends heavily on the scale of the system; SiC modules are prevalent in utility-scale solar farms, while GaN devices are making inroads in residential microinverters. However, a significant hurdle remains: the challenges in wide bandgap material supply, which can lead to production delays and price volatility.
  • To address this, companies are exploring integrated power modules for industrial automation, which offer a pre-validated, reliable solution that simplifies design and sourcing, mitigating some of the supply chain risks associated with discrete components.

What are the key market drivers leading to the rise in the adoption of Power Semiconductor Industry?

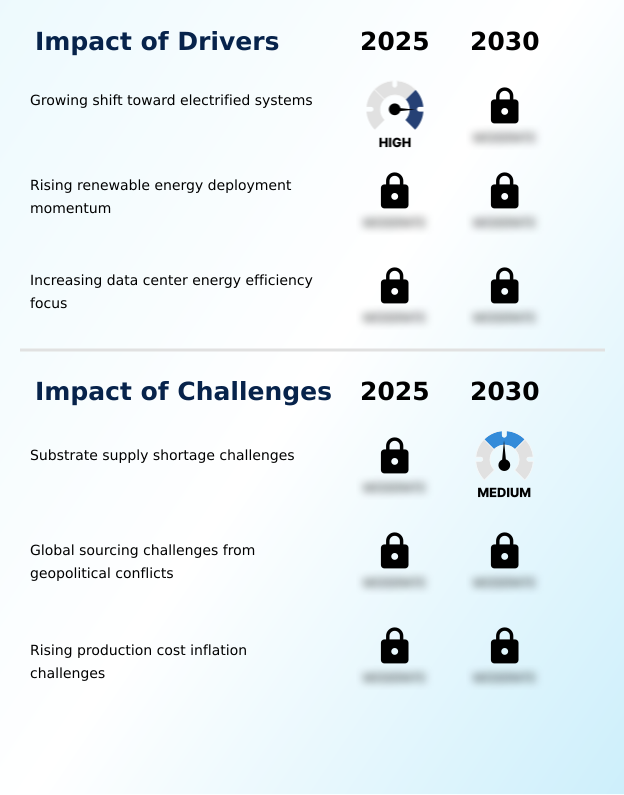
  • A primary driver for the market is the growing shift toward electrified systems, which is accelerating transitions across the transportation and energy sectors.

  • The escalating demand for electrified systems is a primary driver, with electric vehicle sales increasing over 20% annually, creating a substantial need for advanced power semiconductors.
  • This momentum is matched by the rapid renewable energy deployment, where the efficiency of power inverters directly impacts energy yield. High-voltage applications in solar and wind farms benefit significantly from devices that minimize energy loss, improving overall grid synchronization.
  • Furthermore, the exponential growth of data center optimization initiatives, driven by AI workloads, necessitates highly efficient power supply design.
  • Adopting advanced power management ICs in servers can reduce energy consumption by up to 15%, a critical factor in managing operational costs and achieving sustainability goals within large-scale energy infrastructure.

What are the market trends shaping the Power Semiconductor Industry?

  • The market is undergoing a significant transformation driven by the shift toward wide bandgap supremacy. Silicon carbide and gallium nitride materials are establishing dominance by offering exclusive performance advantages in high-efficiency applications.

  • A dominant trend in the power semiconductor market is the advancement of wide bandgap semiconductor materials, which offer a 30% increase in power conversion efficiency over traditional silicon. This shift is driven by the adoption of AI-centric power delivery architectures that demand high-frequency operation and superior thermal management solutions.
  • For instance, the use of a silicon carbide MOSFET enables systems to handle higher breakdown voltage and junction temperature, reducing system size and cooling requirements. This is particularly critical in applications like electric vehicles, where gallium nitride HEMT devices in onboard chargers contribute to faster charging times.
  • The move toward integrated electrification modules, combining functions like circuit protection and fault detection, further exemplifies the trend toward higher power density and system-level optimization.

What challenges does the Power Semiconductor Industry face during its growth?

  • A key challenge impacting industry growth is the ongoing substrate supply shortage, stemming from constrained production of high-quality silicon carbide and gallium nitride materials.

  • A primary challenge confronting the power semiconductor market is the persistent shortage of high-quality substrates, which has extended lead times for silicon carbide wafers by up to 50% in some cases. This substrate manufacturing bottleneck directly impacts the ability of producers to scale wafer fabrication and meet the surging demand from the automotive and industrial sectors.
  • Geopolitical conflicts exacerbate these issues, disrupting global supply chains and leading to semiconductor manufacturing cost inflation, with some input materials seeing price increases of over 25%.
  • These global sourcing challenges force companies to invest in supply chain localization and qualify alternative suppliers, adding complexity and cost to their operations and potentially delaying the rollout of next-generation technologies that depend on these advanced materials.

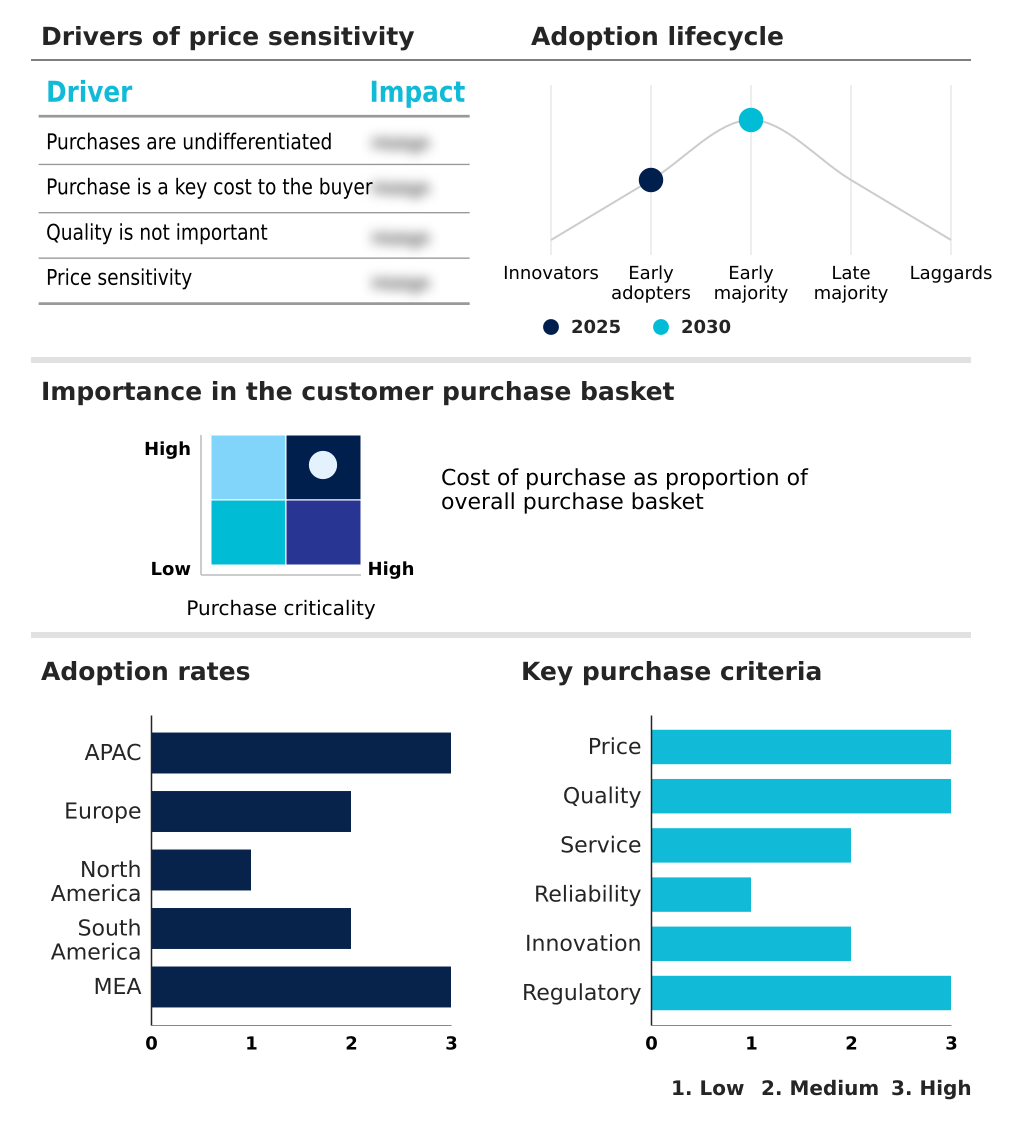
Exclusive Technavio Analysis on Customer Landscape

The power semiconductor market forecasting report includes the adoption lifecycle of the market, covering from the innovator’s stage to the laggard’s stage. It focuses on adoption rates in different regions based on penetration. Furthermore, the power semiconductor market report also includes key purchase criteria and drivers of price sensitivity to help companies evaluate and develop their market growth analysis strategies.

Customer Landscape of Power Semiconductor Industry

Competitive Landscape

Companies are implementing various strategies, such as strategic alliances, power semiconductor market forecast, partnerships, mergers and acquisitions, geographical expansion, and product/service launches, to enhance their presence in the industry.

Alpha and Omega Semiconductor - Key offerings include advanced power semiconductors, encompassing silicon carbide (SiC) and gallium nitride (GaN) devices, designed for high-efficiency power conversion and management across multiple industries.

The industry research and growth report includes detailed analyses of the competitive landscape of the market and information about key companies, including:

  • Alpha and Omega Semiconductor
  • Diodes Inc.
  • Fuji Electric Co. Ltd.
  • Infineon Technologies AG
  • Littelfuse Inc.
  • MagnaChip Semiconductor Corp.
  • Microchip Technology Inc.
  • Mitsubishi Electric Corp.
  • Monolithic Power Systems Inc.
  • Navitas Semiconductor Inc.
  • Nexperia BV
  • NXP Semiconductors NV
  • ON Semiconductor Corp.
  • Renesas Electronics Corp.
  • ROHM Co. Ltd.
  • Shindengen Electric Co. Ltd.
  • STMicroelectronics NV
  • Texas Instruments Inc.
  • Vishay Intertechnology Inc.
  • Wolfspeed Inc.

Qualitative and quantitative analysis of companies has been conducted to help clients understand the wider business environment as well as the strengths and weaknesses of key industry players. Data is qualitatively analyzed to categorize companies as pure play, category-focused, industry-focused, and diversified; it is quantitatively analyzed to categorize companies as dominant, leading, strong, tentative, and weak.

Market Intelligence Radar: High-Impact Developments & Growth Signals

  • In the semiconductor materials and equipment industry, the push for domestic semiconductor fabrication capabilities, supported by government initiatives, is altering global supply chains for power semiconductors, encouraging supply chain localization and investments in new wafer fabrication plants to mitigate geopolitical risks and ensure a stable supply for energy infrastructure.
  • A significant trend is the accelerated development and investment in 300-millimeter wafer processing lines, which increases manufacturing yields by over 25% per wafer. This directly impacts the power semiconductor market by lowering the unit cost of high-volume devices and supporting the scaling of advanced packaging for consumer electronics.
  • The adoption of advanced packaging technologies, such as system-in-package (SiP) designs, is enabling higher levels of integration. This allows power semiconductor manufacturers to create more compact and efficient modules that combine power, control, and protection functions, a key requirement for industrial electrification.
  • Stricter environmental regulations on industrial emissions and energy consumption are driving demand for high-efficiency power semiconductors. The need for variable frequency drives and smart grid technology in industrial settings creates a pull for devices that minimize energy loss, with new standards mandating efficiency improvements of at least 10% in motor control systems.

Dive into Technavio’s robust research methodology, blending expert interviews, extensive data synthesis, and validated models for unparalleled Power Semiconductor Market insights. See full methodology.

Market Scope
Page number 303
Base year 2025
Historic period 2020-2024
Forecast period 2026-2030
Growth momentum & CAGR Accelerate at a CAGR of 8.9%
Market growth 2026-2030 USD 15596.2 million
Market structure Fragmented
YoY growth 2025-2026(%) 8.1%
Key countries China, Japan, South Korea, India, Australia, Indonesia, Germany, UK, France, Italy, Spain, The Netherlands, US, Canada, Mexico, Brazil, Argentina, Chile, Saudi Arabia, UAE, South Africa, Israel and Turkey
Competitive landscape Leading Companies, Market Positioning of Companies, Competitive Strategies, and Industry Risks

Request Free Sample

Research Analyst Overview

  • The power semiconductor market ecosystem is a highly integrated network where raw material suppliers of silicon, silicon carbide, and gallium nitride provide the foundation for device manufacturing. Specialized equipment providers supply the tools for wafer fabrication, a segment that commands over 40% of the total capital expenditure in the industry.
  • Manufacturers, including integrated device makers and foundries, design and produce components ranging from discrete devices to complex power modules. These products are then distributed through direct sales channels and global distributors to end-users in the automotive, industrial, and consumer electronics sectors.
  • Regulatory bodies and industry consortia establish the standards for performance and reliability, such as automotive-grade qualification, which ensures devices can withstand harsh operating conditions. The entire value chain is supported by R&D entities and software firms that provide the intellectual property and design tools necessary for continuous innovation, with R&D investments often exceeding 15% of revenue for leading firms.

What are the Key Data Covered in this Power Semiconductor Market Research and Growth Report?

  • What is the expected growth of the Power Semiconductor Market between 2026 and 2030?

    • The Power Semiconductor Market is expected to grow by USD 15.60 billion during 2026-2030, registering a CAGR of 8.9%. Year-over-year growth in 2026 is estimated at 8.1%%. This acceleration is shaped by growing shift toward electrified systems, which is intensifying demand across multiple end-use verticals covered in the report.

  • What segmentation does the market report cover?

    • The report is segmented by Application (Automotive, Industrial power control, and Others), Material (Silicon, Silicon carbide, and Gallium nitride), Component (Discrete, Module, and Power ICs) and Geography (APAC, Europe, North America, South America, Middle East and Africa). Among these, the Automotive segment is estimated to witness significant growth during the forecast period, driven by rising adoption across key application areas. Each segment includes detailed qualitative and quantitative analysis, along with historical data from 2020-2024 and forecasts through 2030 with year-over-year growth rates.

  • Which regions are analyzed in the report?

    • The report covers APAC, Europe, North America, South America and Middle East and Africa. APAC is estimated to contribute 59.1% to market growth during the forecast period. Country-level analysis includes China, Japan, South Korea, India, Australia, Indonesia, Germany, UK, France, Italy, Spain, The Netherlands, US, Canada, Mexico, Brazil, Argentina, Chile, Saudi Arabia, UAE, South Africa, Israel and Turkey, with dedicated market size tables and year-over-year growth for each.

  • What are the key growth drivers and market challenges?

    • The primary driver is growing shift toward electrified systems, which is accelerating investment and industry demand. The main challenge is substrate supply shortage challenges, creating operational barriers for key market participants. The report quantifies the impact of each driver and challenge across 2026 and 2030 with comparative analysis.

  • Who are the major players in the Power Semiconductor Market?

    • Key vendors include Alpha and Omega Semiconductor, Diodes Inc., Fuji Electric Co. Ltd., Infineon Technologies AG, Littelfuse Inc., MagnaChip Semiconductor Corp., Microchip Technology Inc., Mitsubishi Electric Corp., Monolithic Power Systems Inc., Navitas Semiconductor Inc., Nexperia BV, NXP Semiconductors NV, ON Semiconductor Corp., Renesas Electronics Corp., ROHM Co. Ltd., Shindengen Electric Co. Ltd., STMicroelectronics NV, Texas Instruments Inc., Vishay Intertechnology Inc. and Wolfspeed Inc.. The report provides qualitative and quantitative analysis categorizing companies as dominant, leading, strong, tentative, and weak based on their market positioning. Company profiles include business segment analysis, SWOT assessment, key offerings, and recent strategic developments.

Market Research Insights

  • The competitive landscape of the power semiconductor market is intensely dynamic, with the top five vendors accounting for over 60% of market share. Companies are aggressively investing in wide bandgap materials to capture growth in high-demand sectors. For instance, Infineon Technologies AG is expanding its manufacturing for power supplies to support AI data centers and renewable energy, while Wolfspeed Inc.
  • focuses on 300-millimeter silicon carbide technology to enhance thermal and electrical performance. These strategic moves are a direct response to the escalating demand for high-efficiency power conversion in electric vehicles and data center infrastructure.
  • This innovation push is not without obstacles; ongoing substrate supply shortages present a significant challenge, forcing companies to implement dual-sourcing strategies and invest in research for alternative materials to maintain production continuity.

We can help! Our analysts can customize this power semiconductor market research report to meet your requirements.

Get in touch

1. Executive Summary

1.1 Market overview

Executive Summary - Chart on Market Overview
Executive Summary - Data Table on Market Overview
Executive Summary - Chart on Global Market Characteristics
Executive Summary - Chart on Market by Geography
Executive Summary - Chart on Market Segmentation by Application
Executive Summary - Chart on Market Segmentation by Material
Executive Summary - Chart on Market Segmentation by Component
Executive Summary - Chart on Incremental Growth
Executive Summary - Data Table on Incremental Growth
Executive Summary - Chart on Company Market Positioning

2. Technavio Analysis

2.1 Analysis of price sensitivity, lifecycle, customer purchase basket, adoption rates, and purchase criteria

2.2 Criticality of inputs and Factors of differentiation

Chart on Overview on criticality of inputs and factors of differentiation

2.3 Factors of disruption

Chart on Overview on factors of disruption

2.4 Impact of drivers and challenges

Chart on Impact of drivers and challenges in 2025 and 2030

3. Market Landscape

3.1 Market ecosystem

Chart on Parent Market
Data Table on - Parent Market

3.2 Market characteristics

Chart on Market characteristics analysis

3.3 Value chain analysis

Chart on Value chain analysis

4. Market Sizing

4.1 Market definition

Data Table on Offerings of companies included in the market definition

4.2 Market segment analysis

Market segments

4.3 Market size 2025

4.4 Market outlook: Forecast for 2025-2030

Chart on Global - Market size and forecast 2025-2030 ($ million)
Data Table on Global - Market size and forecast 2025-2030 ($ million)
Chart on Global Market: Year-over-year growth 2025-2030 (%)
Data Table on Global Market: Year-over-year growth 2025-2030 (%)

5. Historic Market Size

5.1 Global Power Semiconductor Market 2020 - 2024

Historic Market Size - Data Table on Global Power Semiconductor Market 2020 - 2024 ($ million)

5.2 Application segment analysis 2020 - 2024

Historic Market Size - Application Segment 2020 - 2024 ($ million)

5.3 Material segment analysis 2020 - 2024

Historic Market Size - Material Segment 2020 - 2024 ($ million)

5.4 Component segment analysis 2020 - 2024

Historic Market Size - Component Segment 2020 - 2024 ($ million)

5.5 Geography segment analysis 2020 - 2024

Historic Market Size - Geography Segment 2020 - 2024 ($ million)

5.6 Country segment analysis 2020 - 2024

Historic Market Size - Country Segment 2020 - 2024 ($ million)

6. Qualitative Analysis

6.1 Impact of AI on Global Power Semiconductor Market

6.2 Impact of Geopolitical Conflicts on the Global Power Semiconductor Market

7. Five Forces Analysis

7.1 Five forces summary

Five forces analysis - Comparison between 2025 and 2030

7.2 Bargaining power of buyers

Bargaining power of buyers - Impact of key factors 2025 and 2030

7.3 Bargaining power of suppliers

Bargaining power of suppliers - Impact of key factors in 2025 and 2030

7.4 Threat of new entrants

Threat of new entrants - Impact of key factors in 2025 and 2030

7.5 Threat of substitutes

Threat of substitutes - Impact of key factors in 2025 and 2030

7.6 Threat of rivalry

Threat of rivalry - Impact of key factors in 2025 and 2030

7.7 Market condition

Chart on Market condition - Five forces 2025 and 2030

8. Market Segmentation by Application

8.1 Market segments

Chart on Application - Market share 2025-2030 (%)
Data Table on Application - Market share 2025-2030 (%)

8.2 Comparison by Application

Chart on Comparison by Application
Data Table on Comparison by Application

8.3 Automotive - Market size and forecast 2025-2030

Chart on Automotive - Market size and forecast 2025-2030 ($ million)
Data Table on Automotive - Market size and forecast 2025-2030 ($ million)
Chart on Automotive - Year-over-year growth 2025-2030 (%)
Data Table on Automotive - Year-over-year growth 2025-2030 (%)

8.4 Industrial power control - Market size and forecast 2025-2030

Chart on Industrial power control - Market size and forecast 2025-2030 ($ million)
Data Table on Industrial power control - Market size and forecast 2025-2030 ($ million)
Chart on Industrial power control - Year-over-year growth 2025-2030 (%)
Data Table on Industrial power control - Year-over-year growth 2025-2030 (%)

8.5 Others - Market size and forecast 2025-2030

Chart on Others - Market size and forecast 2025-2030 ($ million)
Data Table on Others - Market size and forecast 2025-2030 ($ million)
Chart on Others - Year-over-year growth 2025-2030 (%)
Data Table on Others - Year-over-year growth 2025-2030 (%)

8.6 Market opportunity by Application

Market opportunity by Application ($ million)
Data Table on Market opportunity by Application ($ million)

9. Market Segmentation by Material

9.1 Market segments

Chart on Material - Market share 2025-2030 (%)
Data Table on Material - Market share 2025-2030 (%)

9.2 Comparison by Material

Chart on Comparison by Material
Data Table on Comparison by Material

9.3 Silicon - Market size and forecast 2025-2030

Chart on Silicon - Market size and forecast 2025-2030 ($ million)
Data Table on Silicon - Market size and forecast 2025-2030 ($ million)
Chart on Silicon - Year-over-year growth 2025-2030 (%)
Data Table on Silicon - Year-over-year growth 2025-2030 (%)

9.4 Silicon carbide - Market size and forecast 2025-2030

Chart on Silicon carbide - Market size and forecast 2025-2030 ($ million)
Data Table on Silicon carbide - Market size and forecast 2025-2030 ($ million)
Chart on Silicon carbide - Year-over-year growth 2025-2030 (%)
Data Table on Silicon carbide - Year-over-year growth 2025-2030 (%)

9.5 Gallium nitride - Market size and forecast 2025-2030

Chart on Gallium nitride - Market size and forecast 2025-2030 ($ million)
Data Table on Gallium nitride - Market size and forecast 2025-2030 ($ million)
Chart on Gallium nitride - Year-over-year growth 2025-2030 (%)
Data Table on Gallium nitride - Year-over-year growth 2025-2030 (%)

9.6 Market opportunity by Material

Market opportunity by Material ($ million)
Data Table on Market opportunity by Material ($ million)

10. Market Segmentation by Component

10.1 Market segments

Chart on Component - Market share 2025-2030 (%)
Data Table on Component - Market share 2025-2030 (%)

10.2 Comparison by Component

Chart on Comparison by Component
Data Table on Comparison by Component

10.3 Discrete - Market size and forecast 2025-2030

Chart on Discrete - Market size and forecast 2025-2030 ($ million)
Data Table on Discrete - Market size and forecast 2025-2030 ($ million)
Chart on Discrete - Year-over-year growth 2025-2030 (%)
Data Table on Discrete - Year-over-year growth 2025-2030 (%)

10.4 Module - Market size and forecast 2025-2030

Chart on Module - Market size and forecast 2025-2030 ($ million)
Data Table on Module - Market size and forecast 2025-2030 ($ million)
Chart on Module - Year-over-year growth 2025-2030 (%)
Data Table on Module - Year-over-year growth 2025-2030 (%)

10.5 Power ICs - Market size and forecast 2025-2030

Chart on Power ICs - Market size and forecast 2025-2030 ($ million)
Data Table on Power ICs - Market size and forecast 2025-2030 ($ million)
Chart on Power ICs - Year-over-year growth 2025-2030 (%)
Data Table on Power ICs - Year-over-year growth 2025-2030 (%)

10.6 Market opportunity by Component

Market opportunity by Component ($ million)
Data Table on Market opportunity by Component ($ million)

11. Customer Landscape

11.1 Customer landscape overview

Analysis of price sensitivity, lifecycle, customer purchase basket, adoption rates, and purchase criteria

12. Geographic Landscape

12.1 Geographic segmentation

Chart on Market share by geography 2025-2030 (%)
Data Table on Market share by geography 2025-2030 (%)

12.2 Geographic comparison

Chart on Geographic comparison
Data Table on Geographic comparison

12.3 APAC - Market size and forecast 2025-2030

Chart on APAC - Market size and forecast 2025-2030 ($ million)
Data Table on APAC - Market size and forecast 2025-2030 ($ million)
Chart on APAC - Year-over-year growth 2025-2030 (%)
Data Table on APAC - Year-over-year growth 2025-2030 (%)
Chart on Regional Comparison - APAC
Data Table on Regional Comparison - APAC

12.3.1 China - Market size and forecast 2025-2030

Chart on China - Market size and forecast 2025-2030 ($ million)
Data Table on China - Market size and forecast 2025-2030 ($ million)
Chart on China - Year-over-year growth 2025-2030 (%)
Data Table on China - Year-over-year growth 2025-2030 (%)

12.3.2 Japan - Market size and forecast 2025-2030

Chart on Japan - Market size and forecast 2025-2030 ($ million)
Data Table on Japan - Market size and forecast 2025-2030 ($ million)
Chart on Japan - Year-over-year growth 2025-2030 (%)
Data Table on Japan - Year-over-year growth 2025-2030 (%)

12.3.3 South Korea - Market size and forecast 2025-2030

Chart on South Korea - Market size and forecast 2025-2030 ($ million)
Data Table on South Korea - Market size and forecast 2025-2030 ($ million)
Chart on South Korea - Year-over-year growth 2025-2030 (%)
Data Table on South Korea - Year-over-year growth 2025-2030 (%)

12.3.4 India - Market size and forecast 2025-2030

Chart on India - Market size and forecast 2025-2030 ($ million)
Data Table on India - Market size and forecast 2025-2030 ($ million)
Chart on India - Year-over-year growth 2025-2030 (%)
Data Table on India - Year-over-year growth 2025-2030 (%)

12.3.5 Australia - Market size and forecast 2025-2030

Chart on Australia - Market size and forecast 2025-2030 ($ million)
Data Table on Australia - Market size and forecast 2025-2030 ($ million)
Chart on Australia - Year-over-year growth 2025-2030 (%)
Data Table on Australia - Year-over-year growth 2025-2030 (%)

12.3.6 Indonesia - Market size and forecast 2025-2030

Chart on Indonesia - Market size and forecast 2025-2030 ($ million)
Data Table on Indonesia - Market size and forecast 2025-2030 ($ million)
Chart on Indonesia - Year-over-year growth 2025-2030 (%)
Data Table on Indonesia - Year-over-year growth 2025-2030 (%)

12.4 Europe - Market size and forecast 2025-2030

Chart on Europe - Market size and forecast 2025-2030 ($ million)
Data Table on Europe - Market size and forecast 2025-2030 ($ million)
Chart on Europe - Year-over-year growth 2025-2030 (%)
Data Table on Europe - Year-over-year growth 2025-2030 (%)
Chart on Regional Comparison - Europe
Data Table on Regional Comparison - Europe

12.4.1 Germany - Market size and forecast 2025-2030

Chart on Germany - Market size and forecast 2025-2030 ($ million)
Data Table on Germany - Market size and forecast 2025-2030 ($ million)
Chart on Germany - Year-over-year growth 2025-2030 (%)
Data Table on Germany - Year-over-year growth 2025-2030 (%)

12.4.2 UK - Market size and forecast 2025-2030

Chart on UK - Market size and forecast 2025-2030 ($ million)
Data Table on UK - Market size and forecast 2025-2030 ($ million)
Chart on UK - Year-over-year growth 2025-2030 (%)
Data Table on UK - Year-over-year growth 2025-2030 (%)

12.4.3 France - Market size and forecast 2025-2030

Chart on France - Market size and forecast 2025-2030 ($ million)
Data Table on France - Market size and forecast 2025-2030 ($ million)
Chart on France - Year-over-year growth 2025-2030 (%)
Data Table on France - Year-over-year growth 2025-2030 (%)

12.4.4 Italy - Market size and forecast 2025-2030

Chart on Italy - Market size and forecast 2025-2030 ($ million)
Data Table on Italy - Market size and forecast 2025-2030 ($ million)
Chart on Italy - Year-over-year growth 2025-2030 (%)
Data Table on Italy - Year-over-year growth 2025-2030 (%)

12.4.5 Spain - Market size and forecast 2025-2030

Chart on Spain - Market size and forecast 2025-2030 ($ million)
Data Table on Spain - Market size and forecast 2025-2030 ($ million)
Chart on Spain - Year-over-year growth 2025-2030 (%)
Data Table on Spain - Year-over-year growth 2025-2030 (%)

12.4.6 The Netherlands - Market size and forecast 2025-2030

Chart on The Netherlands - Market size and forecast 2025-2030 ($ million)
Data Table on The Netherlands - Market size and forecast 2025-2030 ($ million)
Chart on The Netherlands - Year-over-year growth 2025-2030 (%)
Data Table on The Netherlands - Year-over-year growth 2025-2030 (%)

12.5 North America - Market size and forecast 2025-2030

Chart on North America - Market size and forecast 2025-2030 ($ million)
Data Table on North America - Market size and forecast 2025-2030 ($ million)
Chart on North America - Year-over-year growth 2025-2030 (%)
Data Table on North America - Year-over-year growth 2025-2030 (%)
Chart on Regional Comparison - North America
Data Table on Regional Comparison - North America

12.5.1 US - Market size and forecast 2025-2030

Chart on US - Market size and forecast 2025-2030 ($ million)
Data Table on US - Market size and forecast 2025-2030 ($ million)
Chart on US - Year-over-year growth 2025-2030 (%)
Data Table on US - Year-over-year growth 2025-2030 (%)

12.5.2 Canada - Market size and forecast 2025-2030

Chart on Canada - Market size and forecast 2025-2030 ($ million)
Data Table on Canada - Market size and forecast 2025-2030 ($ million)
Chart on Canada - Year-over-year growth 2025-2030 (%)
Data Table on Canada - Year-over-year growth 2025-2030 (%)

12.5.3 Mexico - Market size and forecast 2025-2030

Chart on Mexico - Market size and forecast 2025-2030 ($ million)
Data Table on Mexico - Market size and forecast 2025-2030 ($ million)
Chart on Mexico - Year-over-year growth 2025-2030 (%)
Data Table on Mexico - Year-over-year growth 2025-2030 (%)

12.6 South America - Market size and forecast 2025-2030

Chart on South America - Market size and forecast 2025-2030 ($ million)
Data Table on South America - Market size and forecast 2025-2030 ($ million)
Chart on South America - Year-over-year growth 2025-2030 (%)
Data Table on South America - Year-over-year growth 2025-2030 (%)
Chart on Regional Comparison - South America
Data Table on Regional Comparison - South America

12.6.1 Brazil - Market size and forecast 2025-2030

Chart on Brazil - Market size and forecast 2025-2030 ($ million)
Data Table on Brazil - Market size and forecast 2025-2030 ($ million)
Chart on Brazil - Year-over-year growth 2025-2030 (%)
Data Table on Brazil - Year-over-year growth 2025-2030 (%)

12.6.2 Argentina - Market size and forecast 2025-2030

Chart on Argentina - Market size and forecast 2025-2030 ($ million)
Data Table on Argentina - Market size and forecast 2025-2030 ($ million)
Chart on Argentina - Year-over-year growth 2025-2030 (%)
Data Table on Argentina - Year-over-year growth 2025-2030 (%)

12.6.3 Chile - Market size and forecast 2025-2030

Chart on Chile - Market size and forecast 2025-2030 ($ million)
Data Table on Chile - Market size and forecast 2025-2030 ($ million)
Chart on Chile - Year-over-year growth 2025-2030 (%)
Data Table on Chile - Year-over-year growth 2025-2030 (%)

12.7 Middle East and Africa - Market size and forecast 2025-2030

Chart on Middle East and Africa - Market size and forecast 2025-2030 ($ million)
Data Table on Middle East and Africa - Market size and forecast 2025-2030 ($ million)
Chart on Middle East and Africa - Year-over-year growth 2025-2030 (%)
Data Table on Middle East and Africa - Year-over-year growth 2025-2030 (%)
Chart on Regional Comparison - Middle East and Africa
Data Table on Regional Comparison - Middle East and Africa

12.7.1 Saudi Arabia - Market size and forecast 2025-2030

Chart on Saudi Arabia - Market size and forecast 2025-2030 ($ million)
Data Table on Saudi Arabia - Market size and forecast 2025-2030 ($ million)
Chart on Saudi Arabia - Year-over-year growth 2025-2030 (%)
Data Table on Saudi Arabia - Year-over-year growth 2025-2030 (%)

12.7.2 UAE - Market size and forecast 2025-2030

Chart on UAE - Market size and forecast 2025-2030 ($ million)
Data Table on UAE - Market size and forecast 2025-2030 ($ million)
Chart on UAE - Year-over-year growth 2025-2030 (%)
Data Table on UAE - Year-over-year growth 2025-2030 (%)

12.7.3 South Africa - Market size and forecast 2025-2030

Chart on South Africa - Market size and forecast 2025-2030 ($ million)
Data Table on South Africa - Market size and forecast 2025-2030 ($ million)
Chart on South Africa - Year-over-year growth 2025-2030 (%)
Data Table on South Africa - Year-over-year growth 2025-2030 (%)

12.7.4 Israel - Market size and forecast 2025-2030

Chart on Israel - Market size and forecast 2025-2030 ($ million)
Data Table on Israel - Market size and forecast 2025-2030 ($ million)
Chart on Israel - Year-over-year growth 2025-2030 (%)
Data Table on Israel - Year-over-year growth 2025-2030 (%)

12.7.5 Turkey - Market size and forecast 2025-2030

Chart on Turkey - Market size and forecast 2025-2030 ($ million)
Data Table on Turkey - Market size and forecast 2025-2030 ($ million)
Chart on Turkey - Year-over-year growth 2025-2030 (%)
Data Table on Turkey - Year-over-year growth 2025-2030 (%)

12.8 Market opportunity by geography

Market opportunity by geography ($ million)
Data Tables on Market opportunity by geography ($ million)

13. Drivers, Challenges, and Opportunity

13.1 Market drivers

Growing shift toward electrified systems
Rising renewable energy deployment momentum
Increasing data center energy efficiency focus

13.2 Market challenges

Substrate supply shortage challenges
Global sourcing challenges from geopolitical conflicts
Rising production cost inflation challenges

13.3 Impact of drivers and challenges

Impact of drivers and challenges in 2025 and 2030

13.4 Market opportunities

Shift toward wide bandgap supremacy
Adopting AI-centric power delivery
Integrated electrification modules

14. Competitive Landscape

14.1 Overview

14.2

Overview on criticality of inputs and factors of differentiation

14.3 Landscape disruption

Overview on factors of disruption

14.4 Industry risks

Impact of key risks on business

15. Competitive Analysis

15.1 Companies profiled

Companies covered

15.2 Company ranking index

15.3 Market positioning of companies

Matrix on companies position and classification

15.4 Diodes Inc.

Diodes Inc. - Overview
Diodes Inc. - Product / Service
Diodes Inc. - Key news
Diodes Inc. - Key offerings
SWOT

15.5 Fuji Electric Co. Ltd.

Fuji Electric Co. Ltd. - Overview
Fuji Electric Co. Ltd. - Business segments
Fuji Electric Co. Ltd. - Key offerings
Fuji Electric Co. Ltd. - Segment focus
SWOT

15.6 Infineon Technologies AG

Infineon Technologies AG - Overview
Infineon Technologies AG - Business segments
Infineon Technologies AG - Key news
Infineon Technologies AG - Key offerings
Infineon Technologies AG - Segment focus
SWOT

15.7 Littelfuse Inc.

Littelfuse Inc. - Overview
Littelfuse Inc. - Business segments
Littelfuse Inc. - Key offerings
Littelfuse Inc. - Segment focus
SWOT

15.8 MagnaChip Semiconductor Corp.

MagnaChip Semiconductor Corp. - Overview
MagnaChip Semiconductor Corp. - Product / Service
MagnaChip Semiconductor Corp. - Key offerings
SWOT

15.9 Microchip Technology Inc.

Microchip Technology Inc. - Overview
Microchip Technology Inc. - Business segments
Microchip Technology Inc. - Key offerings
Microchip Technology Inc. - Segment focus
SWOT

15.10 Mitsubishi Electric Corp.

Mitsubishi Electric Corp. - Overview
Mitsubishi Electric Corp. - Business segments
Mitsubishi Electric Corp. - Key offerings
Mitsubishi Electric Corp. - Segment focus
SWOT

15.11 Monolithic Power Systems Inc.

Monolithic Power Systems Inc. - Overview
Monolithic Power Systems Inc. - Product / Service
Monolithic Power Systems Inc. - Key news
Monolithic Power Systems Inc. - Key offerings
SWOT

15.12 NXP Semiconductors NV

NXP Semiconductors NV - Overview
NXP Semiconductors NV - Business segments
NXP Semiconductors NV - Key news
NXP Semiconductors NV - Key offerings
NXP Semiconductors NV - Segment focus
SWOT

15.13 ON Semiconductor Corp.

ON Semiconductor Corp. - Overview
ON Semiconductor Corp. - Business segments
ON Semiconductor Corp. - Key offerings
ON Semiconductor Corp. - Segment focus
SWOT

15.14 Renesas Electronics Corp.

Renesas Electronics Corp. - Overview
Renesas Electronics Corp. - Business segments
Renesas Electronics Corp. - Key news
Renesas Electronics Corp. - Key offerings
Renesas Electronics Corp. - Segment focus
SWOT

15.15 ROHM Co. Ltd.

ROHM Co. Ltd. - Overview
ROHM Co. Ltd. - Business segments
ROHM Co. Ltd. - Key news
ROHM Co. Ltd. - Key offerings
ROHM Co. Ltd. - Segment focus
SWOT

15.16 STMicroelectronics NV

STMicroelectronics NV - Overview
STMicroelectronics NV - Business segments
STMicroelectronics NV - Key offerings
STMicroelectronics NV - Segment focus
SWOT

15.17 Texas Instruments Inc.

Texas Instruments Inc. - Overview
Texas Instruments Inc. - Business segments
Texas Instruments Inc. - Key offerings
Texas Instruments Inc. - Segment focus
SWOT

15.18 Vishay Intertechnology Inc.

Vishay Intertechnology Inc. - Overview
Vishay Intertechnology Inc. - Business segments
Vishay Intertechnology Inc. - Key news
Vishay Intertechnology Inc. - Key offerings
Vishay Intertechnology Inc. - Segment focus
SWOT

16. Appendix

16.1 Scope of the report

Market definition
Objectives
Notes and caveats

16.2 Inclusions and exclusions checklist

Inclusions checklist
Exclusions checklist

16.3 Currency conversion rates for US$

16.4 Research methodology

16.5 Data procurement

Information sources

16.6 Data validation

16.7 Validation techniques employed for market sizing

16.8 Data synthesis

16.9 360 degree market analysis

16.10 List of abbreviations

Research Methodology

Technavio presents a detailed picture of the market by way of study, synthesis, and summation of data from multiple sources. The analysts have presented the various facets of the market with a particular focus on identifying the key industry influencers. The data thus presented is comprehensive, reliable, and the result of extensive research, both primary and secondary.

INFORMATION SOURCES

Primary sources

  • Manufacturers and suppliers
  • Channel partners
  • Industry experts
  • Strategic decision makers

Secondary sources

  • Industry journals and periodicals
  • Government data
  • Financial reports of key industry players
  • Historical data
  • Press releases

DATA ANALYSIS

Data Synthesis

  • Collation of data
  • Estimation of key figures
  • Analysis of derived insights

Data Validation

  • Triangulation with data models
  • Reference against proprietary databases
  • Corroboration with industry experts

REPORT WRITING

Qualitative

  • Market drivers
  • Market challenges
  • Market trends
  • Five forces analysis

Quantitative

  • Market size and forecast
  • Market segmentation
  • Geographical insights
  • Competitive landscape

Interested in this report?

Get your sample now to see our research methodology and insights!

Download Now

Frequently Asked Questions

Power Semiconductor market growth will increase by USD 15596.2 million during 2026-2030.

The Power Semiconductor market is expected to grow at a CAGR of 8.9% during 2026-2030.

Power Semiconductor market is segmented by Application (Automotive, Industrial power control, Others) Material (Silicon, Silicon carbide, Gallium nitride) Component (Discrete, Module, Power ICs)

Alpha and Omega Semiconductor, Diodes Inc., Fuji Electric Co. Ltd., Infineon Technologies AG, Littelfuse Inc., MagnaChip Semiconductor Corp., Microchip Technology Inc., Mitsubishi Electric Corp., Monolithic Power Systems Inc., Navitas Semiconductor Inc., Nexperia BV, NXP Semiconductors NV, ON Semiconductor Corp., Renesas Electronics Corp., ROHM Co. Ltd., Shindengen Electric Co. Ltd., STMicroelectronics NV, Texas Instruments Inc., Vishay Intertechnology Inc., Wolfspeed Inc. are a few of the key vendors in the Power Semiconductor market.

APAC will register the highest growth rate of 59.1% among the other regions. Therefore, the Power Semiconductor market in APAC is expected to garner significant business opportunities for the vendors during the forecast period.

China, Japan, South Korea, India, Australia, Indonesia, Germany, UK, France, Italy, Spain, The Netherlands, US, Canada, Mexico, Brazil, Argentina, Chile, Saudi Arabia, UAE, South Africa, Israel, Turkey

  • Growing shift toward electrified systems is the driving factor this market.

The Power Semiconductor market vendors should focus on grabbing business opportunities from the Application segment as it accounted for the largest market share in the base year.
RIA - Research AI Assistant
Ask RIA