Singapore Hose Market Size 2025-2029
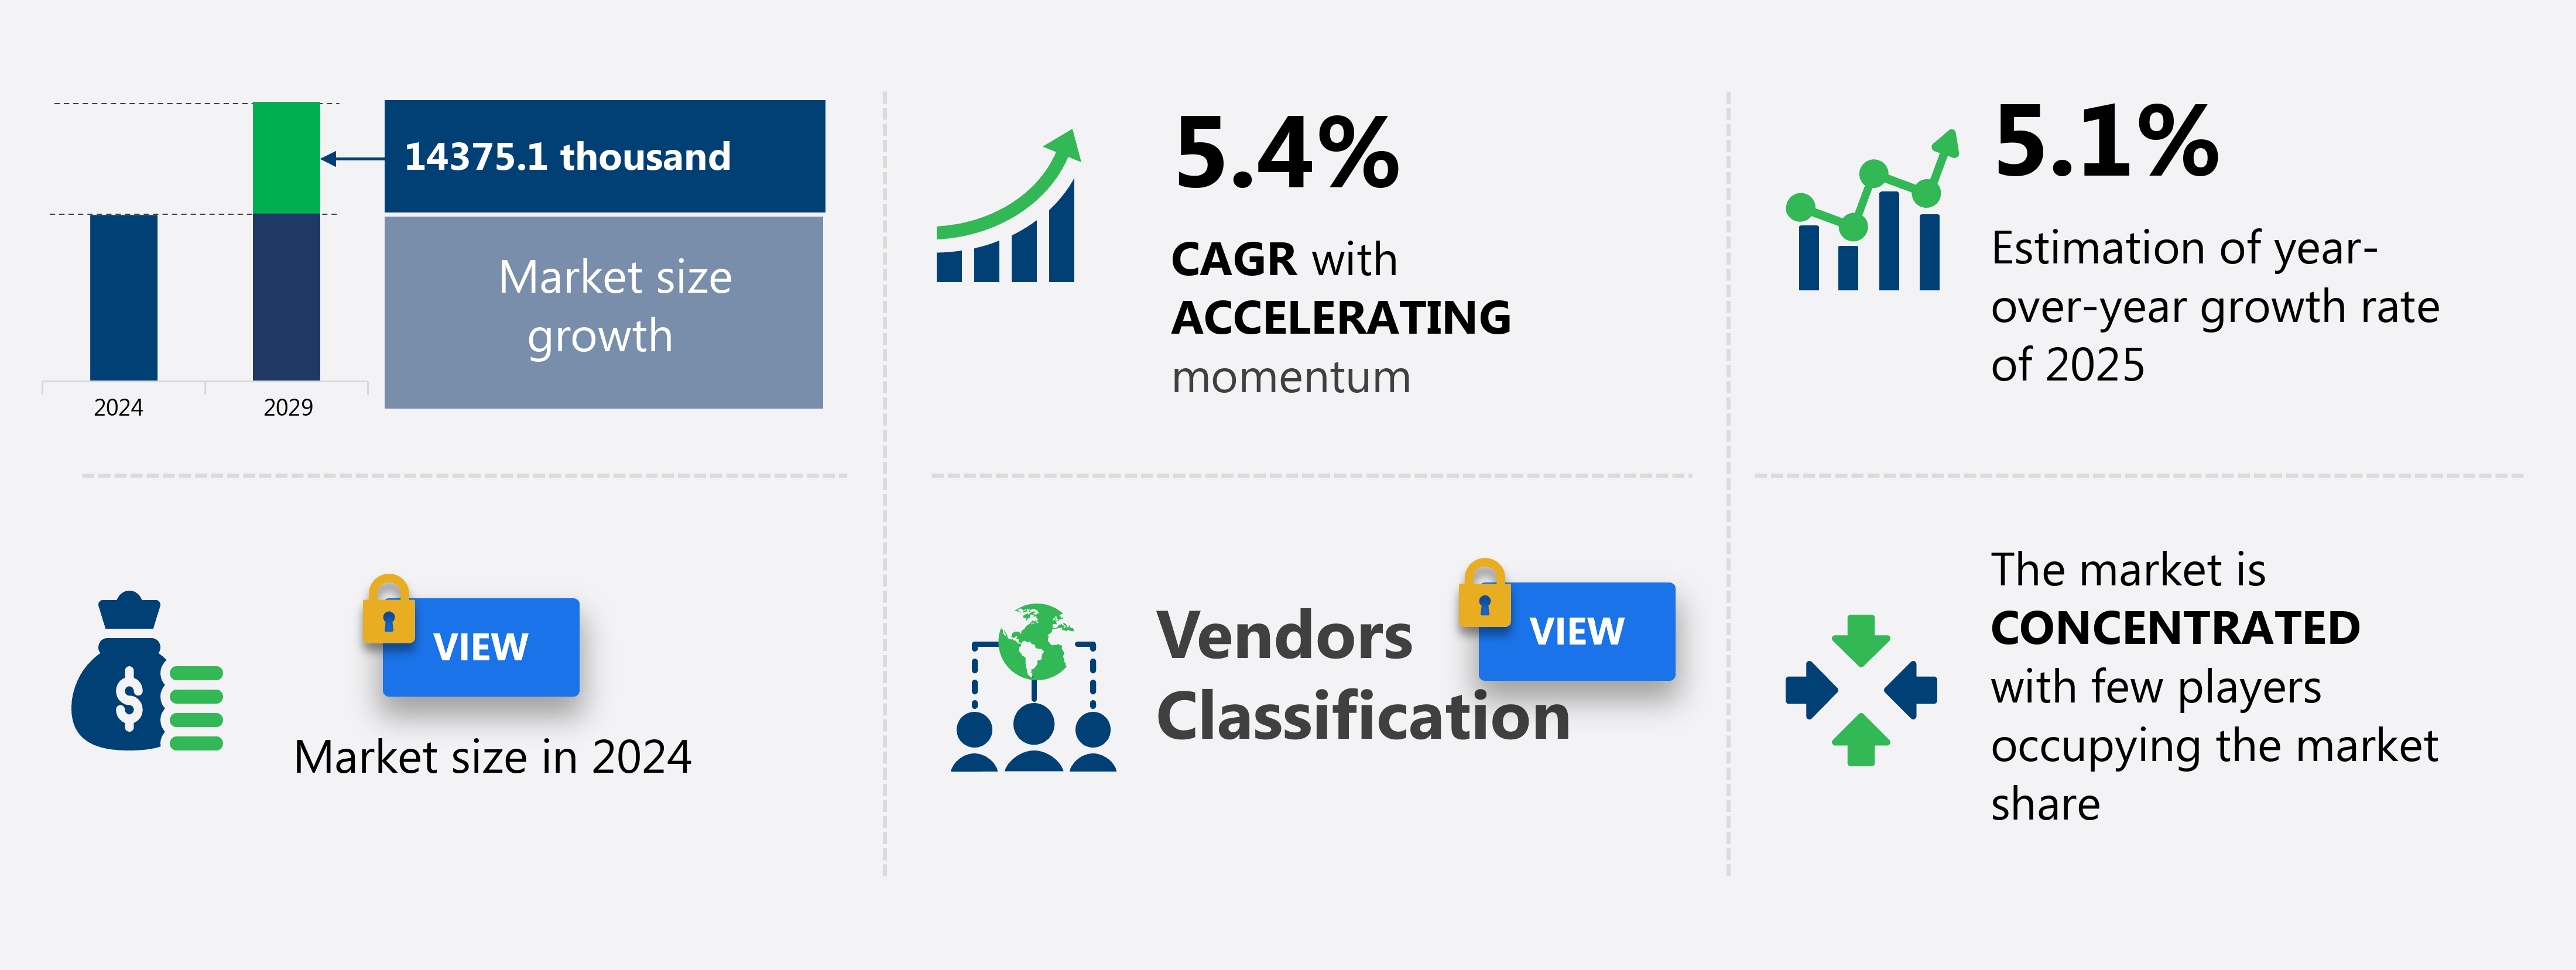
The Singapore hose market size is forecast to increase by 14375.1 thousand units at a CAGR of 5.4% between 2024 and 2029.
- The market is experiencing significant growth, driven primarily by the expansion of the construction industry. . The expansion of the construction industry, particularly in North America, is driving market demand. Additionally, there is a growing preference for eco-friendly materials in hose production, as sustainability becomes a priority for businesses and consumers alike. Applications include irrigation, water systems, and HVAC systems, where efficient and dependable fluid transfer is vital. However, market growth is not without challenges. Strict regulatory compliance poses a significant hurdle, as hose manufacturers must adhere to stringent safety and environmental standards.
- Furthermore, supply chain inconsistencies temper growth potential, as raw material availability and price fluctuations can impact production schedules and profitability. Companies seeking to capitalize on market opportunities must navigate these challenges effectively by implementing robust supply chain management strategies and staying abreast of regulatory changes. Adhering to these requirements and offering eco-friendly solutions will position businesses for long-term success in the dynamic the market.
What will be the size of the Singapore Hose Market during the forecast period?
- The market is characterized by a diverse range of products, including PVC, silicone, stainless steel, PTFE, and rubber hoses, among others. Hose testing equipment is essential for ensuring hose reliability and performance in various applications, from industrial processes to transportation. Hose disposal and recycling have gained significance due to growing environmental concerns, leading to the development of hose optimization and hose management systems. Hose crimping machines facilitate efficient installation, while hose inspection services ensure compliance with safety regulations. Hose competition is fierce, with synthetic hoses and hose technology driving innovation and improving hose durability and hose pricing.
- Hose trends include customization and automation, as well as the integration of IoT and AI in hose management systems. Hose demand is driven by diverse industries, including oil and gas, manufacturing, and construction, while the hose supply chain faces challenges in ensuring timely delivery and quality control. Hose applications continue to expand, from automotive to aerospace, necessitating ongoing research and development in hose design, hose routing, and hose hose performance.
How is this market segmented?
The market research report provides comprehensive data (region-wise segment analysis), with forecasts and estimates in "USD thousand" for the period 2025-2029, as well as historical data from 2019-2023 for the following segments.
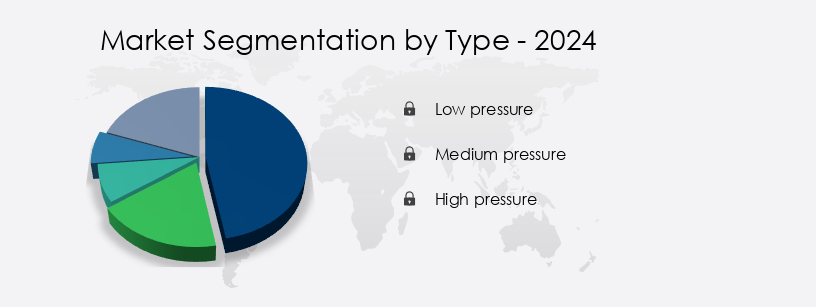
- Type
- Low pressure
- Medium pressure
- High pressure
- Material
- Rubber hoses
- Plastic hoses
- Others
- End-user
- Industrial
- Automotive and transportation
- Commercial
- Agriculture
- Residential
- Distribution Channel
- Direct Sales
- Distributors
- Online Retail
- Application
- Construction
- Manufacturing
- Oil and Gas
- Marine
- Geography
- APAC
- Singapore
- APAC
By Type Insights
The low pressure segment is estimated to witness significant growth during the forecast period.
In Singapore's hose market, low pressure hoses hold significant importance, catering to industries that necessitate the transfer of fluids or gases at sub-optimal pressures. These hoses are indispensable for applications such as irrigation, water systems, and HVAC, where efficient and dependable fluid transfer is vital. The advantages of low pressure hoses include their lightweight and pliable construction, which facilitates ease of handling and installation. Commonly manufactured from materials like PVC or rubber, these hoses offer the necessary flexibility and durability for various applications. Industrial Automation integrates hose assemblies and reels, enhancing production efficiency. Hose safety standards mandate regular maintenance, testing, and certification for hoses, ensuring their pressure resistance, temperature resistance, abrasion resistance, and compliance with regulations.
Hose materials, such as braided hoses, spiral hoses, and hose clamps, contribute to the hose's overall performance and longevity. Hose fittings and couplings ensure secure fluid transfer, while hose crimping ensures airtight seals. The manufacturing industry and marine industry extensively utilize industrial hoses, including high-pressure hoses, pneumatic hoses, water hoses, hydraulic hoses, fuel hoses, and chemical hoses. Hose life expectancy depends on factors like hose diameter, hose length, and hose flow rate. Hose repair and replacement are crucial for maintaining optimal performance and ensuring Workplace Safety.
The Low pressure segment was valued at 18.88 thousand in 2019 and showed a gradual increase during the forecast period.
Market Dynamics
The Hose market Singapore is experiencing robust growth, driven by diverse industrial needs. As leading hose suppliers Singapore and hose manufacturers Singapore, companies offer a wide range of products including durable industrial hoses Singapore and high-performance hydraulic hoses Singapore. Key product categories include rubber hoses Singapore and PVC hoses Singapore, complemented by essential hose fittings Singapore and expert hose assembly Singapore services. Demand remains strong across sectors like marine hoses Singapore, oil and gas hoses Singapore, and construction hoses Singapore. Specialized requirements for food grade hoses Singapore, chemical transfer hoses Singapore, and fire hoses Singapore further diversify the market. We also provide high pressure hoses Singapore, flexible hoses Singapore, stainless steel braided hoses Singapore, and offer reliable custom hose fabrication Singapore and efficient hose repair Singapore.
Our researchers analyzed the data with 2024 as the base year, along with the key drivers, trends, and challenges. A holistic analysis of drivers will help companies refine their marketing strategies to gain a competitive advantage.
What are the Singapore Hose Market market drivers leading to the rise in adoption of the Industry?
- The expansion of the construction industry serves as the primary catalyst for market growth.
- The Singapore hose market experiences growth due to the expansion of the construction industry. In 2024, the sector's productivity increased by 12%, surpassing the country's GDP growth rate of 2-3%. This significant growth in construction activity has resulted in a considerable rise in the demand for various hose types, such as water supply, concrete pumping, and equipment operation hoses. The construction sector's critical role in Singapore's economic development is underscored by its total construction volume exceeding USD 20 billion by the end of 2024.
- Hose material, hose pressure rating, spiral hoses, hose length, hose clamps, air hoses, hose crimping, and chemical hoses are essential components in catering to the diverse needs of the construction industry. The demand for these hose solutions continues to escalate, driven by the industry's unrelenting expansion.
What are the Singapore Hose Market market trends shaping the Industry?
- The use of eco-friendly materials is becoming increasingly popular and is a notable market trend. It is essential for businesses to adopt sustainable practices by incorporating these materials into their products and operations.
- The market is experiencing a notable shift towards the utilization of eco-friendly hose materials. This trend is fueled by escalating environmental consciousness and regulatory pressures, which aim to lessen the environmental impact of industrial operations. Hose manufacturers are prioritizing the development of hoses constructed from sustainable and recyclable materials to cater to the expanding demand for eco-friendly products. The growing emphasis on sustainability is a significant factor driving this trend. As environmental issues gain prominence, there is a heightened preference for products that minimize ecological footprints. Consequently, there is an increasing demand for hoses fabricated from eco-friendly materials, such as biodegradable polymers and recycled plastics.
- Hose maintenance, including hose assemblies and hose reels, is also undergoing advancements with the integration of industrial automation. This enhances hose life expectancy, ensuring high-pressure hoses and industrial hoses function optimally while maintaining hose burst pressure and working pressure at required levels, regardless of hose diameter.
How does Singapore Hose Market market faces challenges face during its growth?
- Compliance with stringent regulations poses a significant challenge to the industry's growth trajectory.
- The market faces rigorous regulatory compliance, particularly in the water management sector. Hoses used for irrigation and drainage must meet the stringent regulations set by the Public Utilities Board (PUB), ensuring materials do not contaminate water supplies. These regulations prioritize water efficiency and environmental protection, necessitating hoses with minimal leaks and waste. Manufacturers must use high-quality materials and advanced manufacturing processes to produce compliant hoses, increasing production costs. Flexible hoses, including braided and temperature-resistant types, are essential for various industries, such as fuel and construction. Hose safety standards mandate pressure resistance, abrasion resistance, and hose fittings that meet specific industry requirements.
- Hose certifications, such as those from recognized organizations, ensure compliance with these standards. Hose testing is crucial to ensure hose performance under various conditions. In the fuel industry, hose safety is paramount due to the potential hazards involved. Hose carts facilitate easy transportation and storage of hoses, enhancing operational efficiency. The market requires manufacturers to adhere to strict regulatory compliance, utilizing high-quality materials and advanced manufacturing processes to produce hoses that meet the industry's rigorous safety and environmental standards.
Exclusive Singapore Hose Market Customer Landscape
The market forecasting report includes the adoption lifecycle of the market, covering from the innovator's stage to the laggard's stage. It focuses on adoption rates in different regions based on penetration. Furthermore, the report also includes key purchase criteria and drivers of price sensitivity to help companies evaluate and develop their market growth analysis strategies.
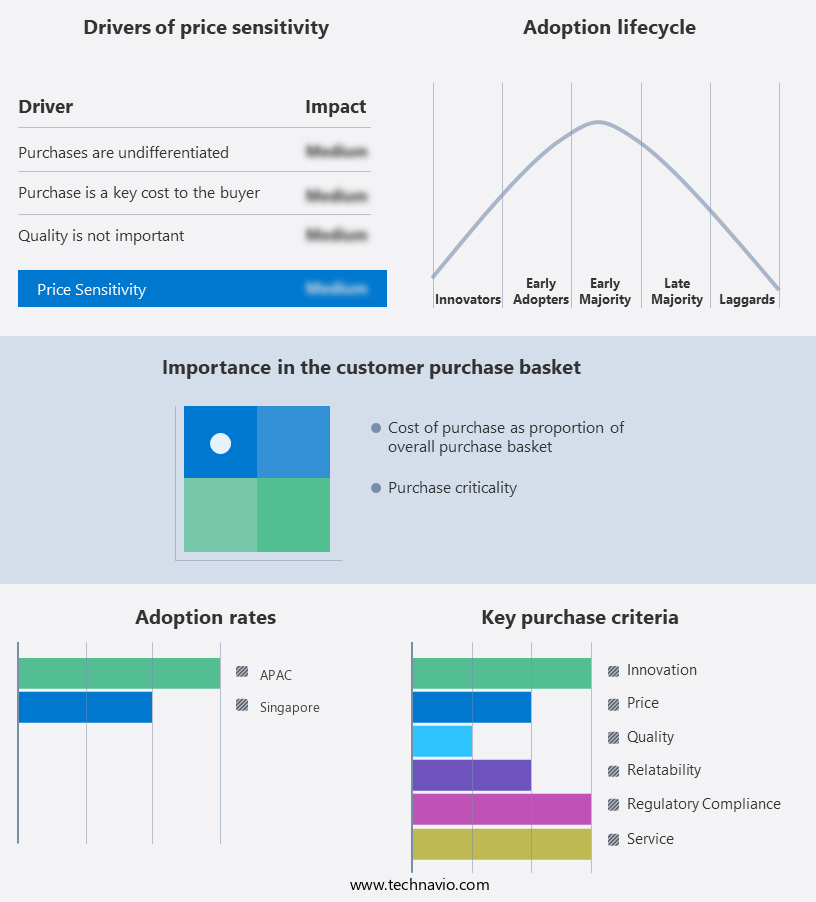
Customer Landscape
Key Companies & Market Insights
Companies are implementing various strategies, such as strategic alliances, market forecast partnerships, mergers and acquisitions, geographical expansion, and product/service launches, to enhance their presence in the market.
The market research and growth report includes detailed analyses of the competitive landscape of the market and information about key companies, including:
- Alfagomma S.p.A.
- Bridgestone Corporation
- Colex International Ltd.
- Continental AG
- Eaton Corporation plc
- Flexaust Inc.
- Gates Industrial Corporation plc
- Heng Seng Pte Ltd.
- Kuriyama of America, Inc.
- Manuli Hydraulics
- Norres Schlauchtechnik GmbH
- Pacific Hoseflex
- Parker-Hannifin Corporation
- Ryco Hydraulics
- Semperit AG Holding
- Sumitomo Riko Company Ltd.
- Toyox Co. Ltd.
- Transfer Oil S.p.A.
- Trelleborg AB
- Yokohama Rubber Co. Ltd.
Qualitative and quantitative analysis of companies has been conducted to help clients understand the wider business environment as well as the strengths and weaknesses of key market players. Data is qualitatively analyzed to categorize companies as pure play, category-focused, industry-focused, and diversified; it is quantitatively analyzed to categorize companies as dominant, leading, strong, tentative, and weak.
Recent Development and News in Hose Market In Singapore
- In February 2024, Singapore-based hose manufacturer, Pulsecorp, announced the launch of its new line of high-pressure hoses, engineered to cater to the growing demands of the offshore oil and gas sector in Singapore. These hoses offer enhanced durability and flexibility, enabling improved operational efficiency and safety.
- In May 2025, hose supplier, HoseTech, entered into a strategic partnership with local engineering firm, Engitech, to expand their offerings and cater to the increasing demand for engineered hose solutions in the marine and offshore industries. This collaboration combines HoseTech's expertise in hose manufacturing and Engitech's engineering capabilities, offering clients customized and integrated hose solutions.
- In August 2024, Singapore's Economic Development Board (EDB) announced a SGD 10 million grant to support the expansion of hose manufacturer, HoseAsia . This grant is aimed at increasing the company's production capacity and enabling it to meet the growing demand for hoses in the region.
- In October 2024, Singapore-based hose manufacturer, HoseLink, showcased its latest innovation, a smart hose system, at the Singapore International Water Week . This system uses advanced sensors and IoT technology to monitor hose performance and detect potential issues in real-time, significantly reducing downtime and maintenance costs for industrial applications.
Research Analyst Overview
The market continues to evolve, driven by the diverse demands of various sectors. Industrial automation, manufacturing, marine, and construction industries, among others, rely on a wide range of hose solutions to facilitate fluid transfer and ensure operational efficiency. Hose maintenance plays a crucial role in prolonging the life expectancy of these systems, with regular inspections and repairs essential for maintaining optimal hose performance. Hose assemblies, reels, and certifications are integral components of this dynamic market. Industrial hoses, available in various diameters and pressure ratings, cater to high-pressure applications, while flexible hoses offer the flexibility required for complex fluid transfer systems.
Hose burst pressure and working pressure are critical factors in determining the suitability of hoses for specific applications. Braided hoses, reinforced hoses, and spiral hoses provide pressure resistance, temperature resistance, and abrasion resistance, respectively. Hose safety standards, hose fittings, hose clamps, and hose couplings ensure the safe and efficient operation of hose systems. Hose testing and hose replacement are ongoing processes that contribute to the continuous improvement of hose technology. Applications span from fuel hoses in the transportation sector to pneumatic hoses in manufacturing and water hoses in construction. Hose materials, such as rubber, steel, and thermoplastic, are continually evolving to meet the demands of various industries.
The ongoing development of hose technology and the evolving needs of industries ensure a dynamic and ever-changing the market.
Dive into Technavio's robust research methodology, blending expert interviews, extensive data synthesis, and validated models for unparalleled Hose Market in Singapore insights. See full methodology.
|
Market Scope |
|
|
Report Coverage |
Details |
|
Page number |
169 |
|
Base year |
2024 |
|
Historic period |
2019-2023 |
|
Forecast period |
2025-2029 |
|
Growth momentum & CAGR |
Accelerate at a CAGR of 5.4% |
|
Market growth 2025-2029 |
14375.1 thousand |
|
Market structure |
Concentrated |
|
YoY growth 2024-2025(%) |
5.1 |
|
Competitive landscape |
Leading Companies, Market Positioning of Companies, Competitive Strategies, and Industry Risks |
What are the Key Data Covered in this Market Research Report?
- CAGR of the market during the forecast period
- Detailed information on factors that will drive the market growth and forecasting between 2025 and 2029
- Precise estimation of the size of the market and its contribution of the market in focus to the parent market
- Accurate predictions about upcoming market growth and trends and changes in consumer behaviour
- Growth of the market across Singapore
- Thorough analysis of the market's competitive landscape and detailed information about companies
- Comprehensive analysis of factors that will challenge the growth of market companies
Have questions about our market research report? Connect with our Principal Consultant for exclusive insights.
 RIA -
RIA - 
