Smart-Connected Pet Collars Market Size 2025-2029
The smart-connected pet collars market size is forecast to increase by USD 846.5 million, at a CAGR of 11% between 2024 and 2029.
- The market is driven by the strong bond between pet owners and their animals, leading to an increasing demand for advanced pet care solutions. This market is witnessing significant growth due to the launch of innovative products offering real-time tracking, health monitoring, and activity monitoring features. However, network connectivity issues pose a challenge in ensuring seamless communication between the collar and the owner's device, which may hinder market expansion.
- Companies looking to capitalize on this market's potential must focus on addressing connectivity concerns and ensuring user-friendly interfaces to cater to the growing demand for smart pet care solutions.
What will be the Size of the Smart-Connected Pet Collars Market during the forecast period?

Explore in-depth regional segment analysis with market size data - historical 2019-2023 and forecasts 2025-2029 - in the full report.
Request Free Sample
The smart-connected pet collar market continues to evolve, driven by advancements in technology and the growing demand for innovative solutions to enhance pet care and safety. Pet behavior analysis, RFID technology, data analytics, Bluetooth connectivity, and NFC technology are integral components of these collars, offering features such as real-time location tracking, bark detection, and motion sensors. These collars cater to various pet breeds and sizes, with adjustable designs ensuring a comfortable fit. Privacy concerns and data security are paramount, with encryption and secure cloud platforms ensuring pet data remains confidential. Smartphone apps enable remote control of collar functions, allowing pet owners to monitor their pets' activity levels, health, and behavior.
Social media integration allows pet communities to connect and share experiences. Cat collars and dog collars alike incorporate advanced features such as voice recognition, virtual fencing, and pet training tools. Cellular connectivity and Wi-Fi compatibility offer uninterrupted communication between collar and owner. Collar materials, weight, and aesthetics are also considered, ensuring a stylish and functional product. Subscriptions services provide ongoing support and updates, while collar adjustability and collar design cater to individual pet needs. Veterinarian integration offers peace of mind, ensuring pet wellbeing is a priority. Biometric sensors and LED indicators provide valuable health information, while anti-theft features and escape prevention offer added security.
The market's continuous dynamism reflects the ongoing commitment to improving pet care and enhancing the bond between pets and their owners.
How is this Smart-Connected Pet Collars Industry segmented?
The smart-connected pet collars industry research report provides comprehensive data (region-wise segment analysis), with forecasts and estimates in "USD million" for the period 2025-2029, as well as historical data from 2019-2023 for the following segments.
- Distribution Channel
- Offline
- Online
- Application
- Dogs
- Cats
- Component
- Displays
- GPS chips
- Bluetooth chips
- Sensors
- Geography
- North America
- US
- Canada
- Europe
- France
- Germany
- Italy
- UK
- APAC
- China
- India
- Japan
- South Korea
- Rest of World (ROW)
- North America
.
By Distribution Channel Insights
The offline segment is estimated to witness significant growth during the forecast period.
The smart-connected pet collar market is witnessing significant growth as pet owners prioritize their furry friends' safety and wellbeing. These advanced collars offer various features such as microchip compatibility, GPS tracking, voice recognition, virtual fencing, and pet health monitoring. Large breed collars and collar fit ensure comfort and security, while anti-theft features and RFID technology enhance pet safety. Pet community features and social media integration facilitate lost pet recovery, and pet insurance integration offers added peace of mind. Data security is a crucial consideration, ensuring privacy concerns are addressed. Collars are designed with various materials, weights, and aesthetics to cater to different breeds and preferences.
Subscription services, activity monitoring, and location tracking enable real-time updates on pet behavior and whereabouts. Smartphone apps, Bluetooth connectivity, and cellular connectivity offer seamless control and convenience. Water resistance, Wi-Fi connectivity, and collar adjustability are essential features for active pets. Department stores, including Tesco Plc (Tesco), Walmart Inc. (Walmart), and Target Corp. (Target), are popular offline retailers for smart-connected pet collars. Their large stock-keeping units, effective customer service, and competitive pricing attract customers. Convenience and brand variety are significant factors influencing purchases. These retailers cater to various breeds with small and large breed collars, offering a wide range of designs and features.
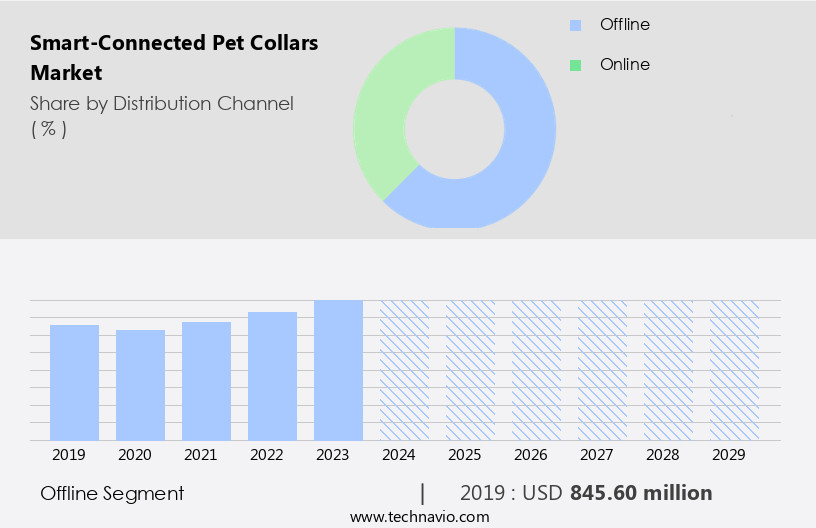
The Offline segment was valued at USD 845.60 million in 2019 and showed a gradual increase during the forecast period.
Regional Analysis
North America is estimated to contribute 33% to the growth of the global market during the forecast period. Technavio's analysts have elaborately explained the regional trends and drivers that shape the market during the forecast period.
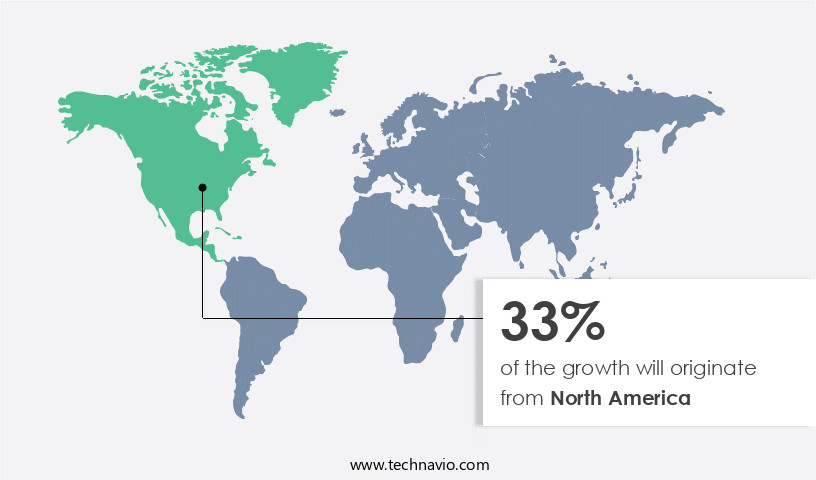
The North American market for smart-connected pet collars is experiencing significant growth, driven by the region's strong affinity for pets and the expanding pet industry. These advanced collars offer features such as microchip compatibility, pet safety, lost pet recovery through GPS tracking, long battery life, voice recognition, virtual fencing, large breed collars with adjustable fits, and anti-theft protection. Additionally, ultrasonic technology, pet insurance integration, data security, pet community features, pet health monitoring, led indicators, collar weight, subscription services, activity monitoring, location tracking, cloud platform, smart collar features, veterinarian integration, pet wellbeing, biometric sensors, pet behavior analysis, rfid technology, data analytics, bluetooth and NFC connectivity, bark detection, privacy concerns, smartphone apps, motion detection, pet training, social media integration, cellular connectivity, collar comfort, collar aesthetics, remote control, water resistance, wi-fi connectivity, and various collar materials cater to diverse pet owner needs.
The increasing popularity of smart technology and easy access to pet-related applications further fuel market growth.
Market Dynamics
Our researchers analyzed the data with 2024 as the base year, along with the key drivers, trends, and challenges. A holistic analysis of drivers will help companies refine their marketing strategies to gain a competitive advantage.
What are the key market drivers leading to the rise in the adoption of Smart-Connected Pet Collars Industry?
- The strong bond between pet owners and their pets is a primary driving force in the market, underpinned by the deep commitment and devotion pet owners have towards their animals.
- Smart-connected pet collars have emerged as an innovative solution for pet owners seeking to enhance their pets' health and wellbeing. These collars come with advanced features such as activity monitoring, location tracking, and pet health monitoring using biometric sensors. The collars often include LED indicators, collar adjustability, and veterinarian integration to ensure optimal pet care. Subscription services allow real-time access to the data through mobile applications, enabling owners to keep track of their pets' behavior and health status. The immersive and harmonious design of these collars emphasizes the importance of preserving the pet community's connectivity and fostering a stronger bond between pets and their owners.
- The growth of the pet industry is fueled by the increasing number of nuclear families, leading to a rise in pet adoption rates. By integrating wireless technology, cloud platforms, and ultrasonic whistles, smart collar features cater to the evolving needs of modern pet ownership.
What are the market trends shaping the Smart-Connected Pet Collars Industry?
- The market is currently witnessing a significant trend towards product launches. This emerging market is characterized by the increasing demand for advanced technologies that enable pet owners to monitor and interact with their pets remotely.
- The market for smart-connected pet collars is experiencing significant growth due to the increasing number of pet owners seeking innovative solutions for monitoring their pets' health and behavior. Companies are responding to this demand by introducing new products with advanced features such as RFID technology for pet identification, data analytics for personalized pet care, Bluetooth connectivity for real-time tracking, and NFC technology for contactless interactions. Some collars even offer bark detection, motion detection, and pet training capabilities, while others integrate with social media platforms and offer cellular connectivity for remote monitoring. Despite the benefits, privacy concerns have emerged as a potential challenge for the market.
- Pet owners must ensure that their pets' data is securely stored and transmitted. Manufacturers must prioritize data security to build trust with their customers. Recent product launches have included Tractive's next-generation dog tracker, which combines real-time GPS tracking with advanced health and behavior monitoring. Tractive also introduced Heart Rate and Respiratory Rate Monitoring as its most advanced features yet. These innovations underscore the market's dynamic nature and the competitive pressure to offer the latest features to attract and retain customers.
What challenges does the Smart-Connected Pet Collars Industry face during its growth?
- Network connectivity issues represent a significant challenge to the industry's growth. This problem is a critical concern that requires immediate attention and resolution to ensure uninterrupted business operations and optimal productivity.
- Smart-connected pet collars have gained popularity due to their advanced features, enhancing pet care and owner convenience. Collar comfort and aesthetics are essential considerations, with many collars offering lightweight designs and various materials. Some collars come with remote control options, enabling users to manage settings or trigger functions from a distance. Water resistance is another essential feature, ensuring the collar functions effectively in various weather conditions. Wi-fi connectivity is a significant market trend, allowing real-time tracking and monitoring of pets. Collars for small breeds are also available, ensuring proper fit and functionality for all pet sizes. Light features, such as LED lights, add visibility during nighttime walks or outdoor activities.
- Escape prevention is another crucial feature, employing GPS technology to alert owners if their pet leaves a designated area. Manufacturers like SCOLLAR offer Wi-Fi base stations, which turn off the GPS signal when the pet is within the Wi-Fi range, increasing battery backup. However, Wi-Fi connectivity has its limitations, such as bandwidth constraints and slower speeds when multiple devices are connected. Despite these challenges, the market for smart-connected pet collars continues to evolve, offering innovative solutions to cater to pet owners' needs.
Exclusive Customer Landscape
The smart-connected pet collars market forecasting report includes the adoption lifecycle of the market, covering from the innovator's stage to the laggard's stage. It focuses on adoption rates in different regions based on penetration. Furthermore, the smart-connected pet collars market report also includes key purchase criteria and drivers of price sensitivity to help companies evaluate and develop their market growth analysis strategies.

Customer Landscape
Key Companies & Market Insights
Companies are implementing various strategies, such as strategic alliances, smart-connected pet collars market forecast, partnerships, mergers and acquisitions, geographical expansion, and product/service launches, to enhance their presence in the industry.
Barking Labs Corp. - This company specializes in advanced pet technology, providing smart-connected collars for pets.
The industry research and growth report includes detailed analyses of the competitive landscape of the market and information about key companies, including:
- Barking Labs Corp.
- Dogtra Co.
- Eureka Technology Partners LLC
- Findster Technologies SA
- FitBark Inc.
- Garmin Ltd.
- Gibi Technologies Inc.
- Loc8tor Ltd.
- Mars Inc.
- Pawscout Inc.
- PetPace
- Pitpatpet Ltd.
- Radio Systems Corp.
- RAWR Inc.
- SCOLLAR Inc.
- SGI Venture Ltd.
- Smart Tracking Technologies LLC
- Tractive GmbH
- UbiSight Technology LLC
- Wagz Inc.
Qualitative and quantitative analysis of companies has been conducted to help clients understand the wider business environment as well as the strengths and weaknesses of key industry players. Data is qualitatively analyzed to categorize companies as pure play, category-focused, industry-focused, and diversified; it is quantitatively analyzed to categorize companies as dominant, leading, strong, tentative, and weak.
Recent Development and News in Smart-Connected Pet Collars Market
- In March 2024, Whistle, a leading pet tech company, introduced the Whistle GO Explore GPS Tracker and Health Monitor, a smart-connected pet collar that combines real-time location tracking with advanced health monitoring features (Whistle press release). This innovation allows pet owners to monitor their pets' location and health status in real-time, enhancing peace of mind and pet care.
- In July 2024, Samsung Electronics and Garmin Ltd. Announced a strategic partnership to develop smart pet collars with advanced features, such as activity tracking, health monitoring, and GPS location services (Samsung press release). This collaboration brings together Samsung's expertise in electronics and Garmin's experience in wearable technology for pets, potentially expanding their market presence and offering enhanced solutions to pet owners.
- In October 2024, Link-A-Pet, a prominent player in the smart-connected pet collar market, raised USD15 million in a Series C funding round led by Sequoia Capital India and Qualcomm Ventures (Crunchbase). The funds will be used to expand their product offerings, enhance their technology, and strengthen their market position, positioning them for significant growth in the competitive market.
- In February 2025, the European Union approved new regulations for the use of GPS tracking in pet collars, allowing for increased safety and location accuracy (European Commission press release). This approval is expected to boost the adoption of smart-connected pet collars in Europe, as pet owners can now rely on more accurate and reliable location services to keep their pets safe.
Research Analyst Overview
- The smart-connected pet collar market is experiencing significant growth, driven by advancements in pet technology. These collars offer features such as pet communication, pet rescue operations, and real-time pet activity data. Animal shelters and welfare organizations utilize pet technology standards to streamline adoption processes, while pet nutrition data and grooming tools help ensure optimal pet health. Artificial intelligence and machine learning enable predictive analytics for behavioral analysis and personalized pet training aids. Pet wearables integrate with smart home systems for convenience, and emergency contacts ensure quick response in case of emergencies.
- Pet camera integration provides remote monitoring, while pet advocacy groups promote pet technology certification for safety and reliability. Pet health data and healthcare services offer comprehensive care, and pet technology regulations ensure ethical use of data. Pet food delivery and microchip scanners streamline daily pet care tasks, making the lives of pet owners more convenient and connected.
Dive into Technavio's robust research methodology, blending expert interviews, extensive data synthesis, and validated models for unparalleled Smart-Connected Pet Collars Market insights. See full methodology.
|
Market Scope |
|
|
Report Coverage |
Details |
|
Page number |
213 |
|
Base year |
2024 |
|
Historic period |
2019-2023 |
|
Forecast period |
2025-2029 |
|
Growth momentum & CAGR |
Accelerate at a CAGR of 11% |
|
Market growth 2025-2029 |
USD 846.5 million |
|
Market structure |
Fragmented |
|
YoY growth 2024-2025(%) |
9.7 |
|
Key countries |
US, France, China, Germany, Canada, Japan, India, UK, Italy, and South Korea |
|
Competitive landscape |
Leading Companies, Market Positioning of Companies, Competitive Strategies, and Industry Risks |
What are the Key Data Covered in this Smart-Connected Pet Collars Market Research and Growth Report?
- CAGR of the Smart-Connected Pet Collars industry during the forecast period
- Detailed information on factors that will drive the growth and forecasting between 2025 and 2029
- Precise estimation of the size of the market and its contribution of the industry in focus to the parent market
- Accurate predictions about upcoming growth and trends and changes in consumer behaviour
- Growth of the market across North America, Europe, APAC, South America, and Middle East and Africa
- Thorough analysis of the market's competitive landscape and detailed information about companies
- Comprehensive analysis of factors that will challenge the smart-connected pet collars market growth of industry companies
We can help! Our analysts can customize this smart-connected pet collars market research report to meet your requirements.
 RIA -
RIA - 
