Smart Gas Market Analysis North America, Europe, APAC, Middle East and Africa, South America - US, Germany, UK, Japan, China - Size and Forecast 2024-2028

Smart Gas Market Analysis North America, Europe, APAC, Middle East and Africa, South America - US, Germany, UK, Japan, China - Size and Forecast 2024-2028

Published: Aug 2024 136 Pages SKU: IRTNTR72997

Market Overview at a Glance

$18.48 B
Market Opportunity
14.76%
CAGR
12.55
YoY growth 2023-2024(%)

Smart Gas Market Size 2024-2028

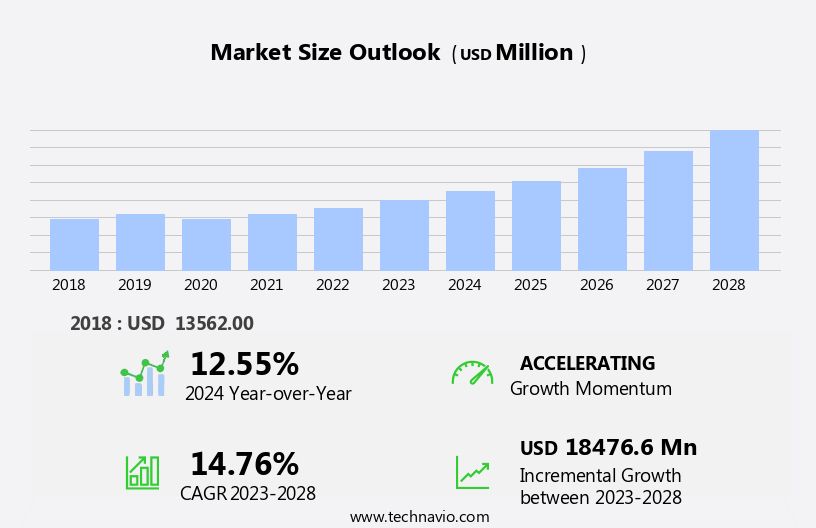
The smart gas market size is forecast to increase by USD 18.48 billion, at a CAGR of 14.76% between 2023 and 2028.

  • The market is driven by the increasing implementation of government regulations and initiatives aimed at promoting energy efficiency and reducing carbon emissions. The development of smart cities further accelerates market growth, as these urban areas prioritize the integration of advanced technologies to enhance infrastructure and improve energy management. However, the market faces significant challenges. Infrastructural and standardization issues persist, hindering the widespread adoption of smart gas solutions. Regulatory compliance and interoperability between various systems remain obstacles that require resolution for market expansion.
  • Companies seeking to capitalize on market opportunities must navigate these challenges by collaborating with industry partners, investing in research and development, and engaging with regulatory bodies to ensure compliance. By addressing these challenges, market participants can effectively contribute to the transition towards a more sustainable energy future.

What will be the Size of the Smart Gas Market during the forecast period?

Smart Gas Market Size

Explore in-depth regional segment analysis with market size data - historical 2018-2022 and forecasts 2024-2028 - in the full report.  
Request Free Sample

The market continues to evolve, driven by advancements in technology and the growing demand for efficient and safe energy solutions. Real-time monitoring and gas supply optimization are becoming standard practices, enabling consumers and utilities to effectively manage their energy consumption and ensure uninterrupted supply. For instance, a leading utility company reported a 15% reduction in gas leaks through the implementation of advanced leakage detection software and remote meter reading. Smart gas infrastructure, comprised of smart gas meters, pressure regulation systems, and data security protocols, is revolutionizing the industry. Gas distribution networks and customer billing systems are being upgraded with energy efficiency monitoring, advanced metering infrastructure, and data visualization tools.

These innovations not only enhance the accuracy and reliability of gas supply but also enable consumers to better understand their energy usage patterns. Gas safety standards are increasingly being integrated into smart gas systems, ensuring the safety and security of both consumers and the environment. Gas quality monitoring, sensor technology, and predictive maintenance are essential components of this integrated approach. Smart grids and energy audit technology are also being adopted to optimize network infrastructure and improve grid stability. According to industry reports, the market is expected to grow by over 10% annually in the coming years, driven by the increasing adoption of smart gas infrastructure and the need for more efficient and sustainable energy solutions.

The integration of wireless communication, gas consumption analytics, smart gas regulation, and remote diagnostics is further fueling this growth.

How is this Smart Gas Industry segmented?

The smart gas industry research report provides comprehensive data (region-wise segment analysis), with forecasts and estimates in "USD million" for the period 2024-2028, as well as historical data from 2018-2022 for the following segments.

  • Device
    • Automatic meter reading (AMR)
    • Advanced meter infrastructure (AMI)
  • Geography
    • North America
      • US
    • Europe
      • Germany
      • UK
    • APAC
      • China
      • Japan
    • Rest of World (ROW)

By Device Insights

The automatic meter reading (AMR) segment is estimated to witness significant growth during the forecast period.

In the evolving market, Automated Meter Reading (AMR) systems play a pivotal role in optimizing gas supply and enhancing customer experience. These systems facilitate real-time monitoring of gas consumption and diagnostics, enabling gas utilities to promptly address any issues and ensure accurate billing. With advanced metering infrastructure, gas companies can analyze consumption patterns, identify energy inefficiencies, and optimize network infrastructure for improved grid stability. AMR systems incorporate data security protocols and sensor technology to ensure gas safety standards. Smart gas infrastructure, including pressure regulation systems and gas quality monitoring, further enhances safety and reliability. The integration of AMR with smart grids allows for predictive maintenance, network optimization, and gas flow measurement, resulting in a more efficient and responsive gas distribution network.

According to recent industry reports, the market is expected to grow by over 15% in the next five years, driven by the increasing adoption of advanced metering infrastructure and data visualization tools. For instance, a leading gas utility in the US reported a 20% reduction in customer calls regarding billing disputes after implementing an AMR system. This not only improved customer satisfaction but also streamlined operational processes for the utility. In summary, the market is witnessing significant growth as gas companies invest in smart infrastructure, data management, and advanced technologies to optimize gas supply, enhance safety, and provide valuable insights to their customers.

Smart Gas Market Size

Request Free Sample

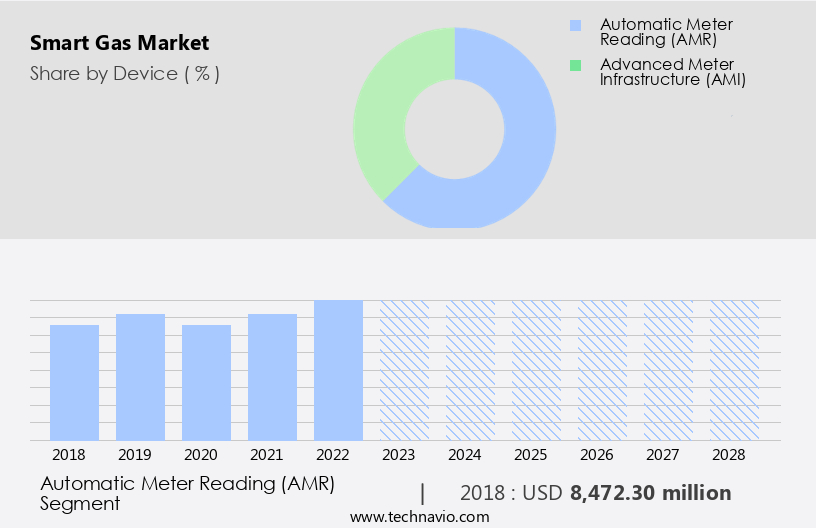
The Automatic meter reading (AMR) segment was valued at USD 8.47 billion in 2018 and showed a gradual increase during the forecast period.

Regional Analysis

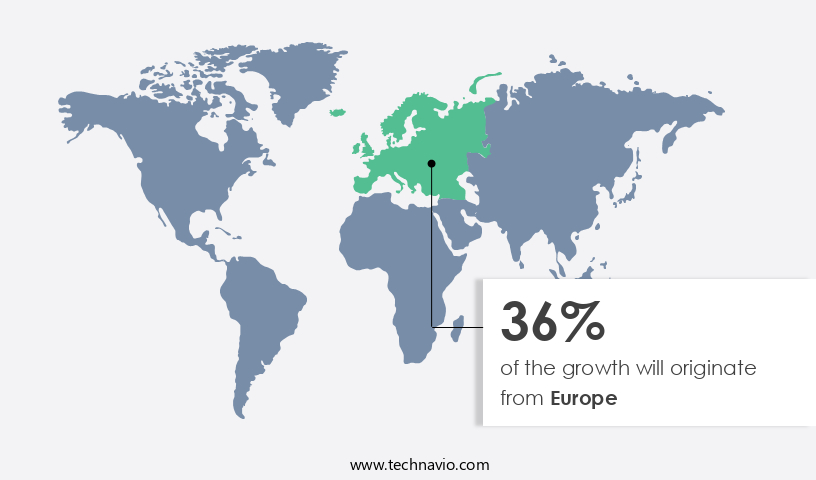
Europe is estimated to contribute 36% to the growth of the global market during the forecast period. Technavio's analysts have elaborately explained the regional trends and drivers that shape the market during the forecast period.

Smart Gas Market Share by Geography

 Request Free Sample

In the dynamic US energy landscape, the market is experiencing significant growth. Real-time monitoring and optimization of gas supply and consumption patterns are essential for maintaining efficiency and safety. Gas safety standards are stringently enforced, ensuring the reliability and integrity of smart gas infrastructure. Advanced metering infrastructure, including smart gas meters, pressure regulation systems, and data security protocols, enable accurate and secure billing for customers. The integration of sensor technology and data visualization tools facilitates gas quality monitoring and network optimization. Predictive maintenance and network infrastructure improvements ensure grid stability and reduce leakages. In 2023, the US accounted for approximately 45% of global natural gas production, leading to a substantial decrease in prices.

This price drop has encouraged power utilities and end-users to transition to natural gas as a primary energy source, driving the market's expansion by over 10%. Energy audit technology, automated meter reading, wireless communication, and remote diagnostics further enhance the efficiency and reliability of the smart gas system.

Market Dynamics

Our researchers analyzed the data with 2023 as the base year, along with the key drivers, trends, and challenges. A holistic analysis of drivers will help companies refine their marketing strategies to gain a competitive advantage.

What are the key market drivers leading to the rise in the adoption of Smart Gas Industry?

  • Government regulations and initiatives serve as the primary catalyst for market growth and development. 
  • The market is witnessing significant growth due to increasing government initiatives to promote energy conservation and reduce gas waste in various end-use sectors. With the depleting fossil fuel energy sources, countries are emphasizing the adoption of energy-saving systems. In Europe, for instance, Section 17 of the Gas Act of 1986 and subsequent Statutory Instruments have mandated the usage of gas meters to ensure efficient energy consumption. Over the last decade, this regulatory push has led to a substantial increase in the adoption of smart gas technologies.
  • According to industry reports, the market is expected to grow by over 15% by 2026. For instance, a leading energy company reported a sales increase of 25% in its smart gas segment in the last fiscal year. These figures underscore the potential of the market in driving energy efficiency and sustainability.

What are the market trends shaping the Smart Gas Industry?

  • Smart city development is an emerging market trend that continues to gain momentum. This trend encompasses the use of technology and data to enhance urban living and improve infrastructure efficiency.
  • Smart cities, which leverage digital technology to optimize the use of resources and enhance productivity, are gaining momentum worldwide. These cities utilize digital communication and technology to improve energy, water, infrastructure, governance, transportation, healthcare, and waste management. According to recent studies, the global smart city market is projected to grow by 22% by 2025, as cities address population growth, climate change, and economic stresses. Smart city initiatives incorporate tools such as smartphones, IoT, and cloud-based services to tackle these challenges efficiently.
  • The integration of these technologies is expected to bring significant improvements in urban living, making cities more sustainable and livable.

What challenges does the Smart Gas Industry face during its growth?

  • The infrastructure and standardization issues represent significant challenges that hinder industry growth. These hurdles necessitate substantial investment and coordinated efforts to implement advanced technologies and establish consistent protocols. 
  • The market necessitates intricate information technology (IT) infrastructure to facilitate its implementation. Essential IT components include databases, middleware, business applications, and customer relationship management systems. Middleware is crucial for monitoring and ensuring security and regulatory compliance. Asset management applications support new equipment and maintenance schedules, while mobile workforce management applications enable efficient meter installation. These IT infrastructure requirements pose challenges for gas suppliers due to their complexity. For instance, a leading European gas supplier reported a 25% increase in IT infrastructure costs during their smart gas implementation.
  • Moreover, the market is projected to grow by over 15% in the next five years, indicating significant industry expansion. This growth is driven by increasing consumer demand for real-time energy usage insights and the need for more efficient and cost-effective energy solutions.

Exclusive Customer Landscape

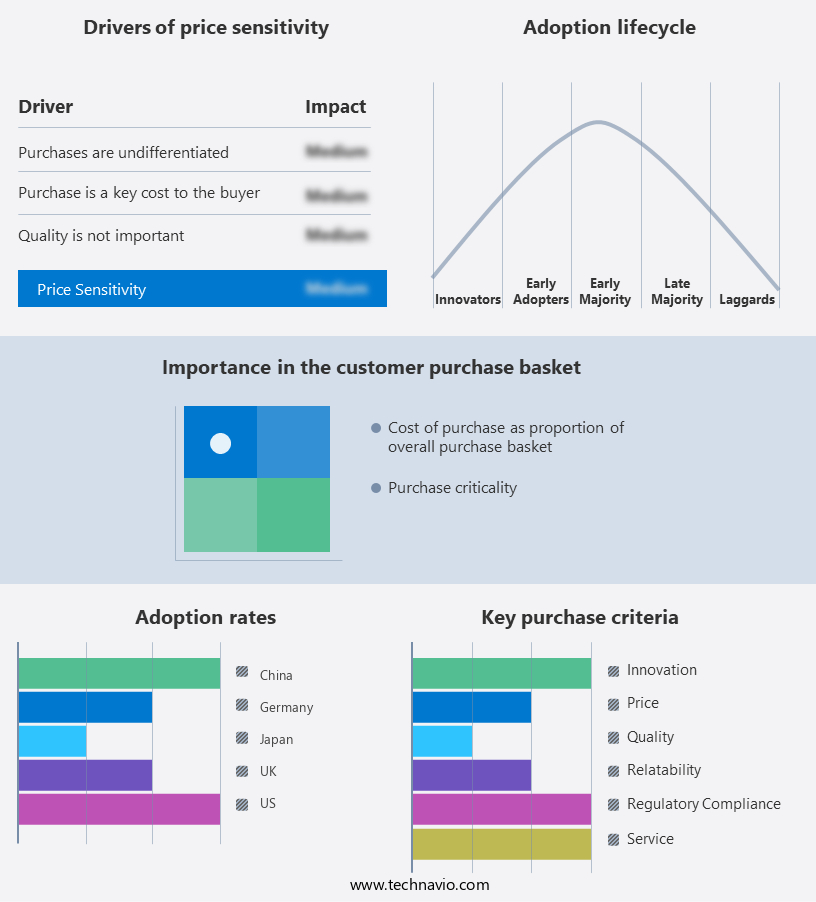
The smart gas market forecasting report includes the adoption lifecycle of the market, covering from the innovator's stage to the laggard's stage. It focuses on adoption rates in different regions based on penetration. Furthermore, the smart gas market report also includes key purchase criteria and drivers of price sensitivity to help companies evaluate and develop their market growth analysis strategies.

Smart Gas Market Share by Geography

 Customer Landscape

Key Companies & Market Insights

Companies are implementing various strategies, such as strategic alliances, smart gas market forecast, partnerships, mergers and acquisitions, geographical expansion, and product/service launches, to enhance their presence in the industry.

AEM SA - A leading player in the upstream oil and gas sector provides a comprehensive range of smart gas metering solutions. 

The industry research and growth report includes detailed analyses of the competitive landscape of the market and information about key companies, including:

  • AEM SA
  • Aichi Tokei Denki Co. Ltd.
  • Apator SA
  • Badger Meter Inc.
  • CGI Inc.
  • Chongqing Shancheng Gas Equipment Co. Ltd.
  • CyanConnode Holdings plc
  • Diehl Stiftung and Co. KG
  • DTE Energy.
  • EDMI Ltd.
  • Flonidan AS
  • Holley Technology Ltd.
  • Honeywell International Inc.
  • Hubbell Inc.
  • KROHNE Messtechnik GmbH
  • Landis Gyr AG
  • Neptune Technology Group Inc.
  • Osaki Electric Co. Ltd.
  • Pietro Fiorentini Spa
  • PowerCom Ltd.
  • RMG Messtechnik GmbH
  • Sagemcom
  • Wasion Holdings Ltd.
  • Xylem Inc.
  • Yazaki Corp.
  • ZENNER INTERNATIONAL GMBH and CO.KG

Qualitative and quantitative analysis of companies has been conducted to help clients understand the wider business environment as well as the strengths and weaknesses of key industry players. Data is qualitatively analyzed to categorize companies as pure play, category-focused, industry-focused, and diversified; it is quantitatively analyzed to categorize companies as dominant, leading, strong, tentative, and weak.

Recent Development and News in Smart Gas Market

  • In January 2024, Siemens Energy and Shell announced a strategic collaboration to develop and deploy hydrogen and carbon capture, utilization, and storage (CCUS) technologies for the natural gas industry (Shell press release, 2024). This partnership aimed to reduce carbon emissions from natural gas power plants and industrial processes by integrating hydrogen production and CCUS solutions.
  • In March 2024, Air Liquide, a leading global industrial gases company, launched its new Smart Mobility business unit, focusing on hydrogen mobility solutions (Air Liquide press release, 2024). This strategic move reflected the growing demand for hydrogen fuel cell vehicles and the company's commitment to the market.
  • In May 2024, Engie, a French energy and services company, completed the acquisition of a 40% stake in the European hydrogen production company, HyGear (Engie press release, 2024). This investment expanded Engie's presence in the hydrogen market and strengthened its position as a key player in the smart gas sector.
  • In April 2025, the European Union approved the Hydrogen Strategy, aiming to deploy at least 6 gigawatts (GW) of renewable hydrogen production capacity by 2024 and 40 GW by 2030 (European Commission press release, 2025). This regulatory initiative marked a significant step forward in the development of the European market and the transition towards a hydrogen economy.

Research Analyst Overview

  • The market for smart gas solutions continues to evolve, driven by the increasing demand for gas supply reliability and efficient distribution. Gas demand forecasting and flow optimization are key focus areas, with advanced pipeline corrosion detection systems and infrastructure modernization playing crucial roles in enhancing network capacity and ensuring network security. Gas utility management systems, incorporating smart metering solutions and data analytics platforms, enable real-time gas distribution efficiency and theft prevention. Network capacity planning and pipeline maintenance are essential for maintaining system integrity, while network security protocols and fault detection systems safeguard against potential threats.
  • With industry growth expectations reaching 15% annually, the adoption of data transmission protocols, gas safety regulations, and remote control operation is on the rise. Gas leak prevention, meter data acquisition, and validation are integral components of smart meter deployment, while remote meter upgrade and network connectivity facilitate energy consumption trends analysis.

Dive into Technavio's robust research methodology, blending expert interviews, extensive data synthesis, and validated models for unparalleled Smart Gas Market insights. See full methodology.

Market Scope

Report Coverage

Details

Page number

136

Base year

2023

Historic period

2018-2022

Forecast period

2024-2028

Growth momentum & CAGR

Accelerate at a CAGR of 14.76%

Market growth 2024-2028

USD 18476.6 million

Market structure

Fragmented

YoY growth 2023-2024(%)

12.55

Key countries

US, Germany, UK, Japan, and China

Competitive landscape

Leading Companies, Market Positioning of Companies, Competitive Strategies, and Industry Risks

Request Free Sample

What are the Key Data Covered in this Smart Gas Market Research and Growth Report?

  • CAGR of the Smart Gas industry during the forecast period
  • Detailed information on factors that will drive the growth and forecasting between 2024 and 2028
  • Precise estimation of the size of the market and its contribution of the industry in focus to the parent market
  • Accurate predictions about upcoming growth and trends and changes in consumer behaviour
  • Growth of the market across North America, Europe, APAC, Middle East and Africa, and South America
  • Thorough analysis of the market's competitive landscape and detailed information about companies
  • Comprehensive analysis of factors that will challenge the smart gas market growth of industry companies

We can help! Our analysts can customize this smart gas market research report to meet your requirements.

Get in touch

1 Executive Summary

  • 1.1 Market overview
    • Executive Summary - Chart on Market Overview
    • Executive Summary - Data Table on Market Overview
    • Executive Summary - Chart on Global Market Characteristics
    • Executive Summary - Chart on Market by Geography
    • Executive Summary - Chart on Market Segmentation by Device
    • Executive Summary - Chart on Incremental Growth
    • Executive Summary - Data Table on Incremental Growth
    • Executive Summary - Chart on Company Market Positioning

2 Market Landscape

  • 2.1 Market ecosystem
    • Parent Market
    • Data Table on - Parent Market
  • 2.2 Market characteristics
    • Market characteristics analysis
  • 2.3 Value chain analysis
    • Value Chain Analysis

3 Market Sizing

  • 3.1 Market definition
    • Offerings of companies included in the market definition
  • 3.2 Market segment analysis
    • Market segments
  • 3.3 Market size 2023
    • 3.4 Market outlook: Forecast for 2023-2028
      • Chart on Global - Market size and forecast 2023-2028 ($ million)
      • Data Table on Global - Market size and forecast 2023-2028 ($ million)
      • Chart on Global Market: Year-over-year growth 2023-2028 (%)
      • Data Table on Global Market: Year-over-year growth 2023-2028 (%)

    4 Historic Market Size

    • 4.1 Global Smart Gas Market 2018 - 2022
      • Historic Market Size - Data Table on Global Smart Gas Market 2018 - 2022 ($ million)
    • 4.2 Device segment analysis 2018 - 2022
      • Historic Market Size - Device Segment 2018 - 2022 ($ million)
    • 4.3 Geography segment analysis 2018 - 2022
      • Historic Market Size - Geography Segment 2018 - 2022 ($ million)
    • 4.4 Country segment analysis 2018 - 2022
      • Historic Market Size - Country Segment 2018 - 2022 ($ million)

    5 Five Forces Analysis

    • 5.1 Five forces summary
      • Five forces analysis - Comparison between 2023 and 2028
    • 5.2 Bargaining power of buyers
      • Bargaining power of buyers - Impact of key factors 2023 and 2028
    • 5.3 Bargaining power of suppliers
      • Bargaining power of suppliers - Impact of key factors in 2023 and 2028
    • 5.4 Threat of new entrants
      • Threat of new entrants - Impact of key factors in 2023 and 2028
    • 5.5 Threat of substitutes
      • Threat of substitutes - Impact of key factors in 2023 and 2028
    • 5.6 Threat of rivalry
      • Threat of rivalry - Impact of key factors in 2023 and 2028
    • 5.7 Market condition
      • Chart on Market condition - Five forces 2023 and 2028

    6 Market Segmentation by Device

    • 6.1 Market segments
      • Chart on Device - Market share 2023-2028 (%)
      • Data Table on Device - Market share 2023-2028 (%)
    • 6.2 Comparison by Device
      • Chart on Comparison by Device
      • Data Table on Comparison by Device
    • 6.3 Automatic meter reading (AMR) - Market size and forecast 2023-2028
      • Chart on Automatic meter reading (AMR) - Market size and forecast 2023-2028 ($ million)
      • Data Table on Automatic meter reading (AMR) - Market size and forecast 2023-2028 ($ million)
      • Chart on Automatic meter reading (AMR) - Year-over-year growth 2023-2028 (%)
      • Data Table on Automatic meter reading (AMR) - Year-over-year growth 2023-2028 (%)
    • 6.4 Advanced meter infrastructure (AMI) - Market size and forecast 2023-2028
      • Chart on Advanced meter infrastructure (AMI) - Market size and forecast 2023-2028 ($ million)
      • Data Table on Advanced meter infrastructure (AMI) - Market size and forecast 2023-2028 ($ million)
      • Chart on Advanced meter infrastructure (AMI) - Year-over-year growth 2023-2028 (%)
      • Data Table on Advanced meter infrastructure (AMI) - Year-over-year growth 2023-2028 (%)
    • 6.5 Market opportunity by Device
      • Market opportunity by Device ($ million)
      • Data Table on Market opportunity by Device ($ million)

    7 Customer Landscape

    • 7.1 Customer landscape overview
      • Analysis of price sensitivity, lifecycle, customer purchase basket, adoption rates, and purchase criteria

    8 Geographic Landscape

    • 8.1 Geographic segmentation
      • Chart on Market share by geography 2023-2028 (%)
      • Data Table on Market share by geography 2023-2028 (%)
    • 8.2 Geographic comparison
      • Chart on Geographic comparison
      • Data Table on Geographic comparison
    • 8.3 North America - Market size and forecast 2023-2028
      • Chart on North America - Market size and forecast 2023-2028 ($ million)
      • Data Table on North America - Market size and forecast 2023-2028 ($ million)
      • Chart on North America - Year-over-year growth 2023-2028 (%)
      • Data Table on North America - Year-over-year growth 2023-2028 (%)
    • 8.4 Europe - Market size and forecast 2023-2028
      • Chart on Europe - Market size and forecast 2023-2028 ($ million)
      • Data Table on Europe - Market size and forecast 2023-2028 ($ million)
      • Chart on Europe - Year-over-year growth 2023-2028 (%)
      • Data Table on Europe - Year-over-year growth 2023-2028 (%)
    • 8.5 APAC - Market size and forecast 2023-2028
      • Chart on APAC - Market size and forecast 2023-2028 ($ million)
      • Data Table on APAC - Market size and forecast 2023-2028 ($ million)
      • Chart on APAC - Year-over-year growth 2023-2028 (%)
      • Data Table on APAC - Year-over-year growth 2023-2028 (%)
    • 8.6 Middle East and Africa - Market size and forecast 2023-2028
      • Chart on Middle East and Africa - Market size and forecast 2023-2028 ($ million)
      • Data Table on Middle East and Africa - Market size and forecast 2023-2028 ($ million)
      • Chart on Middle East and Africa - Year-over-year growth 2023-2028 (%)
      • Data Table on Middle East and Africa - Year-over-year growth 2023-2028 (%)
    • 8.7 South America - Market size and forecast 2023-2028
      • Chart on South America - Market size and forecast 2023-2028 ($ million)
      • Data Table on South America - Market size and forecast 2023-2028 ($ million)
      • Chart on South America - Year-over-year growth 2023-2028 (%)
      • Data Table on South America - Year-over-year growth 2023-2028 (%)
    • 8.8 US - Market size and forecast 2023-2028
      • Chart on US - Market size and forecast 2023-2028 ($ million)
      • Data Table on US - Market size and forecast 2023-2028 ($ million)
      • Chart on US - Year-over-year growth 2023-2028 (%)
      • Data Table on US - Year-over-year growth 2023-2028 (%)
    • 8.9 Germany - Market size and forecast 2023-2028
      • Chart on Germany - Market size and forecast 2023-2028 ($ million)
      • Data Table on Germany - Market size and forecast 2023-2028 ($ million)
      • Chart on Germany - Year-over-year growth 2023-2028 (%)
      • Data Table on Germany - Year-over-year growth 2023-2028 (%)
    • 8.10 UK - Market size and forecast 2023-2028
      • Chart on UK - Market size and forecast 2023-2028 ($ million)
      • Data Table on UK - Market size and forecast 2023-2028 ($ million)
      • Chart on UK - Year-over-year growth 2023-2028 (%)
      • Data Table on UK - Year-over-year growth 2023-2028 (%)
    • 8.11 Japan - Market size and forecast 2023-2028
      • Chart on Japan - Market size and forecast 2023-2028 ($ million)
      • Data Table on Japan - Market size and forecast 2023-2028 ($ million)
      • Chart on Japan - Year-over-year growth 2023-2028 (%)
      • Data Table on Japan - Year-over-year growth 2023-2028 (%)
    • 8.12 China - Market size and forecast 2023-2028
      • Chart on China - Market size and forecast 2023-2028 ($ million)
      • Data Table on China - Market size and forecast 2023-2028 ($ million)
      • Chart on China - Year-over-year growth 2023-2028 (%)
      • Data Table on China - Year-over-year growth 2023-2028 (%)
    • 8.13 Market opportunity by geography
      • Market opportunity by geography ($ million)
      • Data Tables on Market opportunity by geography ($ million)

    9 Drivers, Challenges, and Opportunity/Restraints

    • 9.1 Market drivers
      • 9.2 Market challenges
        • 9.3 Impact of drivers and challenges
          • Impact of drivers and challenges in 2023 and 2028
        • 9.4 Market opportunities/restraints

          10 Competitive Landscape

          • 10.1 Overview
            • 10.2 Competitive Landscape
              • Overview on criticality of inputs and factors of differentiation
            • 10.3 Landscape disruption
              • Overview on factors of disruption
            • 10.4 Industry risks
              • Impact of key risks on business

            11 Competitive Analysis

            • 11.1 Companies profiled
              • Companies covered
            • 11.2 Market positioning of companies
              • Matrix on companies position and classification
            • 11.3 Badger Meter Inc.
              • Badger Meter Inc. - Overview
              • Badger Meter Inc. - Product / Service
              • Badger Meter Inc. - Key news
              • Badger Meter Inc. - Key offerings
            • 11.4 CGI Inc.
              • CGI Inc. - Overview
              • CGI Inc. - Business segments
              • CGI Inc. - Key news
              • CGI Inc. - Key offerings
              • CGI Inc. - Segment focus
            • 11.5 Chongqing Shancheng Gas Equipment Co. Ltd.
              • Chongqing Shancheng Gas Equipment Co. Ltd. - Overview
              • Chongqing Shancheng Gas Equipment Co. Ltd. - Product / Service
              • Chongqing Shancheng Gas Equipment Co. Ltd. - Key offerings
            • 11.6 CyanConnode Holdings plc
              • CyanConnode Holdings plc - Overview
              • CyanConnode Holdings plc - Product / Service
              • CyanConnode Holdings plc - Key offerings
            • 11.7 DTE Energy.
              • DTE Energy. - Overview
              • DTE Energy. - Business segments
              • DTE Energy. - Key offerings
              • DTE Energy. - Segment focus
            • 11.8 EDMI Ltd.
              • EDMI Ltd. - Overview
              • EDMI Ltd. - Product / Service
              • EDMI Ltd. - Key offerings
            • 11.9 Holley Technology Ltd.
              • Holley Technology Ltd. - Overview
              • Holley Technology Ltd. - Product / Service
              • Holley Technology Ltd. - Key news
              • Holley Technology Ltd. - Key offerings
            • 11.10 Honeywell International Inc.
              • Honeywell International Inc. - Overview
              • Honeywell International Inc. - Business segments
              • Honeywell International Inc. - Key news
              • Honeywell International Inc. - Key offerings
              • Honeywell International Inc. - Segment focus
            • 11.11 Hubbell Inc.
              • Hubbell Inc. - Overview
              • Hubbell Inc. - Business segments
              • Hubbell Inc. - Key news
              • Hubbell Inc. - Key offerings
              • Hubbell Inc. - Segment focus
            • 11.12 Wasion Holdings Ltd.
              • Wasion Holdings Ltd. - Overview
              • Wasion Holdings Ltd. - Product / Service
              • Wasion Holdings Ltd. - Key offerings

            12 Appendix

            • 12.1 Scope of the report
              • 12.2 Inclusions and exclusions checklist
                • Inclusions checklist
                • Exclusions checklist
              • 12.3 Currency conversion rates for US$
                • Currency conversion rates for US$
              • 12.4 Research methodology
                • Research methodology
              • 12.5 Data procurement
                • Information sources
              • 12.6 Data validation
                • Data validation
              • 12.7 Validation techniques employed for market sizing
                • Validation techniques employed for market sizing
              • 12.8 Data synthesis
                • Data synthesis
              • 12.9 360 degree market analysis
                • 360 degree market analysis
              • 12.10 List of abbreviations
                • List of abbreviations

              Research Methodology

              Technavio presents a detailed picture of the market by way of study, synthesis, and summation of data from multiple sources. The analysts have presented the various facets of the market with a particular focus on identifying the key industry influencers. The data thus presented is comprehensive, reliable, and the result of extensive research, both primary and secondary.

              INFORMATION SOURCES

              Primary sources

              • Manufacturers and suppliers
              • Channel partners
              • Industry experts
              • Strategic decision makers

              Secondary sources

              • Industry journals and periodicals
              • Government data
              • Financial reports of key industry players
              • Historical data
              • Press releases

              DATA ANALYSIS

              Data Synthesis

              • Collation of data
              • Estimation of key figures
              • Analysis of derived insights

              Data Validation

              • Triangulation with data models
              • Reference against proprietary databases
              • Corroboration with industry experts

              REPORT WRITING

              Qualitative

              • Market drivers
              • Market challenges
              • Market trends
              • Five forces analysis

              Quantitative

              • Market size and forecast
              • Market segmentation
              • Geographical insights
              • Competitive landscape

              Interested in this report?

              Get your sample now to see our research methodology and insights!

              Download Now

              Frequently Asked Questions

              Smart Gas market growth will increase by $ 18476.6 mn during 2024-2028 .

              The Smart Gas market is expected to grow at a CAGR of 14.76% during 2024-2028 .

              Smart Gas market is segmented by Device( Automatic meter reading (AMR), Advanced meter infrastructure (AMI))

              AEM SA, Aichi Tokei Denki Co. Ltd., Apator SA, Badger Meter Inc., CGI Inc., Chongqing Shancheng Gas Equipment Co. Ltd., CyanConnode Holdings plc, Diehl Stiftung and Co. KG, DTE Energy., EDMI Ltd., Flonidan AS, Holley Technology Ltd., Honeywell International Inc., Hubbell Inc., KROHNE Messtechnik GmbH, Landis Gyr AG, Neptune Technology Group Inc., Osaki Electric Co. Ltd., Pietro Fiorentini Spa, PowerCom Ltd., RMG Messtechnik GmbH, Sagemcom, Wasion Holdings Ltd., Xylem Inc., Yazaki Corp., ZENNER INTERNATIONAL GMBH and CO.KG are a few of the key vendors in the Smart Gas market.

              Europe will register the highest growth rate of 36% among the other regions. Therefore, the Smart Gas market in Europe is expected to garner significant business opportunities for the vendors during the forecast period.

              US, Germany, UK, Japan, China

              • Government regulations and initiativesVarious governments across the world are gradually implementing smart gas initiatives in a variety of end-use sectors. Due to the rising shortage of fossil fuel energy sources is the driving factor this market.
              • countries have been forced to develop energy conservation measures. Gas installations aid in the reduction of gas waste in a variety of end-user segments. As a result is the driving factor this market.
              • governments encourage and regulate the adoption of energy-saving systems. Over the last decade is the driving factor this market.
              • the EU has been encouraging end-users to adopt energy-saving processes. Section 17 of the Gas Act of 1986 and accompanying laws in the form of Statutory Instruments govern the usage of gas meters in European countries. Governments of other major countries is the driving factor this market.
              • particularly those in developing economies is the driving factor this market.
              • are also anticipating to step in and pass legislation promoting energy efficiency by end of 2026. As a result of the implementation of regulatory regulations requiring the use of smart gas is the driving factor this market.
              • the market is expected to grow significantly during the projected period. is the driving factor this market.

              The Smart Gas market vendors should focus on grabbing business opportunities from the Automatic meter reading (AMR) segment as it accounted for the largest market share in the base year.