Smart Thermostats Market Analysis North America, Europe, APAC, Middle East and Africa, South America - US, Canada, Germany, China, Mexico - Size and Forecast 2024-2028

Smart Thermostats Market Analysis North America, Europe, APAC, Middle East and Africa, South America - US, Canada, Germany, China, Mexico - Size and Forecast 2024-2028

Published: Jun 2024 154 Pages SKU: IRTNTR72480

Market Overview at a Glance

$5.51 B
Market Opportunity
24.07%
CAGR
19.08
YoY growth 2023-2024(%)

Smart Thermostats Market Size 2024-2028 

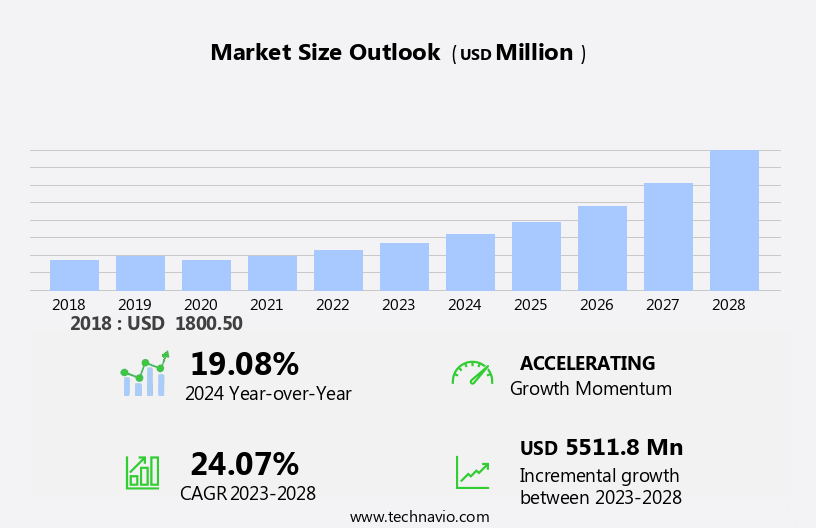
The smart thermostats market size is forecast to increase by USD 5.51 billion at a CAGR of 24.07% between 2023 and 2028.

  • The market is experiencing significant growth due to the increasing number of HVAC equipment users and the rising focus on integrated building management systems. These advanced thermostats offer energy efficiency and convenience, making them an attractive option for homeowners and businesses. Geofencing technology is a notable trend, enabling thermostats to automatically adjust temperature settings based on the location of occupants. The residential segment, particularly in residential construction, is expected to dominate the market due to the growing focus on energy efficiency and integrated building management systems. However, the high initial investment cost remains a challenge for some consumers, potentially hindering market demand. The market trends and analysis report delves deeper into these growth factors and provides insights into the future outlook of the market.

What will be the Size of the Smart Thermostats Market During the Forecast Period?

Smart Thermostats Market Size

 Request Free Sample

  • The market is experiencing significant growth as part of the Internet of Things (IoT) revolution in HVAC systems. These advanced devices offer customer-centric services, enabling remote appliance control through smartphones and cloud-based platforms. Smart thermostats are integral components of the burgeoning smart home market, promoting energy efficiency and reducing electricity consumption. Utilizing motion sensors, temperature monitoring, and AI technologies, these devices optimize power usage and provide energy management solutions. Networking capabilities enable seamless integration with other smart gadgets and sciencesoft APIs, such as the Ecobee API with its HTTP-based interface. The market's expansion is driven by the potential for substantial energy savings and attractive return on investments, leading to increasing household and industrial adoption.

How is this Smart Thermostats Industry segmented and which is the largest segment?

The smart thermostats industry research report provides comprehensive data (region-wise segment analysis), with forecasts and estimates in "USD billion" for the period 2024-2028, as well as historical data from 2018-2022 for the following segments.
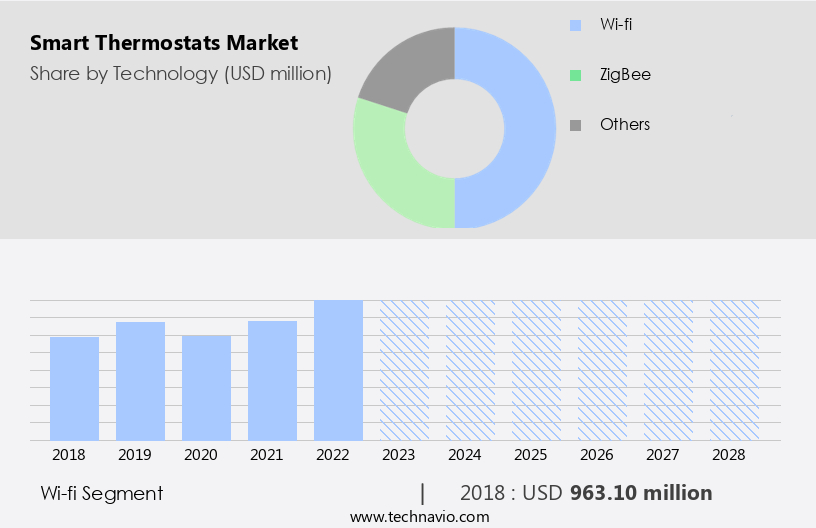
  • Technology
    • Wi-fi
    • ZigBee
    • Others
  • Geography
    • North America
      • Canada
      • Mexico
      • US
    • Europe
      • Germany
    • APAC
      • China
    • Middle East and Africa
    • South America

By Technology Insights

  • The Wi-Fi segment is estimated to witness significant growth during the forecast period.

The global market for smart thermostats is primarily driven by Wi-Fi connectivity, which enables remote appliance control, customer-centric services, and energy efficiency. Smart thermostats, including heaters, coolers, air conditioners, and traditional HVAC systems, offer energy savings through temperature monitoring, motion sensors, and learning user behavior and patterns. These devices, which cost up to USD250 on average, can be controlled via smartphones using APIs such as ecobee's API or an HTTP-based interface.

Moreover, the residential and commercial segments are the largest adopters of smart thermostats, with infrastructure upgrades and energy efficiency standards driving demand. Energy consumption is reduced through networking, AI technologies, and geofencing. Despite data security concerns, the benefits of energy savings and return on investment outweigh the costs. Wi-Fi and ZigBee technology dominate the market, with the Wi-Fi segment accounting for the largest share due to its high bandwidth and energy efficiency. The market is expected to continue growing, with industrial adoption also increasing.

Smart Thermostats Market Size

Get a glance at the  Smart Thermostats Industry report of share of various segments Request Free Sample

The Wi-fi segment was valued at USD 963.10 billion in 2018 and showed a gradual increase during the forecast period.

Regional Analysis

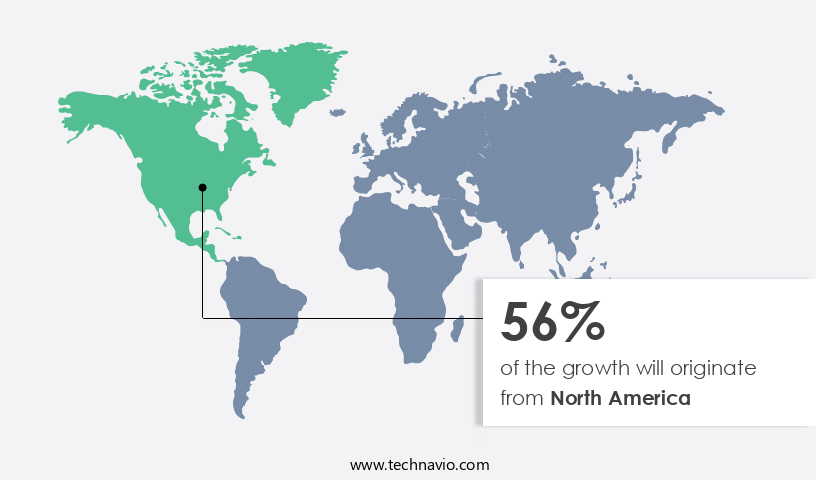
  • North America is estimated to contribute 56% to the growth of the global market during the forecast period.

Technavio's analysts have elaborately explained the regional trends and drivers that shape the market during the forecast period.

Smart Thermostats Market Share by Geography

For more insights on the market share of various regions, Request Free Sample

The North American market for smart thermostats is experiencing significant growth, driven by the expansion of residential and commercial construction sectors and increasing energy efficiency regulations. Governments In the region are promoting the adoption of smart thermostats to reduce energy consumption in buildings. For instance, under the Canada Greener Homes Grant initiative, the Canadian government offers up to USD 50 for retrofitting smart thermostats when combined with another eligible retrofit. Eligible equipment must be purchased from Canadian suppliers or distributors. This incentive aims to encourage homeowners and businesses to invest in energy-saving devices, such as smart thermostats, to manage heating, cooling, and other appliances remotely.

Moreover, these systems use IoT technology, AI, and sensors to optimize temperature settings based on user behavior, motion sensors, and power usage. Smart thermostats offer energy savings, return on investment, and convenience, making them popular among residential and commercial consumers. The market segments include wireless network, Wi-Fi, standalone, and connected thermostats. Smartphone usage and APIs, such as Ecobee API with an HTTP-based interface, facilitate energy management solutions. Despite data security concerns and the cost of devices, the market continues to grow due to increasing user adoption and energy savings.

Market Dynamics

Our smart thermostats market researchers analyzed the data with 2023 as the base year, along with the key drivers, trends, and challenges. A holistic analysis of drivers will help companies refine their marketing strategies to gain a competitive advantage.

What are the key market drivers leading to the rise In the adoption of Smart Thermostats Industry?

Growth in the number of HVAC equipment users is the key driver of the market.

  • The Internet of Things (IoT) has revolutionized various industries, including HVAC systems, with the integration of smart thermostats. These devices enable customer-centric services such as remote appliance control and energy efficiency. Smart thermostats are integral to HVAC systems, allowing users to monitor and adjust temperature settings from anywhere using a smartphone or cloud control. IoT sensors, including motion sensors and power usage monitors, enhance the functionality of these devices. AI technologies and networking capabilities, such as geofencing, further optimize energy consumption by automatically adjusting temperature settings based on user behavior and patterns. Energy savings and return on investments are key drivers for household and industrial adoption. The cost of devices continues to decrease, making them accessible to a wider audience. The HVAC market, which includes heating, cooling devices, and air conditioners, is expected to grow significantly due to increasing energy efficiency standards and infrastructure upgrades. Older people and energy conservation are also contributing factors. Wireless network technologies, such as Wi-Fi and ZigBee, are becoming increasingly popular for smart thermostats.
  • Moreover, the market can be segmented into wireless network segments, including Wi-Fi and standalone, as well as connected and commercial segments. Energy management solutions, such as API integrations with platforms like Ecobee and HTTP-based interfaces, offer additional benefits for users. Data security concerns remain an important consideration for manufacturers and users alike. In summary, the integration of smart thermostats into HVAC systems offers numerous benefits, including energy savings, user convenience, and cost savings. The growth of the HVAC market, driven by construction sector improvements and energy efficiency standards, is expected to continue the demand for these devices.

What are the market trends shaping the Smart Thermostats Industry?

Increasing focus on integrated building management systems is the upcoming market trend.

  • The market is witnessing significant growth due to the increasing demand for IoT-enabled customer-centric services and remote appliance control in both residential and commercial applications. HVAC systems, including heating, cooling devices, air conditioners, and coolers, account for approximately 60% of energy consumption in buildings. Integration of these systems, such as HVAC and lighting, under a unified platform using cloud control, motion sensors, and AI technologies, leads to energy savings and improved efficiency. Energy efficiency standards continue to evolve, necessitating infrastructure upgrades, and older people, in particular, benefit from the convenience and energy savings offered by smart thermostats. Energy management solutions, including temperature sensors, humidity sensors, and wireless connectivity via Wi-Fi and ZigBee technology, are driving household and industrial adoption.
  • Moreover, while the cost of devices remains a concern, the potential for energy savings and return on investments make smart thermostats an attractive option for energy conservation and power cost reduction. Data security concerns must be addressed to ensure user privacy and trust. The market can be segmented into wireless network, standalone, and connected segments, with the wireless network segment dominating due to its ease of installation and integration with other smart gadgets. The commercial segment is expected to grow at a rapid pace due to the increasing focus on energy efficiency and cost savings in large buildings. Power usage and user behavior patterns are essential factors influencing the market dynamics. HVAC systems with monitoring capabilities and wireless connectivity, such as Google Nest and its IR temperature sensors and humidity sensors, are popular choices for energy-conscious consumers.

What challenges does the Smart Thermostats Industry face during its growth?

High initial prices affect demand for smart thermostats is a key challenge affecting the industry growth.

  • The market is experiencing significant growth due to the increasing adoption of Internet of Things (IoT) technology and customer-centric services in both residential and commercial applications. These advanced HVAC systems offer remote appliance control through cloud-based platforms, enabling users to manage heating, cooling devices, and energy savings via smartphones. Smart thermostats utilize sensors, including temperature and humidity sensors, motion detectors, and power usage monitors, to optimize energy consumption and promote energy efficiency. AI technologies, such as geofencing and learning user behavior and patterns, further enhance the capabilities of these devices. Despite the numerous benefits, the high initial cost of smart thermostats and installation fees are deterrents for some consumers.
  • Moreover, while DIY installation is an option for some, the complexity of these systems often necessitates the hiring of skilled professionals. Traditional thermostats, which cost an average of USD 50, remain a more affordable alternative for those prioritizing energy conservation and power cost savings. However, the long-term energy savings and return on investments (ROI) offered by smart thermostats make them an attractive option for households and industries seeking to reduce electricity consumption. Networking technologies, including Wi-Fi and ZigBee, facilitate wireless connectivity, ensuring seamless integration with HVAC systems and other smart gadgets. Companies like Google Nest, Honeywell International, and ecobee Inc. Offer APIs, such as the Ecobee API with an HTTP-based interface, enabling developers to create custom energy management solutions. As data security concerns continue to be addressed, the household and industrial adoption of smart thermostats is expected to increase.

Exclusive Customer Landscape

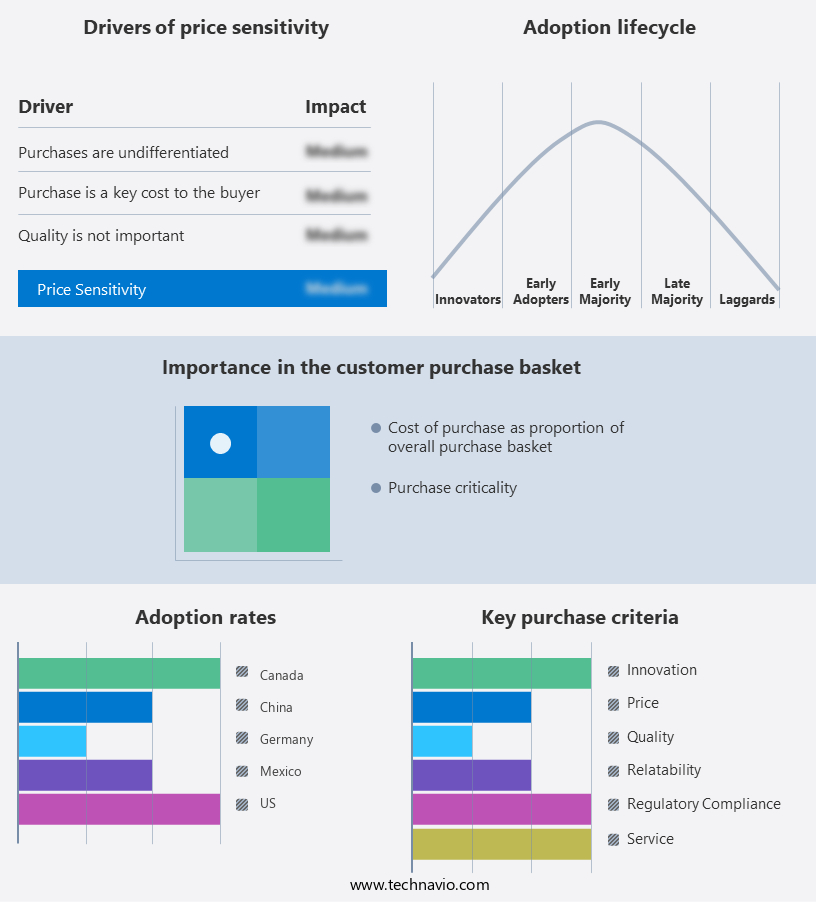
The smart thermostats market forecasting report includes the adoption lifecycle of the market, covering from the innovator's stage to the laggard's stage. It focuses on adoption rates in different regions based on penetration. Furthermore, the smart thermostats market report also includes key purchase criteria and drivers of price sensitivity to help companies evaluate and develop their market growth analysis strategies.

Smart Thermostats Market Share by Geography

 Customer Landscape

Key Companies & Market Insights

Companies are implementing various strategies, such as strategic alliances, smart thermostats market forecast, partnerships, mergers and acquisitions, geographical expansion, and product/service launches, to enhance their presence In the industry. The industry research and growth report includes detailed analyses of the competitive landscape of the market and information about key companies, including:

  • Alphabet Inc.
  • Carrier Global Corp.
  • Centrica Plc
  • Computime Group Ltd.
  • Control4 Corp.
  • ecobee
  • EcoFactor Inc.
  • Emerson Electric Co.
  • GridPoint Inc.
  • Honeywell International Inc.
  • Johnson Controls International Plc.
  • Legrand SA
  • NETATMO SAS
  • Nortek
  • Radio Thermostat Co. of America
  • Robert Bosch GmbH
  • Robertshaw Controls Co.
  • Schneider Electric SE
  • tado GmbH
  • Venstar Inc.

Qualitative and quantitative analysis of companies has been conducted to help clients understand the wider business environment as well as the strengths and weaknesses of key industry players. Data is qualitatively analyzed to categorize companies as pure play, category-focused, industry-focused, and diversified; it is quantitatively analyzed to categorize companies as dominant, leading, strong, tentative, and weak.

Research Analyst Overview

The market represents a significant growth opportunity In the realm of the Internet of Things (IoT) and customer-centric services. This market is driven by the increasing demand for remote appliance control and energy efficiency in both residential and commercial applications. Smart thermostats, a type of energysaving device, leverage advanced technologies such as cloud, motion sensors, and temperature sensors to optimize heating, cooling, and power usage. These devices offer enhanced capabilities, including temperature control through cloud-based interfaces, geofencing, and user behavior analysis. The integration of AI technologies and sciences in smart thermostats has led to improved energy management solutions. These solutions allow users to monitor their energy consumption, adjust temperature settings based on user patterns, and even learn from user behavior to optimize energy savings. The market for smart thermostats is segmented into several categories, including wireless network, wi-fi, standalone, and connected segments. The wi-fi segment is expected to dominate the market due to its ease of installation and widespread availability. The residential segment is a significant contributor to the growth of the market. With an increasing number of households adopting smart gadgets and energy conservation becoming a priority, the demand for energy management solutions is on the rise.

Additionally, the aging population and energy efficiency standards are driving the upgradation of traditional thermostats with smart alternatives. The commercial segment is also witnessing significant growth, as businesses seek to reduce their energy consumption and operating costs. Smart thermostats offer businesses the ability to monitor and control their HVAC systems remotely, optimizing energy usage and reducing power costs. Despite the numerous benefits, the adoption of smart thermostats is not without challenges. Data security concerns and the cost of devices are major barriers to entry for some consumers and businesses. However, the potential return on investment in terms of energy savings and improved comfort make these challenges worth addressing. In summary, the market is poised for significant growth In the coming years. With advancements in technology, increasing consumer awareness, and the growing demand for energy efficiency, this market is set to transform the way we manage our heating, cooling, and energy usage.

Smart Thermostats Market Scope

Report Coverage

Details

Page number

154

Base year

2023

Historic period

2018-2022

Forecast period

2024-2028

Growth momentum & CAGR

Accelerate at a CAGR of 24.07%

Market growth 2024-2028

USD 5.51 billion

Market structure

Fragmented

YoY growth 2023-2024(%)

19.08

Key countries

US, Canada, Germany, China, and Mexico

Competitive landscape

Leading Companies, Market Positioning of Companies, Competitive Strategies, and Industry Risks

Request Free Sample

What are the Key Data Covered in this Smart Thermostats Market Research and Growth Report?

  • CAGR of the Smart Thermostats industry during the forecast period
  • Detailed information on factors that will drive the Smart Thermostats growth and forecasting between 2024 and 2028
  • Precise estimation of the size of the market and its contribution of the industry in focus to the parent market
  • Accurate predictions about upcoming growth and trends and changes in consumer behaviour
  • Growth of the market across North America, Europe, APAC, Middle East and Africa, and South America
  • Thorough analysis of the market's competitive landscape and detailed information about companies
  • Comprehensive analysis of factors that will challenge the smart thermostats market growth of industry companies

We can help! Our analysts can customize this smart thermostats market research report to meet your requirements.

Get in touch

1 Executive Summary

  • 1.1 Market overview
    • Executive Summary - Chart on Market Overview
    • Executive Summary - Data Table on Market Overview
    • Executive Summary - Chart on Global Market Characteristics
    • Executive Summary - Chart on Market by Geography
    • Executive Summary - Chart on Market Segmentation by Technology
    • Executive Summary - Chart on Incremental Growth
    • Executive Summary - Data Table on Incremental Growth
    • Executive Summary - Chart on Company Market Positioning

2 Market Landscape

  • 2.1 Market ecosystem
    • Parent Market
    • Data Table on - Parent Market
  • 2.2 Market characteristics
    • Market characteristics analysis
  • 2.3 Value chain analysis
    • Value Chain Analysis

3 Market Sizing

  • 3.1 Market definition
    • Offerings of companies included in the market definition
  • 3.2 Market segment analysis
    • Market segments
  • 3.3 Market size 2023
    • 3.4 Market outlook: Forecast for 2023-2028
      • Chart on Global - Market size and forecast 2023-2028 ($ million)
      • Data Table on Global - Market size and forecast 2023-2028 ($ million)
      • Chart on Global Market: Year-over-year growth 2023-2028 (%)
      • Data Table on Global Market: Year-over-year growth 2023-2028 (%)

    4 Historic Market Size

    • 4.1 Global Smart Thermostats Market 2018 - 2022
      • Historic Market Size - Data Table on Global Smart Thermostats Market 2018 - 2022 ($ million)
    • 4.2 Technology segment analysis 2018 - 2022
      • Historic Market Size - Technology Segment 2018 - 2022 ($ million)
    • 4.3 Geography segment analysis 2018 - 2022
      • Historic Market Size - Geography Segment 2018 - 2022 ($ million)
    • 4.4 Country segment analysis 2018 - 2022
      • Historic Market Size - Country Segment 2018 - 2022 ($ million)

    5 Five Forces Analysis

    • 5.1 Five forces summary
      • Five forces analysis - Comparison between 2023 and 2028
    • 5.2 Bargaining power of buyers
      • Bargaining power of buyers - Impact of key factors 2023 and 2028
    • 5.3 Bargaining power of suppliers
      • Bargaining power of suppliers - Impact of key factors in 2023 and 2028
    • 5.4 Threat of new entrants
      • Threat of new entrants - Impact of key factors in 2023 and 2028
    • 5.5 Threat of substitutes
      • Threat of substitutes - Impact of key factors in 2023 and 2028
    • 5.6 Threat of rivalry
      • Threat of rivalry - Impact of key factors in 2023 and 2028
    • 5.7 Market condition
      • Chart on Market condition - Five forces 2023 and 2028

    6 Market Segmentation by Technology

    • 6.1 Market segments
      • Chart on Technology - Market share 2023-2028 (%)
      • Data Table on Technology - Market share 2023-2028 (%)
    • 6.2 Comparison by Technology
      • Chart on Comparison by Technology
      • Data Table on Comparison by Technology
    • 6.3 Wi-fi - Market size and forecast 2023-2028
      • Chart on Wi-fi - Market size and forecast 2023-2028 ($ million)
      • Data Table on Wi-fi - Market size and forecast 2023-2028 ($ million)
      • Chart on Wi-fi - Year-over-year growth 2023-2028 (%)
      • Data Table on Wi-fi - Year-over-year growth 2023-2028 (%)
    • 6.4 ZigBee - Market size and forecast 2023-2028
      • Chart on ZigBee - Market size and forecast 2023-2028 ($ million)
      • Data Table on ZigBee - Market size and forecast 2023-2028 ($ million)
      • Chart on ZigBee - Year-over-year growth 2023-2028 (%)
      • Data Table on ZigBee - Year-over-year growth 2023-2028 (%)
    • 6.5 Others - Market size and forecast 2023-2028
      • Chart on Others - Market size and forecast 2023-2028 ($ million)
      • Data Table on Others - Market size and forecast 2023-2028 ($ million)
      • Chart on Others - Year-over-year growth 2023-2028 (%)
      • Data Table on Others - Year-over-year growth 2023-2028 (%)
    • 6.6 Market opportunity by Technology
      • Market opportunity by Technology ($ million)
      • Data Table on Market opportunity by Technology ($ million)

    7 Customer Landscape

    • 7.1 Customer landscape overview
      • Analysis of price sensitivity, lifecycle, customer purchase basket, adoption rates, and purchase criteria

    8 Geographic Landscape

    • 8.1 Geographic segmentation
      • Chart on Market share by geography 2023-2028 (%)
      • Data Table on Market share by geography 2023-2028 (%)
    • 8.2 Geographic comparison
      • Chart on Geographic comparison
      • Data Table on Geographic comparison
    • 8.3 North America - Market size and forecast 2023-2028
      • Chart on North America - Market size and forecast 2023-2028 ($ million)
      • Data Table on North America - Market size and forecast 2023-2028 ($ million)
      • Chart on North America - Year-over-year growth 2023-2028 (%)
      • Data Table on North America - Year-over-year growth 2023-2028 (%)
    • 8.4 Europe - Market size and forecast 2023-2028
      • Chart on Europe - Market size and forecast 2023-2028 ($ million)
      • Data Table on Europe - Market size and forecast 2023-2028 ($ million)
      • Chart on Europe - Year-over-year growth 2023-2028 (%)
      • Data Table on Europe - Year-over-year growth 2023-2028 (%)
    • 8.5 APAC - Market size and forecast 2023-2028
      • Chart on APAC - Market size and forecast 2023-2028 ($ million)
      • Data Table on APAC - Market size and forecast 2023-2028 ($ million)
      • Chart on APAC - Year-over-year growth 2023-2028 (%)
      • Data Table on APAC - Year-over-year growth 2023-2028 (%)
    • 8.6 Middle East and Africa - Market size and forecast 2023-2028
      • Chart on Middle East and Africa - Market size and forecast 2023-2028 ($ million)
      • Data Table on Middle East and Africa - Market size and forecast 2023-2028 ($ million)
      • Chart on Middle East and Africa - Year-over-year growth 2023-2028 (%)
      • Data Table on Middle East and Africa - Year-over-year growth 2023-2028 (%)
    • 8.7 South America - Market size and forecast 2023-2028
      • Chart on South America - Market size and forecast 2023-2028 ($ million)
      • Data Table on South America - Market size and forecast 2023-2028 ($ million)
      • Chart on South America - Year-over-year growth 2023-2028 (%)
      • Data Table on South America - Year-over-year growth 2023-2028 (%)
    • 8.8 US - Market size and forecast 2023-2028
      • Chart on US - Market size and forecast 2023-2028 ($ million)
      • Data Table on US - Market size and forecast 2023-2028 ($ million)
      • Chart on US - Year-over-year growth 2023-2028 (%)
      • Data Table on US - Year-over-year growth 2023-2028 (%)
    • 8.9 Canada - Market size and forecast 2023-2028
      • Chart on Canada - Market size and forecast 2023-2028 ($ million)
      • Data Table on Canada - Market size and forecast 2023-2028 ($ million)
      • Chart on Canada - Year-over-year growth 2023-2028 (%)
      • Data Table on Canada - Year-over-year growth 2023-2028 (%)
    • 8.10 Germany - Market size and forecast 2023-2028
      • Chart on Germany - Market size and forecast 2023-2028 ($ million)
      • Data Table on Germany - Market size and forecast 2023-2028 ($ million)
      • Chart on Germany - Year-over-year growth 2023-2028 (%)
      • Data Table on Germany - Year-over-year growth 2023-2028 (%)
    • 8.11 China - Market size and forecast 2023-2028
      • Chart on China - Market size and forecast 2023-2028 ($ million)
      • Data Table on China - Market size and forecast 2023-2028 ($ million)
      • Chart on China - Year-over-year growth 2023-2028 (%)
      • Data Table on China - Year-over-year growth 2023-2028 (%)
    • 8.12 Mexico - Market size and forecast 2023-2028
      • Chart on Mexico - Market size and forecast 2023-2028 ($ million)
      • Data Table on Mexico - Market size and forecast 2023-2028 ($ million)
      • Chart on Mexico - Year-over-year growth 2023-2028 (%)
      • Data Table on Mexico - Year-over-year growth 2023-2028 (%)
    • 8.13 Market opportunity by geography
      • Market opportunity by geography ($ million)
      • Data Tables on Market opportunity by geography ($ million)

    9 Drivers, Challenges, and Opportunity/Restraints

    • 9.1 Market drivers
      • 9.2 Market challenges
        • 9.3 Impact of drivers and challenges
          • Impact of drivers and challenges in 2023 and 2028
        • 9.4 Market opportunities/restraints

          10 Competitive Landscape

          • 10.1 Overview
            • 10.2 Competitive Landscape
              • Overview on criticality of inputs and factors of differentiation
            • 10.3 Landscape disruption
              • Overview on factors of disruption
            • 10.4 Industry risks
              • Impact of key risks on business

            11 Competitive Analysis

            • 11.1 Companies profiled
              • Companies covered
            • 11.2 Market positioning of companies
              • Matrix on companies position and classification
            • 11.3 Alphabet Inc.
              • Alphabet Inc. - Overview
              • Alphabet Inc. - Business segments
              • Alphabet Inc. - Key offerings
              • Alphabet Inc. - Segment focus
            • 11.4 Centrica Plc
              • Centrica Plc - Overview
              • Centrica Plc - Business segments
              • Centrica Plc - Key offerings
              • Centrica Plc - Segment focus
            • 11.5 Computime Group Ltd.
              • Computime Group Ltd. - Overview
              • Computime Group Ltd. - Business segments
              • Computime Group Ltd. - Key news
              • Computime Group Ltd. - Key offerings
              • Computime Group Ltd. - Segment focus
            • 11.6 ecobee
              • ecobee - Overview
              • ecobee - Product / Service
              • ecobee - Key offerings
            • 11.7 EcoFactor Inc.
              • EcoFactor Inc. - Overview
              • EcoFactor Inc. - Product / Service
              • EcoFactor Inc. - Key offerings
            • 11.8 Emerson Electric Co.
              • Emerson Electric Co. - Overview
              • Emerson Electric Co. - Business segments
              • Emerson Electric Co. - Key news
              • Emerson Electric Co. - Key offerings
              • Emerson Electric Co. - Segment focus
            • 11.9 GridPoint Inc.
              • GridPoint Inc. - Overview
              • GridPoint Inc. - Product / Service
              • GridPoint Inc. - Key offerings
            • 11.10 Honeywell International Inc.
              • Honeywell International Inc. - Overview
              • Honeywell International Inc. - Business segments
              • Honeywell International Inc. - Key news
              • Honeywell International Inc. - Key offerings
              • Honeywell International Inc. - Segment focus
            • 11.11 Johnson Controls International Plc.
              • Johnson Controls International Plc. - Overview
              • Johnson Controls International Plc. - Business segments
              • Johnson Controls International Plc. - Key news
              • Johnson Controls International Plc. - Key offerings
              • Johnson Controls International Plc. - Segment focus
            • 11.12 Robert Bosch GmbH
              • Robert Bosch GmbH - Overview
              • Robert Bosch GmbH - Product / Service
              • Robert Bosch GmbH - Key news
              • Robert Bosch GmbH - Key offerings

            12 Appendix

            • 12.1 Scope of the report
              • 12.2 Inclusions and exclusions checklist
                • Inclusions checklist
                • Exclusions checklist
              • 12.3 Currency conversion rates for US$
                • Currency conversion rates for US$
              • 12.4 Research methodology
                • Research methodology
              • 12.5 Data procurement
                • Information sources
              • 12.6 Data validation
                • Data validation
              • 12.7 Validation techniques employed for market sizing
                • Validation techniques employed for market sizing
              • 12.8 Data synthesis
                • Data synthesis
              • 360 degree market analysis
                • 360 degree market analysis
              • 12.10 List of abbreviations
                • List of abbreviations

              Research Methodology

              Technavio presents a detailed picture of the market by way of study, synthesis, and summation of data from multiple sources. The analysts have presented the various facets of the market with a particular focus on identifying the key industry influencers. The data thus presented is comprehensive, reliable, and the result of extensive research, both primary and secondary.

              INFORMATION SOURCES

              Primary sources

              • Manufacturers and suppliers
              • Channel partners
              • Industry experts
              • Strategic decision makers

              Secondary sources

              • Industry journals and periodicals
              • Government data
              • Financial reports of key industry players
              • Historical data
              • Press releases

              DATA ANALYSIS

              Data Synthesis

              • Collation of data
              • Estimation of key figures
              • Analysis of derived insights

              Data Validation

              • Triangulation with data models
              • Reference against proprietary databases
              • Corroboration with industry experts

              REPORT WRITING

              Qualitative

              • Market drivers
              • Market challenges
              • Market trends
              • Five forces analysis

              Quantitative

              • Market size and forecast
              • Market segmentation
              • Geographical insights
              • Competitive landscape

              Interested in this report?

              Get your sample now to see our research methodology and insights!

              Download Now

              Frequently Asked Questions

              Smart Thermostats market growth will increase by $ 5511.8 mn during 2024-2028.

              The Smart Thermostats market is expected to grow at a CAGR of 24.07% during 2024-2028.

              Smart Thermostats market is segmented by Technology( Wi-fi, ZigBee, Others)

              Alphabet Inc., Carrier Global Corp., Centrica Plc, Computime Group Ltd., Control4 Corp., ecobee, EcoFactor Inc., Emerson Electric Co., GridPoint Inc., Honeywell International Inc., Johnson Controls International Plc., Legrand SA, NETATMO SAS, Nortek, Radio Thermostat Co. of America, Robert Bosch GmbH, Robertshaw Controls Co., Schneider Electric SE, tado GmbH, Venstar Inc. are a few of the key vendors in the Smart Thermostats market.

              North America will register the highest growth rate of 56% among the other regions. Therefore, the Smart Thermostats market in North America is expected to garner significant business opportunities for the vendors during the forecast period.

              US, Canada, Germany, China, Mexico

              • Growth in number of HVAC equipment usersHVAC systems are being increasingly adopted globally for their energy efficiency. With the help of heating and air conditioning equipment is the driving factor this market.
              • the temperature can be maintained within a household. Smart thermostats as a part of the HVAC system helps in monitoring and controlling the temperature from remote locations is the driving factor this market.
              • and it turns on the other HVAC system parts to achieve the desired temperature. Therefore is the driving factor this market.
              • the growth in the construction of residential and commercial buildings is expected to drive the demand for HVAC equipment is the driving factor this market.
              • thereby spurring the demand for smart thermostats during the forecast period.Europe and the US have witnessed significant improvements in their respective construction sectors since 2016. For instance is the driving factor this market.
              • Europe's average industrial production output increased by 1% in 2023 compared with 2021. The increase in construction output in EU-28 was mainly attributed to the rise in civil engineering and building construction activities in 2023. Moreover is the driving factor this market.
              • the construction industry grew by around 13.3% in the 3rd- quarter of 2023 compared to the 3rd- quarter of 2022. Similarly is the driving factor this market.
              • the US is witnessing steady growth in the construction industry. Consumers have become highly conscious of energy costs and the conservation of energy. Hence is the driving factor this market.
              • they prefer investing in technology that aids in reducing costs. Such factors are expected to increase the demand for smart thermostats is the driving factor this market.
              • which is the driving factor this market.
              • in turn is the driving factor this market.
              • will drive the growth of the market during the forecast period. is the driving factor this market.

              The Smart Thermostats market vendors should focus on grabbing business opportunities from the Wi-fi segment as it accounted for the largest market share in the base year.