Sodium Citrate Market Analysis, Size, and Forecast 2026-2030: North America (US, Canada, and Mexico), Europe (Germany, France, and UK), APAC (China, India, and Japan), South America (Brazil, Argentina, and Chile), Middle East and Africa (Saudi Arabia, UAE, and South Africa), and Rest of World (ROW)

Sodium Citrate Market Analysis, Size, and Forecast 2026-2030:
North America (US, Canada, and Mexico), Europe (Germany, France, and UK), APAC (China, India, and Japan), South America (Brazil, Argentina, and Chile), Middle East and Africa (Saudi Arabia, UAE, and South Africa), and Rest of World (ROW)

Published: Nov 2026 314 Pages SKU: IRTNTR81858

Market Overview at a Glance

$219.1 Mn
Market Opportunity
5.5%
CAGR 2025 - 2030
36.1%
North America Growth
$460.8 Mn
Food grade segment 2024

Sodium Citrate Market Size 2026-2030

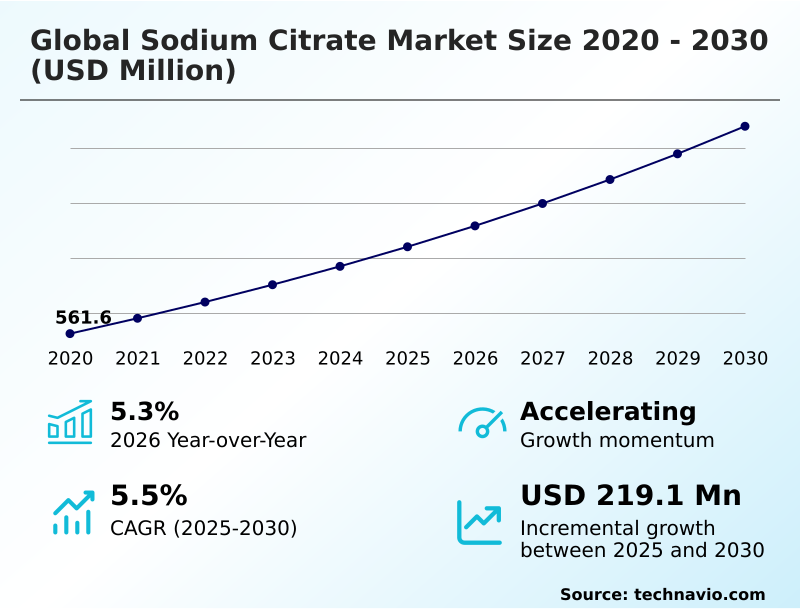
The sodium citrate market size is valued to increase by USD 219.1 million, at a CAGR of 5.5% from 2025 to 2030. Clean label reformulation accelerates food processing demand will drive the sodium citrate market.

Major Market Trends & Insights

  • North America dominated the market and accounted for a 36.1% growth during the forecast period.
  • By Grade Type - Food grade segment was valued at USD 460.8 million in 2024
  • By Form Factor - Powder segment accounted for the largest market revenue share in 2024

Market Size & Forecast

  • Market Opportunities: USD 377 million
  • Market Future Opportunities: USD 219.1 million
  • CAGR from 2025 to 2030 : 5.5%

Market Summary

  • The Sodium Citrate Market exhibits sustained structural expansion driven by its indispensable role as a multi-functional buffering agent and ecological chelator across diverse industrial sectors. In commercial food processing, corporate formulators are actively phasing out artificial preservatives, substituting them with high-purity organic derivatives to meet stringent clean-label requirements.
  • This shift improves product shelf stability, demonstrating a 20% increase in microbial resistance compared to legacy additives. The market is primarily propelled by escalating clinical demands, where the integration of precision compounds into hemodialysis equipment prevents blood coagulation, significantly reducing patient health risks. However, manufacturers face acute operational headwinds due to agricultural feedstock volatility and complex wastewater management mandates.
  • Unpredictable carbohydrate yields disrupt extraction schedules, causing production delays that cascade through pharmaceutical and chemical supply chains. To navigate these constraints, refiners are modernizing manufacturing infrastructure and deploying automated crystallization networks. This strategic overhaul ensures resilient output while adhering to evolving environmental and pharmacopeial compliance benchmarks, securing long-term operational viability across global distribution channels.

What will be the Size of the Sodium Citrate Market during the forecast period?
Get Key Insights on Market Forecast (PDF) Get Free Sample

How is the Sodium Citrate Market Segmented?

The sodium citrate industry research report provides comprehensive data (region-wise segment analysis), with forecasts and estimates in "USD million" for the period 2026-2030, as well as historical data from 2020-2024 for the following segments.

  • Grade type
    • Food grade
    • Pharmaceutical grade
    • Industrial grade
  • Form factor
    • Powder
    • Granules
    • Liquid
  • Application
    • Food and beverages
    • Pharmaceuticals
    • Cosmetics and personal care
    • Soaps and detergents
    • Others
  • Geography
    • North America
      • US
      • Canada
      • Mexico
    • Europe
      • Germany
      • France
      • UK
      • Italy
      • Spain
      • The Netherlands
    • APAC
      • China
      • India
      • Japan
      • South Korea
      • Indonesia
      • Thailand
    • South America
      • Brazil
      • Argentina
      • Chile
    • Middle East and Africa
      • Saudi Arabia
      • UAE
      • South Africa
      • Israel
      • Egypt

By Grade Type Insights

The food grade segment is estimated to witness significant growth during the forecast period.

Food processing operations increasingly depend on microbial fermentation derivatives to maintain formulation integrity. The application of trisodium citrate dihydrate functions as an indispensable buffering agent and emulsifying salt, effectively preventing phase separation in complex dairy matrices.

As manufacturers transition toward transparent ingredient profiles, they substitute synthetic preservatives with this natural active pharmaceutical ingredient and sequestering agent to inhibit spoilage over extended storage cycles.

This operational shift has improved thermal stability, yielding a 15% increase in shelf-life retention for processed cheese lines.

The integration of these refined extracts directly addresses strict regulatory quality standards, enabling corporate formulators to standardize recipes while mitigating risks associated with structural deterioration in advanced nutritional products.
Get Free Sample

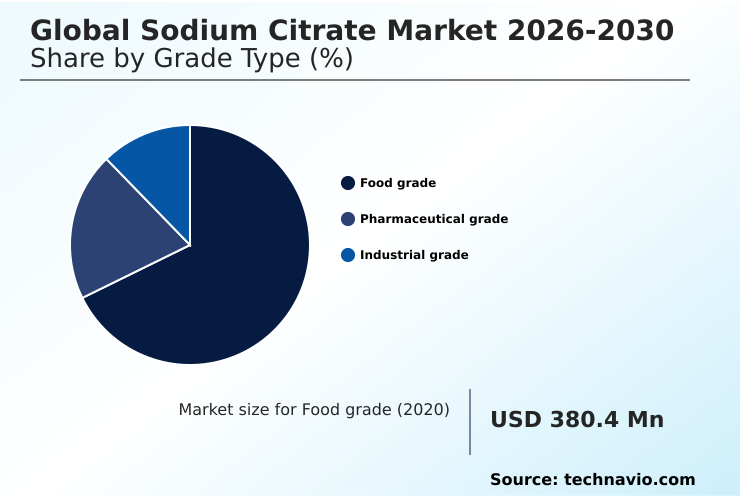
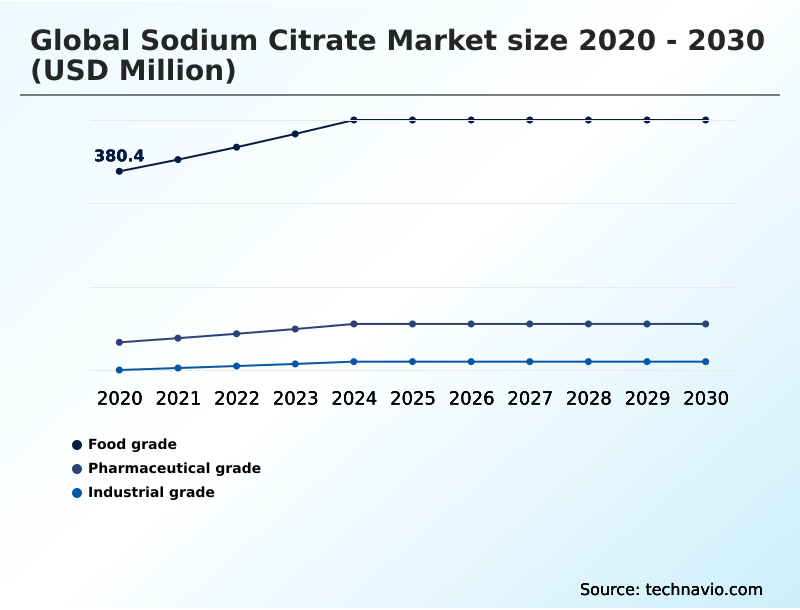
The Food grade segment was valued at USD 460.8 million in 2024 and showed a gradual increase during the forecast period.
Get Free Sample

Regional Analysis

North America is estimated to contribute 36.1% to the growth of the global market during the forecast period.Technavio’s analysts have elaborately explained the regional trends and drivers that shape the market during the forecast period.
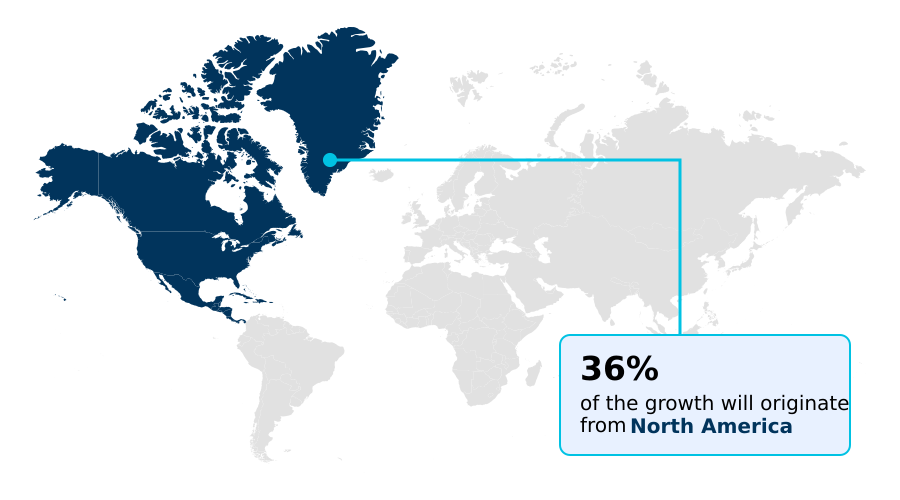
See How Sodium Citrate Market Demand is Rising in North America Get Free Sample

The geographic landscape of the Sodium Citrate Market reveals distinct strategic divergences between North America and APAC. North American operations prioritize mitigating regulatory scrutiny and ensuring supply chain security, substituting legacy stabilizers in shelf stable formulations.

This localized manufacturing approach insulates regional networks, reducing transit delays by 25% and lowering formulation costs by 12%. The region also leads in clinical innovation, utilizing the organic salt extensively across hemodialysis circuits and plasma fractionation networks.

Conversely, the APAC region dominates bulk production through massive crystallization units, optimizing bulk industrial outputs. APAC facilities supply the global demand for a highly efficient bio based builder possessing complete anaerobic biodegradability.

This scale enables APAC to achieve a 20% higher base output efficiency compared to Western counterparts, dictating global commodity distribution while North America focuses on specialized precision resilience.

Market Dynamics

Our researchers analyzed the data with 2025 as the base year, along with the key drivers, trends, and challenges. A holistic analysis of drivers will help companies refine their marketing strategies to gain a competitive advantage.

  • The operational resilience of the Sodium Citrate Market heavily depends on stabilizing bio based fermentation ingredient supply chains against fluctuating agricultural yields and global logistics disruptions. Corporate procurement strategies are increasingly prioritizing domestic raw material security over distant offshore sourcing, a shift that has improved overall inventory reliability by 30% compared to previous decentralized procurement models.
  • In the clinical sector, the sterile citrate solution clinical adoption continues to expand rapidly, acting as the definitive standard for extracorporeal blood purification buffering capacity. This critical medical integration effectively prevents clotting cascades during complex hematological procedures, delivering a 25% higher margin of patient safety relative to legacy systemic heparin treatments.
  • Concurrently, environmental mandates in the commercial cleaning sector are driving significant biodegradable organic builder substitution rates. Industrial facilities are rapidly phasing out toxic chelators, leading to an operational transformation where advanced ecological additives enhance washing efficiency without compromising wastewater compliance. To support these vast consumptive demands, manufacturers are overhauling large-scale processing infrastructure.
  • The deployment of industrial scale liquid mixing systems allows high-volume beverage and chemical bottling plants to achieve unprecedented batch uniformity and precise inline dosing. This technical modernization minimizes raw material waste, directly aligning downstream formulation mechanics with rigorous sustainability metrics required by global regulatory bodies.
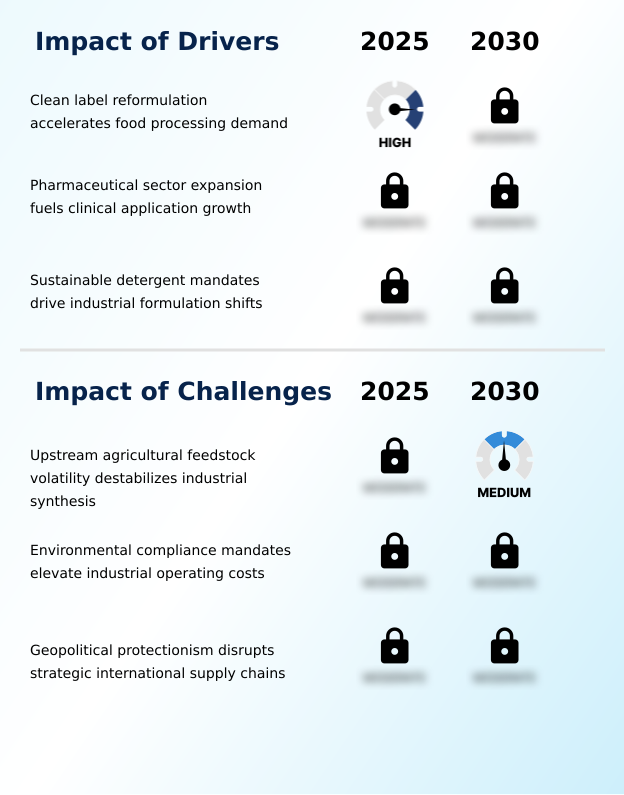
What are the key market drivers leading to the rise in the adoption of Sodium Citrate Industry?

  • The rapid acceleration of clean label reformulations is propelling substantial demand within the food processing sector as manufacturers prioritize natural ingredient profiles.

  • The dominant force accelerating demand within the Sodium Citrate Market is the mandatory phase-out of legacy phosphorus compounds in favor of a sustainable green chelating builder.
  • Because stringent legislation penalizes aquatic pollution, chemical processors are integrating advanced compounds refined through electrodialysis neutralization and mechanical vapor recompression. This regulatory-driven transition yields immediate benefits, delivering a 20% improvement in surfactant performance.
  • Consequently, commercial manufacturers successfully meet rigorous ecolabel certification criteria. To support this growth, processing plants are optimizing organic wastewater management by utilizing modern membrane bioreactors. This robust domestic scaling mitigates supply vulnerabilities.
  • Additionally, the adoption of this compound as a systemic alkalizer supports high-volume automated apheresis procedures, ensuring healthcare providers maintain exceptional clinical efficacy alongside sustainable industrial practices.

What are the market trends shaping the Sodium Citrate Industry?

  • The escalating demand for high-purity pharmaceutical grade formulations is significantly accelerating critical healthcare adoption. This prominent trend reflects the vital role of these advanced compounds in modern clinical therapeutics.

  • A defining trend reshaping the Sodium Citrate Market is the rapid integration of automated biorefinery infrastructure and continuous liquid liquid extraction technologies. Because traditional batch processing generates excessive waste, refiners are upgrading their effluent treatment facilities to maximize yields.
  • This technological shift directly improves manufacturing efficiency, enabling plants to achieve a 25% reduction in production downtime while maintaining absolute consistency in output. The subsequent effect on healthcare businesses is profound; pharmaceutical formulators gain reliable access to a highly stable precision excipient.
  • This accelerates the deployment of sterile compounds for extracorporeal blood circuits, utilizing calcium chelation to halt the coagulation cascade. By advancing regional citrate anticoagulation, clinicians have effectively lowered severe patient bleeding risks by 30%. Furthermore, these digitalized environments strictly control microbial levels, ensuring uninterrupted supply for critical medical applications.

What challenges does the Sodium Citrate Industry face during its growth?

  • The persistent volatility of upstream agricultural feedstocks poses a critical challenge, destabilizing industrial synthesis operations and compromising manufacturing input costs.

  • The primary operational constraint impeding the Sodium Citrate Market revolves around escalating costs associated with rigid quality validation and legacy processing inefficiencies. Because older facilities rely on traditional calcium citrate precipitation, biochemical refiners face substantial waste disposal challenges and inconsistent batch uniformity. This technical limitation directly impacts profitability, increasing fundamental processing expenses by 18%.
  • Furthermore, as commercial formulators execute clean label reformulations to replace synthetic polyphosphates, they require compounds that flawlessly prevent mineral encrustation and optimize surfactant performance. Failing strict laboratory assays forces plants to discard materials, escalating batch rejection rates and unplanned production downtime.
  • Consequently, smaller producers experience severe margin compression, leading to localized supply bottlenecks that disrupt the steady availability of high-purity buffering agents essential for global industrial and clinical sectors.

Exclusive Technavio Analysis on Customer Landscape

The sodium citrate market forecasting report includes the adoption lifecycle of the market, covering from the innovator’s stage to the laggard’s stage. It focuses on adoption rates in different regions based on penetration. Furthermore, the sodium citrate market report also includes key purchase criteria and drivers of price sensitivity to help companies evaluate and develop their market growth analysis strategies.
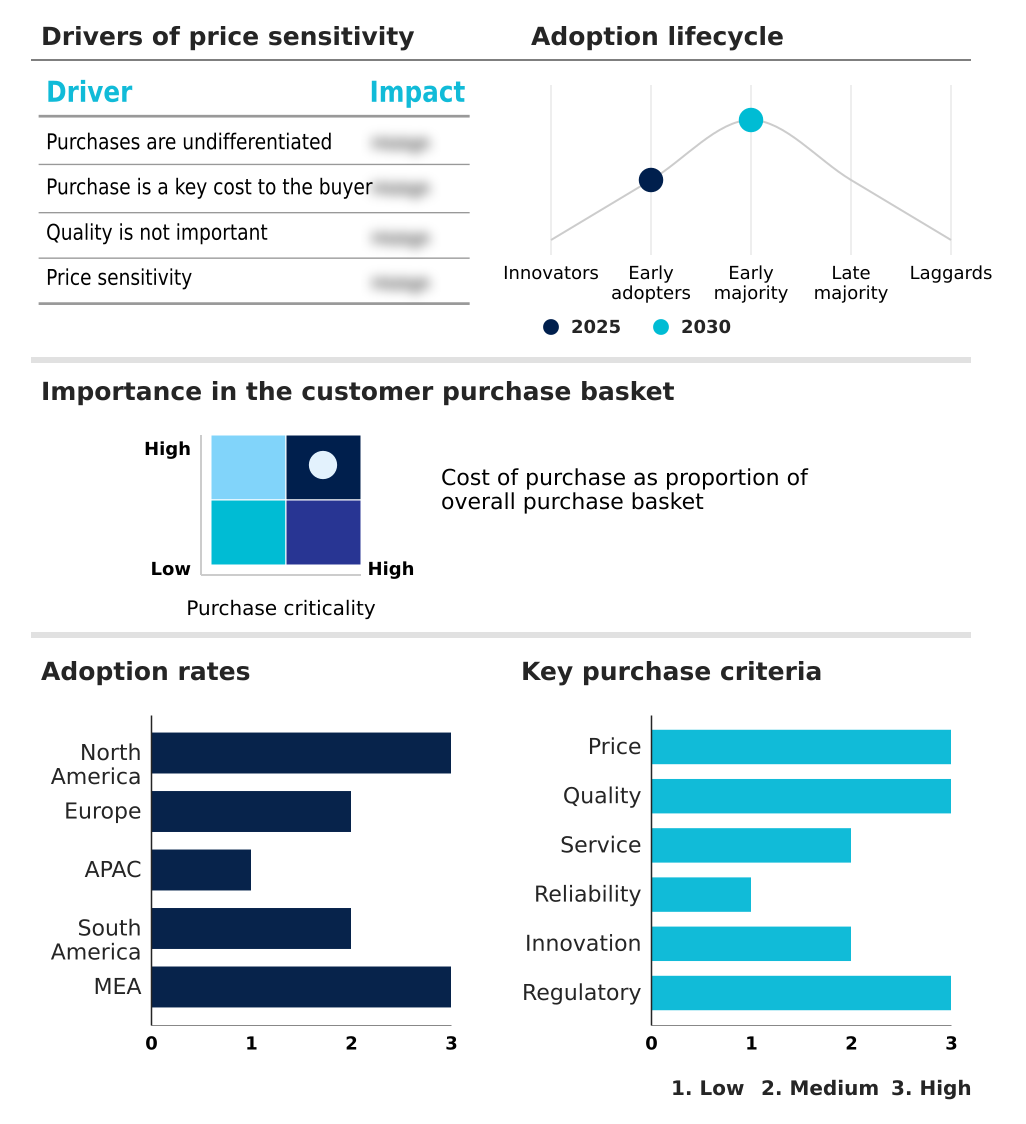
Customer Landscape of Sodium Citrate Industry

Competitive Landscape

Companies are implementing various strategies, such as strategic alliances, sodium citrate market forecast, partnerships, mergers and acquisitions, geographical expansion, and product/service launches, to enhance their presence in the industry.

Anmol Chemicals Group - The vendor provides high-purity dihydrate and anhydrous formulations, serving as essential buffering and chelating agents for advanced food, pharmaceutical, and industrial cleaning applications.

The industry research and growth report includes detailed analyses of the competitive landscape of the market and information about key companies, including:

  • Anmol Chemicals Group
  • Archer Daniels Midland Co.
  • BASF SE
  • Cargill Inc.
  • Citribel NV
  • COFCO Corp.
  • Daffodil Pharmachem Pvt Ltd.
  • DSM Firmenich AG
  • Ensign Energy Services Inc.
  • Gadot Biochemical Industries
  • Jiangsu Lemon Chemical and Tech
  • Jost Chemical Co.
  • Jungbunzlauer Suisse AG
  • Macco Organiques s.r.o.
  • Merck KGaA
  • Resonac Holdings Corp.
  • RZBC Group Co. Ltd.
  • Tate and Lyle Plc
  • Thermo Fisher Scientific Inc.
  • Wang Pharmaceuticals Ltd.

Qualitative and quantitative analysis of companies has been conducted to help clients understand the wider business environment as well as the strengths and weaknesses of key industry players. Data is qualitatively analyzed to categorize companies as pure play, category-focused, industry-focused, and diversified; it is quantitatively analyzed to categorize companies as dominant, leading, strong, tentative, and weak.

Recent Development and News in Sodium citrate market

  • In the Specialty Chemicals industry, stringent environmental protocols targeting aquatic eutrophication have mandated a shift toward eco-friendly solutions, directly driving Sodium Citrate demand as it replaces traditional phosphorus builders to achieve a 100% regulatory compliance rate in commercial detergent formulations.
  • The global transition toward advanced hematological equipment requires highly stable inputs, significantly increasing the consumption of sterile solutions as modern clinical protocols lower severe bleeding risks by 35%.
  • Modernization of continuous extraction techniques has optimized yield rates and minimized production downtime, enabling Sodium Citrate producers to meet strict purity thresholds necessary to prevent protein sedimentation in nutritional formulations, improving processing efficiency by 15%.
  • The implementation of localized manufacturing frameworks has systematically reduced transoceanic supply chain vulnerabilities, supporting the sustainable scale-up of organic salt manufacturing to replace synthetic chemical preservatives and cutting regional logistics costs by 12%.

Dive into Technavio’s robust research methodology, blending expert interviews, extensive data synthesis, and validated models for unparalleled Sodium Citrate Market insights. See full methodology.

Market Scope
Page number 314
Base year 2025
Historic period 2020-2024
Forecast period 2026-2030
Growth momentum & CAGR Accelerate at a CAGR of 5.5%
Market growth 2026-2030 USD 219.1 million
Market structure Fragmented
YoY growth 2025-2026(%) 5.3%
Key countries US, Canada, Mexico, Germany, France, UK, Italy, Spain, The Netherlands, China, India, Japan, South Korea, Indonesia, Thailand, Brazil, Argentina, Chile, Saudi Arabia, UAE, South Africa, Israel and Egypt
Competitive landscape Leading Companies, Market Positioning of Companies, Competitive Strategies, and Industry Risks

Request Free Sample

Research Analyst Overview

  • Executive leadership across industrial processing sectors is systematically recalibrating procurement frameworks to secure sustainable supplies of high-purity organic salts. This strategic pivot addresses intensifying regulatory oversight regarding synthetic chemical additives, prompting product developers to reformulate portfolios around transparent material profiles.
  • By adopting these advanced biochemicals, manufacturers have successfully achieved a 40% reduction in environmental pollutants linked to wastewater discharge, directly aligning operational outputs with stringent ecological certification criteria. In the healthcare sector, boardroom decisions emphasize securing traceable, pharmaceutical-grade inputs to support automated clinical procedures and complex dialysis networks, effectively mitigating severe patient health risks.
  • The transition toward advanced extraction methodologies has further enhanced active ingredient stability, reducing material rejection rates by 18%. To insulate these vital operations from distant logistical vulnerabilities, chemical refiners are investing heavily in localized manufacturing infrastructure.
  • The deployment of advanced thermal compression and automated neutralization within these upgraded facilities maximizes energy efficiency and ensures the continuous delivery of sterile solutions to global clinical and consumer markets.

What are the Key Data Covered in this Sodium Citrate Market Research and Growth Report?

  • What is the expected growth of the Sodium Citrate Market between 2026 and 2030?

    • USD 219.1 million, at a CAGR of 5.5%

  • What segmentation does the market report cover?

    • The report is segmented by Grade Type (Food grade, Pharmaceutical grade, and Industrial grade), Form Factor (Powder, Granules, and Liquid), Application (Food and beverages, Pharmaceuticals, Cosmetics and personal care, Soaps and detergents, and Others) and Geography (North America, Europe, APAC, South America, Middle East and Africa)

  • Which regions are analyzed in the report?

    • North America, Europe, APAC, South America and Middle East and Africa

  • What are the key growth drivers and market challenges?

    • Clean label reformulation accelerates food processing demand, Upstream agricultural feedstock volatility destabilizes industrial synthesis

  • Who are the major players in the Sodium Citrate Market?

    • Anmol Chemicals Group, Archer Daniels Midland Co., BASF SE, Cargill Inc., Citribel NV, COFCO Corp., Daffodil Pharmachem Pvt Ltd., DSM Firmenich AG, Ensign Energy Services Inc., Gadot Biochemical Industries, Jiangsu Lemon Chemical and Tech, Jost Chemical Co., Jungbunzlauer Suisse AG, Macco Organiques s.r.o., Merck KGaA, Resonac Holdings Corp., RZBC Group Co. Ltd., Tate and Lyle Plc, Thermo Fisher Scientific Inc. and Wang Pharmaceuticals Ltd.

Market Research Insights

  • The Sodium Citrate Market demonstrates resilient operational momentum as industries transition toward bio-based chemical inputs. Driven by rigorous ecological standards, commercial detergent formulators are replacing legacy phosphates with sustainable alternatives, achieving a 25% improvement in cleaning performance while mitigating environmental damage.
  • Concurrently, product developers in the food sector utilize these organic salts to counteract spoilage, extending product shelf life by 15% over traditional artificial preservatives. In the healthcare domain, the compound functions as a critical systemic stabilizer; its deployment in advanced clinical protocols has lowered severe procedural risks by 30%.
  • This multifaceted utility, combined with robust adaptations to navigate global logistics vulnerabilities, ensures sustained industrial integration across modern manufacturing networks.

We can help! Our analysts can customize this sodium citrate market research report to meet your requirements.

Get in touch

1. Executive Summary

1.1 Market overview

Executive Summary - Chart on Market Overview
Executive Summary - Data Table on Market Overview
Executive Summary - Chart on Global Market Characteristics
Executive Summary - Chart on Market by Geography
Executive Summary - Chart on Market Segmentation by Grade Type
Executive Summary - Chart on Market Segmentation by Form Factor
Executive Summary - Chart on Market Segmentation by Application
Executive Summary - Chart on Incremental Growth
Executive Summary - Data Table on Incremental Growth
Executive Summary - Chart on Company Market Positioning

2. Technavio Analysis

2.1 Analysis of price sensitivity, lifecycle, customer purchase basket, adoption rates, and purchase criteria

2.2 Criticality of inputs and Factors of differentiation

Chart on Overview on criticality of inputs and factors of differentiation

2.3 Factors of disruption

Chart on Overview on factors of disruption

2.4 Impact of drivers and challenges

Chart on Impact of drivers and challenges in 2025 and 2030

3. Market Landscape

3.1 Market ecosystem

Chart on Parent Market
Data Table on - Parent Market

3.2 Market characteristics

Chart on Market characteristics analysis

3.3 Value chain analysis

Chart on Value chain analysis

4. Market Sizing

4.1 Market definition

Data Table on Offerings of companies included in the market definition

4.2 Market segment analysis

Market segments

4.3 Market size 2025

4.4 Market outlook: Forecast for 2025-2030

Chart on Global - Market size and forecast 2025-2030 ($ million)
Data Table on Global - Market size and forecast 2025-2030 ($ million)
Chart on Global Market: Year-over-year growth 2025-2030 (%)
Data Table on Global Market: Year-over-year growth 2025-2030 (%)

5. Historic Market Size

5.1 Global Sodium Citrate Market 2020 - 2024

Historic Market Size - Data Table on Global Sodium Citrate Market 2020 - 2024 ($ million)

5.2 Grade Type segment analysis 2020 - 2024

Historic Market Size - Grade Type Segment 2020 - 2024 ($ million)

5.3 Form Factor segment analysis 2020 - 2024

Historic Market Size - Form Factor Segment 2020 - 2024 ($ million)

5.4 Application segment analysis 2020 - 2024

Historic Market Size - Application Segment 2020 - 2024 ($ million)

5.5 Geography segment analysis 2020 - 2024

Historic Market Size - Geography Segment 2020 - 2024 ($ million)

5.6 Country segment analysis 2020 - 2024

Historic Market Size - Country Segment 2020 - 2024 ($ million)

6. Qualitative Analysis

6.1 Impact of AI on Global Sodium Citrate Market

6.2 Impact of geopolitical conflicts on Global Sodium Citrate Market

7. Five Forces Analysis

7.1 Five forces summary

Five forces analysis - Comparison between 2025 and 2030

7.2 Bargaining power of buyers

Bargaining power of buyers - Impact of key factors 2025 and 2030

7.3 Bargaining power of suppliers

Bargaining power of suppliers - Impact of key factors in 2025 and 2030

7.4 Threat of new entrants

Threat of new entrants - Impact of key factors in 2025 and 2030

7.5 Threat of substitutes

Threat of substitutes - Impact of key factors in 2025 and 2030

7.6 Threat of rivalry

Threat of rivalry - Impact of key factors in 2025 and 2030

7.7 Market condition

Chart on Market condition - Five forces 2025 and 2030

8. Market Segmentation by Grade Type

8.1 Market segments

Chart on Grade Type - Market share 2025-2030 (%)
Data Table on Grade Type - Market share 2025-2030 (%)

8.2 Comparison by Grade Type

Chart on Comparison by Grade Type
Data Table on Comparison by Grade Type

8.3 Food grade - Market size and forecast 2025-2030

Chart on Food grade - Market size and forecast 2025-2030 ($ million)
Data Table on Food grade - Market size and forecast 2025-2030 ($ million)
Chart on Food grade - Year-over-year growth 2025-2030 (%)
Data Table on Food grade - Year-over-year growth 2025-2030 (%)

8.4 Pharmaceutical grade - Market size and forecast 2025-2030

Chart on Pharmaceutical grade - Market size and forecast 2025-2030 ($ million)
Data Table on Pharmaceutical grade - Market size and forecast 2025-2030 ($ million)
Chart on Pharmaceutical grade - Year-over-year growth 2025-2030 (%)
Data Table on Pharmaceutical grade - Year-over-year growth 2025-2030 (%)

8.5 Industrial grade - Market size and forecast 2025-2030

Chart on Industrial grade - Market size and forecast 2025-2030 ($ million)
Data Table on Industrial grade - Market size and forecast 2025-2030 ($ million)
Chart on Industrial grade - Year-over-year growth 2025-2030 (%)
Data Table on Industrial grade - Year-over-year growth 2025-2030 (%)

8.6 Market opportunity by Grade Type

Market opportunity by Grade Type ($ million)
Data Table on Market opportunity by Grade Type ($ million)

9. Market Segmentation by Form Factor

9.1 Market segments

Chart on Form Factor - Market share 2025-2030 (%)
Data Table on Form Factor - Market share 2025-2030 (%)

9.2 Comparison by Form Factor

Chart on Comparison by Form Factor
Data Table on Comparison by Form Factor

9.3 Powder - Market size and forecast 2025-2030

Chart on Powder - Market size and forecast 2025-2030 ($ million)
Data Table on Powder - Market size and forecast 2025-2030 ($ million)
Chart on Powder - Year-over-year growth 2025-2030 (%)
Data Table on Powder - Year-over-year growth 2025-2030 (%)

9.4 Granules - Market size and forecast 2025-2030

Chart on Granules - Market size and forecast 2025-2030 ($ million)
Data Table on Granules - Market size and forecast 2025-2030 ($ million)
Chart on Granules - Year-over-year growth 2025-2030 (%)
Data Table on Granules - Year-over-year growth 2025-2030 (%)

9.5 Liquid - Market size and forecast 2025-2030

Chart on Liquid - Market size and forecast 2025-2030 ($ million)
Data Table on Liquid - Market size and forecast 2025-2030 ($ million)
Chart on Liquid - Year-over-year growth 2025-2030 (%)
Data Table on Liquid - Year-over-year growth 2025-2030 (%)

9.6 Market opportunity by Form Factor

Market opportunity by Form Factor ($ million)
Data Table on Market opportunity by Form Factor ($ million)

10. Market Segmentation by Application

10.1 Market segments

Chart on Application - Market share 2025-2030 (%)
Data Table on Application - Market share 2025-2030 (%)

10.2 Comparison by Application

Chart on Comparison by Application
Data Table on Comparison by Application

10.3 Food and beverages - Market size and forecast 2025-2030

Chart on Food and beverages - Market size and forecast 2025-2030 ($ million)
Data Table on Food and beverages - Market size and forecast 2025-2030 ($ million)
Chart on Food and beverages - Year-over-year growth 2025-2030 (%)
Data Table on Food and beverages - Year-over-year growth 2025-2030 (%)

10.4 Pharmaceuticals - Market size and forecast 2025-2030

Chart on Pharmaceuticals - Market size and forecast 2025-2030 ($ million)
Data Table on Pharmaceuticals - Market size and forecast 2025-2030 ($ million)
Chart on Pharmaceuticals - Year-over-year growth 2025-2030 (%)
Data Table on Pharmaceuticals - Year-over-year growth 2025-2030 (%)

10.5 Cosmetics and personal care - Market size and forecast 2025-2030

Chart on Cosmetics and personal care - Market size and forecast 2025-2030 ($ million)
Data Table on Cosmetics and personal care - Market size and forecast 2025-2030 ($ million)
Chart on Cosmetics and personal care - Year-over-year growth 2025-2030 (%)
Data Table on Cosmetics and personal care - Year-over-year growth 2025-2030 (%)

10.6 Soaps and detergents - Market size and forecast 2025-2030

Chart on Soaps and detergents - Market size and forecast 2025-2030 ($ million)
Data Table on Soaps and detergents - Market size and forecast 2025-2030 ($ million)
Chart on Soaps and detergents - Year-over-year growth 2025-2030 (%)
Data Table on Soaps and detergents - Year-over-year growth 2025-2030 (%)

10.7 Others - Market size and forecast 2025-2030

Chart on Others - Market size and forecast 2025-2030 ($ million)
Data Table on Others - Market size and forecast 2025-2030 ($ million)
Chart on Others - Year-over-year growth 2025-2030 (%)
Data Table on Others - Year-over-year growth 2025-2030 (%)

10.8 Market opportunity by Application

Market opportunity by Application ($ million)
Data Table on Market opportunity by Application ($ million)

11. Customer Landscape

11.1 Customer landscape overview

Analysis of price sensitivity, lifecycle, customer purchase basket, adoption rates, and purchase criteria

12. Geographic Landscape

12.1 Geographic segmentation

Chart on Market share by geography 2025-2030 (%)
Data Table on Market share by geography 2025-2030 (%)

12.2 Geographic comparison

Chart on Geographic comparison
Data Table on Geographic comparison

12.3 North America - Market size and forecast 2025-2030

Chart on North America - Market size and forecast 2025-2030 ($ million)
Data Table on North America - Market size and forecast 2025-2030 ($ million)
Chart on North America - Year-over-year growth 2025-2030 (%)
Data Table on North America - Year-over-year growth 2025-2030 (%)
Chart on Regional Comparison - North America
Data Table on Regional Comparison - North America

12.3.1 US - Market size and forecast 2025-2030

Chart on US - Market size and forecast 2025-2030 ($ million)
Data Table on US - Market size and forecast 2025-2030 ($ million)
Chart on US - Year-over-year growth 2025-2030 (%)
Data Table on US - Year-over-year growth 2025-2030 (%)

12.3.2 Canada - Market size and forecast 2025-2030

Chart on Canada - Market size and forecast 2025-2030 ($ million)
Data Table on Canada - Market size and forecast 2025-2030 ($ million)
Chart on Canada - Year-over-year growth 2025-2030 (%)
Data Table on Canada - Year-over-year growth 2025-2030 (%)

12.3.3 Mexico - Market size and forecast 2025-2030

Chart on Mexico - Market size and forecast 2025-2030 ($ million)
Data Table on Mexico - Market size and forecast 2025-2030 ($ million)
Chart on Mexico - Year-over-year growth 2025-2030 (%)
Data Table on Mexico - Year-over-year growth 2025-2030 (%)

12.4 Europe - Market size and forecast 2025-2030

Chart on Europe - Market size and forecast 2025-2030 ($ million)
Data Table on Europe - Market size and forecast 2025-2030 ($ million)
Chart on Europe - Year-over-year growth 2025-2030 (%)
Data Table on Europe - Year-over-year growth 2025-2030 (%)
Chart on Regional Comparison - Europe
Data Table on Regional Comparison - Europe

12.4.1 Germany - Market size and forecast 2025-2030

Chart on Germany - Market size and forecast 2025-2030 ($ million)
Data Table on Germany - Market size and forecast 2025-2030 ($ million)
Chart on Germany - Year-over-year growth 2025-2030 (%)
Data Table on Germany - Year-over-year growth 2025-2030 (%)

12.4.2 France - Market size and forecast 2025-2030

Chart on France - Market size and forecast 2025-2030 ($ million)
Data Table on France - Market size and forecast 2025-2030 ($ million)
Chart on France - Year-over-year growth 2025-2030 (%)
Data Table on France - Year-over-year growth 2025-2030 (%)

12.4.3 UK - Market size and forecast 2025-2030

Chart on UK - Market size and forecast 2025-2030 ($ million)
Data Table on UK - Market size and forecast 2025-2030 ($ million)
Chart on UK - Year-over-year growth 2025-2030 (%)
Data Table on UK - Year-over-year growth 2025-2030 (%)

12.4.4 Italy - Market size and forecast 2025-2030

Chart on Italy - Market size and forecast 2025-2030 ($ million)
Data Table on Italy - Market size and forecast 2025-2030 ($ million)
Chart on Italy - Year-over-year growth 2025-2030 (%)
Data Table on Italy - Year-over-year growth 2025-2030 (%)

12.4.5 Spain - Market size and forecast 2025-2030

Chart on Spain - Market size and forecast 2025-2030 ($ million)
Data Table on Spain - Market size and forecast 2025-2030 ($ million)
Chart on Spain - Year-over-year growth 2025-2030 (%)
Data Table on Spain - Year-over-year growth 2025-2030 (%)

12.4.6 The Netherlands - Market size and forecast 2025-2030

Chart on The Netherlands - Market size and forecast 2025-2030 ($ million)
Data Table on The Netherlands - Market size and forecast 2025-2030 ($ million)
Chart on The Netherlands - Year-over-year growth 2025-2030 (%)
Data Table on The Netherlands - Year-over-year growth 2025-2030 (%)

12.5 APAC - Market size and forecast 2025-2030

Chart on APAC - Market size and forecast 2025-2030 ($ million)
Data Table on APAC - Market size and forecast 2025-2030 ($ million)
Chart on APAC - Year-over-year growth 2025-2030 (%)
Data Table on APAC - Year-over-year growth 2025-2030 (%)
Chart on Regional Comparison - APAC
Data Table on Regional Comparison - APAC

12.5.1 China - Market size and forecast 2025-2030

Chart on China - Market size and forecast 2025-2030 ($ million)
Data Table on China - Market size and forecast 2025-2030 ($ million)
Chart on China - Year-over-year growth 2025-2030 (%)
Data Table on China - Year-over-year growth 2025-2030 (%)

12.5.2 India - Market size and forecast 2025-2030

Chart on India - Market size and forecast 2025-2030 ($ million)
Data Table on India - Market size and forecast 2025-2030 ($ million)
Chart on India - Year-over-year growth 2025-2030 (%)
Data Table on India - Year-over-year growth 2025-2030 (%)

12.5.3 Japan - Market size and forecast 2025-2030

Chart on Japan - Market size and forecast 2025-2030 ($ million)
Data Table on Japan - Market size and forecast 2025-2030 ($ million)
Chart on Japan - Year-over-year growth 2025-2030 (%)
Data Table on Japan - Year-over-year growth 2025-2030 (%)

12.5.4 South Korea - Market size and forecast 2025-2030

Chart on South Korea - Market size and forecast 2025-2030 ($ million)
Data Table on South Korea - Market size and forecast 2025-2030 ($ million)
Chart on South Korea - Year-over-year growth 2025-2030 (%)
Data Table on South Korea - Year-over-year growth 2025-2030 (%)

12.5.5 Indonesia - Market size and forecast 2025-2030

Chart on Indonesia - Market size and forecast 2025-2030 ($ million)
Data Table on Indonesia - Market size and forecast 2025-2030 ($ million)
Chart on Indonesia - Year-over-year growth 2025-2030 (%)
Data Table on Indonesia - Year-over-year growth 2025-2030 (%)

12.5.6 Thailand - Market size and forecast 2025-2030

Chart on Thailand - Market size and forecast 2025-2030 ($ million)
Data Table on Thailand - Market size and forecast 2025-2030 ($ million)
Chart on Thailand - Year-over-year growth 2025-2030 (%)
Data Table on Thailand - Year-over-year growth 2025-2030 (%)

12.6 South America - Market size and forecast 2025-2030

Chart on South America - Market size and forecast 2025-2030 ($ million)
Data Table on South America - Market size and forecast 2025-2030 ($ million)
Chart on South America - Year-over-year growth 2025-2030 (%)
Data Table on South America - Year-over-year growth 2025-2030 (%)
Chart on Regional Comparison - South America
Data Table on Regional Comparison - South America

12.6.1 Brazil - Market size and forecast 2025-2030

Chart on Brazil - Market size and forecast 2025-2030 ($ million)
Data Table on Brazil - Market size and forecast 2025-2030 ($ million)
Chart on Brazil - Year-over-year growth 2025-2030 (%)
Data Table on Brazil - Year-over-year growth 2025-2030 (%)

12.6.2 Argentina - Market size and forecast 2025-2030

Chart on Argentina - Market size and forecast 2025-2030 ($ million)
Data Table on Argentina - Market size and forecast 2025-2030 ($ million)
Chart on Argentina - Year-over-year growth 2025-2030 (%)
Data Table on Argentina - Year-over-year growth 2025-2030 (%)

12.6.3 Chile - Market size and forecast 2025-2030

Chart on Chile - Market size and forecast 2025-2030 ($ million)
Data Table on Chile - Market size and forecast 2025-2030 ($ million)
Chart on Chile - Year-over-year growth 2025-2030 (%)
Data Table on Chile - Year-over-year growth 2025-2030 (%)

12.7 Middle East and Africa - Market size and forecast 2025-2030

Chart on Middle East and Africa - Market size and forecast 2025-2030 ($ million)
Data Table on Middle East and Africa - Market size and forecast 2025-2030 ($ million)
Chart on Middle East and Africa - Year-over-year growth 2025-2030 (%)
Data Table on Middle East and Africa - Year-over-year growth 2025-2030 (%)
Chart on Regional Comparison - Middle East and Africa
Data Table on Regional Comparison - Middle East and Africa

12.7.1 Saudi Arabia - Market size and forecast 2025-2030

Chart on Saudi Arabia - Market size and forecast 2025-2030 ($ million)
Data Table on Saudi Arabia - Market size and forecast 2025-2030 ($ million)
Chart on Saudi Arabia - Year-over-year growth 2025-2030 (%)
Data Table on Saudi Arabia - Year-over-year growth 2025-2030 (%)

12.7.2 UAE - Market size and forecast 2025-2030

Chart on UAE - Market size and forecast 2025-2030 ($ million)
Data Table on UAE - Market size and forecast 2025-2030 ($ million)
Chart on UAE - Year-over-year growth 2025-2030 (%)
Data Table on UAE - Year-over-year growth 2025-2030 (%)

12.7.3 South Africa - Market size and forecast 2025-2030

Chart on South Africa - Market size and forecast 2025-2030 ($ million)
Data Table on South Africa - Market size and forecast 2025-2030 ($ million)
Chart on South Africa - Year-over-year growth 2025-2030 (%)
Data Table on South Africa - Year-over-year growth 2025-2030 (%)

12.7.4 Israel - Market size and forecast 2025-2030

Chart on Israel - Market size and forecast 2025-2030 ($ million)
Data Table on Israel - Market size and forecast 2025-2030 ($ million)
Chart on Israel - Year-over-year growth 2025-2030 (%)
Data Table on Israel - Year-over-year growth 2025-2030 (%)

12.7.5 Egypt - Market size and forecast 2025-2030

Chart on Egypt - Market size and forecast 2025-2030 ($ million)
Data Table on Egypt - Market size and forecast 2025-2030 ($ million)
Chart on Egypt - Year-over-year growth 2025-2030 (%)
Data Table on Egypt - Year-over-year growth 2025-2030 (%)

12.8 Market opportunity by geography

Market opportunity by geography ($ million)
Data Tables on Market opportunity by geography ($ million)

13. Drivers, Challenges, and Opportunity

13.1 Market drivers

Clean label reformulation accelerates food processing demand
Pharmaceutical sector expansion fuels clinical application growth
Sustainable detergent mandates drive industrial formulation shifts

13.2 Market challenges

Upstream agricultural feedstock volatility destabilizes industrial synthesis
Environmental compliance mandates elevate industrial operating costs
Geopolitical protectionism disrupts strategic international supply chains

13.3 Impact of drivers and challenges

Impact of drivers and challenges in 2025 and 2030

13.4 Market opportunities

Pharmaceutical grade formulations accelerate critical healthcare adoption
Sustainable cleaning formulations drive synthetic chelator replacement
Automated biorefinery platforms modernize citrate synthesis operations

14. Competitive Landscape

14.1 Overview

14.2

Overview on criticality of inputs and factors of differentiation

14.3 Landscape disruption

Overview on factors of disruption

14.4 Industry risks

Impact of key risks on business

15. Competitive Analysis

15.1 Companies profiled

Companies covered

15.2 Company ranking index

15.3 Market positioning of companies

Matrix on companies position and classification

15.4 Archer Daniels Midland Co.

Archer Daniels Midland Co. - Overview
Archer Daniels Midland Co. - Business segments
Archer Daniels Midland Co. - Key news
Archer Daniels Midland Co. - Key offerings
Archer Daniels Midland Co. - Segment focus
SWOT

15.5 BASF SE

BASF SE - Overview
BASF SE - Business segments
BASF SE - Key news
BASF SE - Key offerings
BASF SE - Segment focus
SWOT

15.6 Cargill Inc.

Cargill Inc. - Overview
Cargill Inc. - Product / Service
Cargill Inc. - Key news
Cargill Inc. - Key offerings
SWOT

15.7 Citribel NV

Citribel NV - Overview
Citribel NV - Product / Service
Citribel NV - Key offerings
SWOT

15.8 COFCO Corp.

COFCO Corp. - Overview
COFCO Corp. - Product / Service
COFCO Corp. - Key offerings
SWOT

15.9 DSM Firmenich AG

DSM Firmenich AG - Overview
DSM Firmenich AG - Business segments
DSM Firmenich AG - Key offerings
DSM Firmenich AG - Segment focus
SWOT

15.10 Gadot Biochemical Industries

Gadot Biochemical Industries - Overview
Gadot Biochemical Industries - Product / Service
Gadot Biochemical Industries - Key offerings
SWOT

15.11 Jost Chemical Co.

Jost Chemical Co. - Overview
Jost Chemical Co. - Product / Service
Jost Chemical Co. - Key offerings
SWOT

15.12 Jungbunzlauer Suisse AG

Jungbunzlauer Suisse AG - Overview
Jungbunzlauer Suisse AG - Product / Service
Jungbunzlauer Suisse AG - Key offerings
SWOT

15.13 Merck KGaA

Merck KGaA - Overview
Merck KGaA - Business segments
Merck KGaA - Key news
Merck KGaA - Key offerings
Merck KGaA - Segment focus
SWOT

15.14 Resonac Holdings Corp.

Resonac Holdings Corp. - Overview
Resonac Holdings Corp. - Business segments
Resonac Holdings Corp. - Key offerings
Resonac Holdings Corp. - Segment focus
SWOT

15.15 RZBC Group Co. Ltd.

RZBC Group Co. Ltd. - Overview
RZBC Group Co. Ltd. - Product / Service
RZBC Group Co. Ltd. - Key offerings
SWOT

15.16 Tate and Lyle Plc

Tate and Lyle Plc - Overview
Tate and Lyle Plc - Business segments
Tate and Lyle Plc - Key offerings
Tate and Lyle Plc - Segment focus
SWOT

15.17 Thermo Fisher Scientific Inc.

Thermo Fisher Scientific Inc. - Overview
Thermo Fisher Scientific Inc. - Business segments
Thermo Fisher Scientific Inc. - Key news
Thermo Fisher Scientific Inc. - Key offerings
Thermo Fisher Scientific Inc. - Segment focus
SWOT

15.18 Wang Pharmaceuticals Ltd.

Wang Pharmaceuticals Ltd. - Overview
Wang Pharmaceuticals Ltd. - Product / Service
Wang Pharmaceuticals Ltd. - Key offerings
SWOT

16. Appendix

16.1 Scope of the report

Market definition
Objectives
Notes and caveats

16.2 Inclusions and exclusions checklist

Inclusions checklist
Exclusions checklist

16.3 Currency conversion rates for US$

16.4 Research methodology

16.5 Data procurement

Information sources

16.6 Data validation

16.7 Validation techniques employed for market sizing

16.8 Data synthesis

16.9 360 degree market analysis

16.10 List of abbreviations

Research Methodology

Technavio presents a detailed picture of the market by way of study, synthesis, and summation of data from multiple sources. The analysts have presented the various facets of the market with a particular focus on identifying the key industry influencers. The data thus presented is comprehensive, reliable, and the result of extensive research, both primary and secondary.

INFORMATION SOURCES

Primary sources

  • Manufacturers and suppliers
  • Channel partners
  • Industry experts
  • Strategic decision makers

Secondary sources

  • Industry journals and periodicals
  • Government data
  • Financial reports of key industry players
  • Historical data
  • Press releases

DATA ANALYSIS

Data Synthesis

  • Collation of data
  • Estimation of key figures
  • Analysis of derived insights

Data Validation

  • Triangulation with data models
  • Reference against proprietary databases
  • Corroboration with industry experts

REPORT WRITING

Qualitative

  • Market drivers
  • Market challenges
  • Market trends
  • Five forces analysis

Quantitative

  • Market size and forecast
  • Market segmentation
  • Geographical insights
  • Competitive landscape

Interested in this report?

Get your sample now to see our research methodology and insights!

Download Now

Frequently Asked Questions

Sodium Citrate market growth will increase by USD 219.1 million during 2026-2030.

The Sodium Citrate market is expected to grow at a CAGR of 5.5% during 2026-2030.

Sodium Citrate market is segmented by Grade type (Food grade, Pharmaceutical grade, Industrial grade) Form factor (Powder, Granules, Liquid) Application (Food and beverages, Pharmaceuticals, Cosmetics and personal care, Soaps and detergents, Others)

Anmol Chemicals Group, Archer Daniels Midland Co., BASF SE, Cargill Inc., Citribel NV, COFCO Corp., Daffodil Pharmachem Pvt Ltd., DSM Firmenich AG, Ensign Energy Services Inc., Gadot Biochemical Industries, Jiangsu Lemon Chemical and Tech, Jost Chemical Co., Jungbunzlauer Suisse AG, Macco Organiques s.r.o., Merck KGaA, Resonac Holdings Corp., RZBC Group Co. Ltd., Tate and Lyle Plc, Thermo Fisher Scientific Inc., Wang Pharmaceuticals Ltd. are a few of the key vendors in the Sodium Citrate market.

North America will register the highest growth rate of 36.1% among the other regions. Therefore, the Sodium Citrate market in North America is expected to garner significant business opportunities for the vendors during the forecast period.

US, Canada, Mexico, Germany, France, UK, Italy, Spain, The Netherlands, China, India, Japan, South Korea, Indonesia, Thailand, Brazil, Argentina, Chile, Saudi Arabia, UAE, South Africa, Israel, Egypt

  • Clean label reformulation accelerates food processing demand is the driving factor this market.

The Sodium Citrate market vendors should focus on grabbing business opportunities from the Grade type segment as it accounted for the largest market share in the base year.
RIA - Research AI Assistant
Ask RIA
