
Salt Market Size 2025-2029
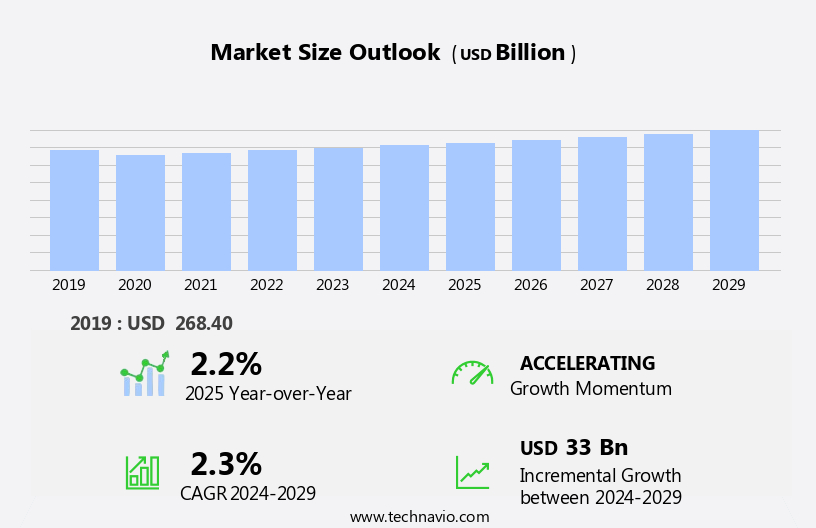
The salt market size is forecast to increase by USD 33 billion at a CAGR of 2.3% between 2024 and 2029.
- The market is driven by its extensive applications in various industries, including food processing, chemical manufacturing, and water softening. The increasing production of salt in the Asia Pacific region, particularly through the solar evaporation process, is a significant growth factor. However, market expansion is not without challenges. Regulatory hurdles, such as stringent food safety regulations, impact adoption, particularly in the food industry. Product recalls due to contaminated salt supplies can lead to substantial financial losses and damage to brand reputation. The market witnesses significant growth driven by the wide range of applications in various industries, including food processing, water softening, chemical manufacturing, and others.
- Supply chain inconsistencies, including fluctuations in raw material availability and pricing, can also temper growth potential. Companies seeking to capitalize on market opportunities must navigate these challenges effectively by implementing robust quality control measures, establishing reliable supply chains, and adhering to regulatory requirements. By doing so, they can ensure customer trust and loyalty while maintaining a competitive edge in the market. The market encompasses a diverse range of applications, including solar evaporation processes, agriculture, cloud seeding, and de-icing, among others.
What will be the Size of the Salt Market during the forecast period?
- The market encompasses various applications, with significant demand arising from food consumption and chemical processing industries. Mining officials oversee the extraction of minerals such as rock salt, used extensively in de-icing activities in urban areas. Quality is a crucial factor in both food and chemical applications, with regulations ensuring that safety and environmental concerns are addressed. In the chemical processing sector, salt is employed in the production of chlorine and other inorganic compounds. Processing activities involve the transformation of raw materials into finished products, requiring adherence to stringent safety standards and licensing requirements. Governments worldwide have initiated various initiatives to promote sustainable mining practices and address economic alternatives to traditional mining methods, such as seawater evaporation. In chemical processing, industrial salt is an indispensable component, contributing significantly to the production of soda ash, caustic soda, and chlorine.
- Mining activities, however, remain subject to ongoing regulations, influencing market dynamics. As the global population grows, demand for de-icing products and water treatment applications continues to increase. Sodium, a primary component of salt, plays a vital role in these applications. Economic alternatives and regulatory approvals will shape the market's future trends.
How is this Salt Industry segmented?
The salt industry research report provides comprehensive data (region-wise segment analysis), with forecasts and estimates in "USD billion" for the period 2025-2029, as well as historical data from 2019-2023 for the following segments.
- Type
- Rock salt
- Brine
- Solar salt
- Vacuum pan salt
- Application
- Chemical processing
- Road de-icing
- Food processing
- Others
- Source
- Mined salt
- Sea salt
- Well and salt lake
- Geography
- North America
- US
- Canada
- Europe
- France
- Germany
- UK
- APAC
- Australia
- China
- India
- Japan
- South Korea
- Rest of World (ROW)
- North America
By Type Insights
The rock salt segment is estimated to witness significant growth during the forecast period. Rock salt, the least processed form of salt, is obtained through the natural evaporation of seawater or lake water. This untreated salt retains all the inherent impurities, resulting in various color varieties, including yellow, blue, and red. Sodium and chloride, the primary components of rock salt, are vital for numerous industrial applications. The chemical industry is a significant consumer of rock salt due to its use in the production of chlorine, a key ingredient in water treatment and disinfection. In agriculture, rock salt is employed as a de-icing agent and soil conditioner. Urban areas utilize it for de-icing roads and runways during winter.
Additionally, the oil & gas industry relies on rock salt for drilling operations and as a raw material in the production of inorganic compounds. Environmental concerns surrounding greenhouse gas emissions and water consumption have led to the exploration of sustainable practices. Mining officials are increasingly focusing on the extraction of rock salt from underground deposits to minimize surface disturbance and water usage. Moreover, the solar salt segment of the market is gaining traction as a renewable energy source for the production of salt through the evaporation of seawater. Regulations and approvals are essential for the mining and production of rock salt. In the chemical industry production, magnesium chloride is used in the manufacturing processes of PVC, while sodium fluorosilicate is a critical component in the production of phosphate fertilizers.
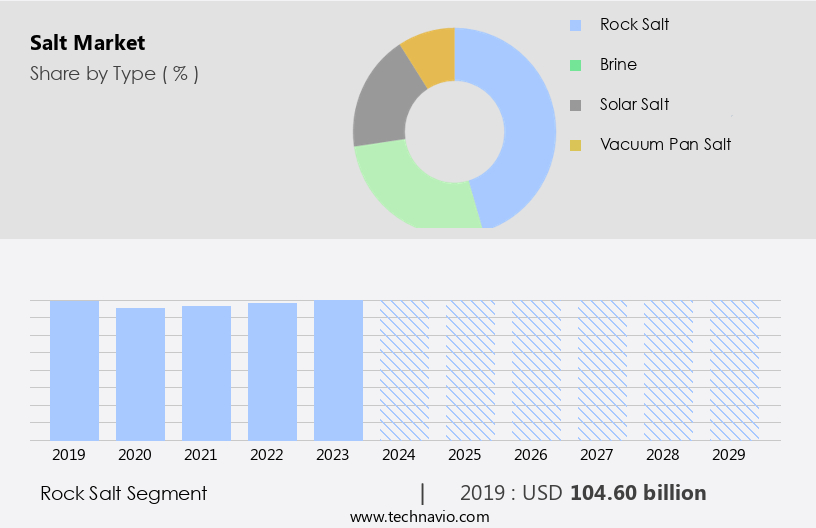
The Rock salt segment was valued at USD 104.60 billion in 2019 and showed a gradual increase during the forecast period. In the food and beverage industry, salt is a crucial ingredient in laundry care products, such as detergent and soap, as well as in food processing and food items. Governments worldwide are implementing strict guidelines to ensure the safe and sustainable extraction of this commodity. Waste management and material extraction are critical aspects of the mining process, with initiatives aimed at minimizing waste and maximizing efficiency. The global population's increasing demand for food and de-icing products, coupled with the need for water treatment, further fuels the market's growth. Market segmentation analysis reveals that the brine segment holds a significant share due to its extensive use in the chemical industry. The rock salt segment, on the other hand, is expected to maintain its dominance due to its wide range of applications. The rock the market is driven by its diverse applications across various industries and the increasing demand for sustainable practices. The focus on reducing water consumption and minimizing waste, along with the exploration of renewable energy sources, is shaping the market's future trends.
Regional Analysis
APAC is estimated to contribute 67% to the growth of the global market during the forecast period. Technavio's analysts have elaborately explained the regional trends and drivers that shape the market during the forecast period.
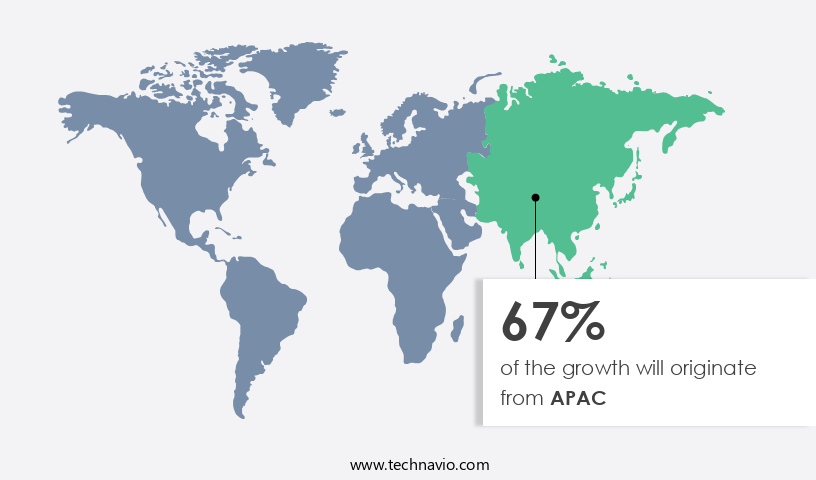
The market in Asia Pacific (APAC) is experiencing significant growth due to the increasing industrialization and rising demand for salt in developing countries like India and China. Salt is extensively used as a raw material in various industries, including chemical processing, pulp and paper, and leather, which are witnessing a in growth in this region. China, being the largest producer of salt in APAC, contributes significantly to the market's expansion. The chlor-alkali industry in China, in particular, is a major driver of the regional market's growth. However, the production and use of salt involve environmental concerns, such as water consumption and greenhouse gas emissions.
To mitigate these issues, sustainable practices and initiatives are being adopted, including the use of renewable energy sources like solar power for seawater evaporation in the solar salt segment. Mining officials are also implementing regulations to ensure the safe and responsible extraction of minerals from underground deposits, including salt. The brine segment of the market is also gaining traction due to its applications in water treatment and de-icing. The global population's increasing food consumption and the need for de-icing in urban areas further fuel the demand for salt. Governments and waste management companies are also exploring economic alternatives to traditional oil & gas sources by focusing on the production and utilization of salt as a commodity.
Despite these positive trends, challenges remain, including waste management and the need for approvals and licenses for mining and material extraction activities. Climate change and the rock salt segment's impact on sodium levels in water bodies are also areas of concern.
Market Dynamics
Our researchers analyzed the data with 2024 as the base year, along with the key drivers, trends, and challenges. A holistic analysis of drivers will help companies refine their marketing strategies to gain a competitive advantage.
What are the Salt market drivers leading to the rise in the adoption of Industry?
- The significant versatility of salt in various industrial applications serves as the primary market driver. Industrial salt plays a crucial role in numerous processes and industries, serving various purposes such as chemical processing, water treatment, and de-icing. The chemical processing sector is the primary consumer of salt, utilizing it as a key ingredient in the production of essential chemicals like soda ash, caustic soda, and chlorine. These chemicals are further employed in the manufacture of diverse industrial products, including solvents, alumina, and synthetic materials. The market is experiencing significant growth due to the escalating demand for salt in various industrial applications. The chemical processing industry is the major contributor to this expansion.
- Salt is indispensable in the production of a multitude of chemicals, which are subsequently used in the fabrication of a wide array of industrial goods. Moreover, environmental concerns have instigated the adoption of sustainable practices in the salt industry. Producers are focusing on minimizing greenhouse gas emissions and water consumption during the evaporation of seawater, a primary method for salt production. Inorganic compounds, derived from salt, are also being explored as alternatives to harmful chemicals in various industries. The market's growth is boosted by the increasing demand for industrial salt in regions with substantial mineral deposits and underground reserves. This commodity is indispensable in various industries, making it a vital component in numerous applications.
What are the Salt market trends shaping the Industry?
- The solar evaporation process for increasing salt production is a noteworthy market trend in APAC. This sustainable method is gaining popularity due to its environmental benefits and potential for increased yield. The solar salt segment of the market is experiencing significant growth, particularly in the Asia Pacific region. Mining officials in countries like India and China are increasingly turning to the solar evaporation process for rock salt production due to the abundance of salty lakes and long coastlines. This traditional method of salt production, which utilizes the natural evaporation of seawater or brine, is favored by the region's warm climates and steady winds. The evaporation rate exceeds the precipitation rate in these areas, enabling the crystallization of salt.
- Furthermore, the solar salt production process aligns with global initiatives to reduce water pollution and promote the use of renewable energy sources. Market segmentation analysis reveals that the solar salt segment is gaining traction in water treatment applications, de-icing, and agriculture. As the global population continues to grow, the demand for salt is expected to increase, making the solar salt segment a promising investment opportunity.
How does Salt market faces challenges face during its growth?
- The food industry faces significant challenges from product recalls, which pose a substantial risk to growth and consumer confidence. In the food industry, salt is an indispensable additive due to its various properties and functionalities. As a preservative, salt extends the shelf life of food products, while enhancing texture and flavor. Moreover, salt is a significant source of sodium, an essential nutrient. Consequently, salt is incorporated into numerous food items, including bakery goods, cereals, snacks, dressings, dairy products, and meat products. However, food products failing to meet the established quality standards, particularly in terms of salt content, may result in recalls. Recalls can significantly damage a company's brand reputation, sales, and growth, imposing operational and financial burdens. The market witnesses dynamic trends, with a focus on efficient source analysis, waste management, and production processes to minimize waste and ensure product quality.
- Chlorine, an economic alternative to iodine for salt production, has gained popularity due to its cost-effectiveness and environmental benefits. Governments worldwide have implemented regulations to monitor and manage salt production and consumption, particularly in urban areas, to address health concerns. The brine segment, a byproduct of salt production, is increasingly being explored for its potential use in various industries, including oil & gas and waste management.
Exclusive Customer Landscape
The salt market forecasting report includes the adoption lifecycle of the market, covering from the innovator's stage to the laggard's stage. It focuses on adoption rates in different regions based on penetration. Furthermore, the salt market report also includes key purchase criteria and drivers of price sensitivity to help companies evaluate and develop their market growth analysis strategies.
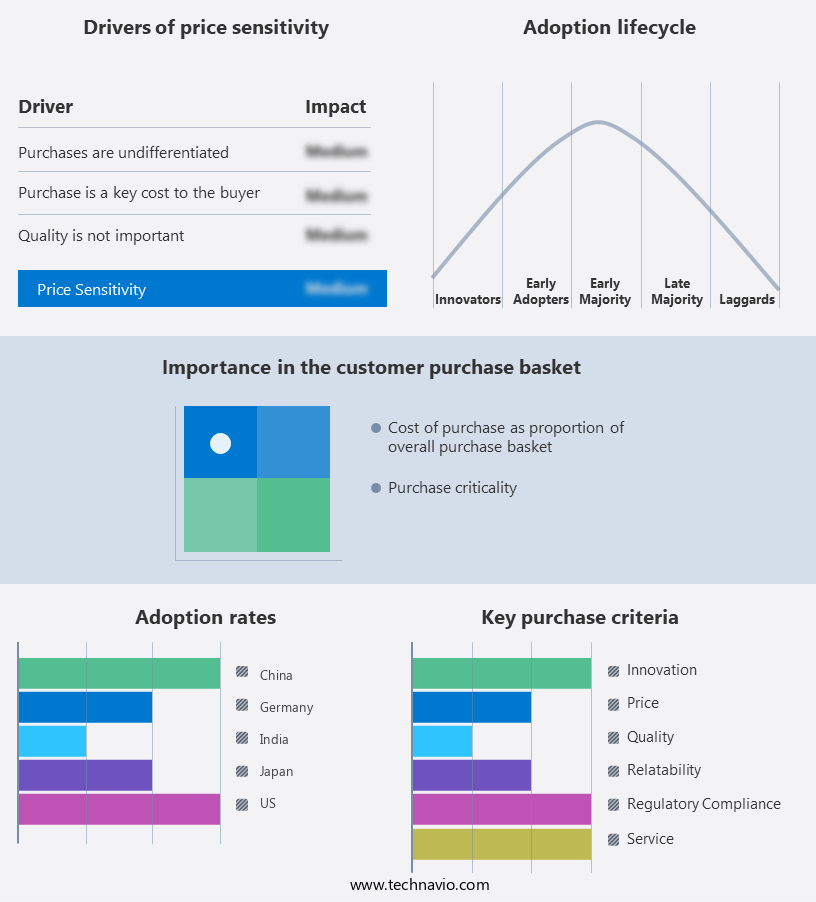
Customer Landscape
Key Companies & Market Insights
Companies are implementing various strategies, such as strategic alliances, salt market forecast, partnerships, mergers and acquisitions, geographical expansion, and product/service launches, to enhance their presence in the industry.
Atisale SpA - This company specializes in providing a selection of premium salts, including Fior di Mare and Salino Grosso.
The industry research and growth report includes detailed analyses of the competitive landscape of the market and information about key companies, including:
- Atisale SpA
- Besto Salt Co.
- BRAS DEL PORT S.A
- Cargill Inc.
- Ciech SA
- Compass Minerals International Inc.
- INEOS Group Holdings S.A.
- Kopalnia Soli w Klodawie
- KS Aktiengesellschaft
- Mitsui and Co. Ltd.
- Nouryon Chemicals Holding B.V.
- Rio Tinto Ltd.
- Salinen Austria AG
- SAN FRANCISCO SALT CO.
- Solvay SA
- Stone Canyon Industries Holdings Inc.
- Sudwestdeutsche Salzwerke AG
- Tata Chemicals Ltd.
- Tate and Lyle PLC
- Wacker Chemie AG
Qualitative and quantitative analysis of companies has been conducted to help clients understand the wider business environment as well as the strengths and weaknesses of key industry players. Data is qualitatively analyzed to categorize companies as pure play, category-focused, industry-focused, and diversified; it is quantitatively analyzed to categorize companies as dominant, leading, strong, tentative, and weak.
Recent Development and News in Salt Market
- In February 2024, Danish company Danish Salt Company (DSC) introduced a new line of organic and natural salt brands, catering to the growing demand for healthier food options. This strategic move aimed to expand their product portfolio and capture a larger market share in the health-conscious consumer segment (Danish Salt Company Press Release, 2024).
- In October 2024, K+S AG, a leading international miner and salt producer, completed the acquisition of Compass Minerals' Salt business. This deal strengthened K+S's position in the North American market and expanded its product portfolio, enabling the company to offer a broader range of salt solutions to its customers (Bloomberg, 2024).
- In March 2025, the European Commission approved a new regulation to reduce the maximum permitted levels of impurities in table salt. The new regulation aims to improve food safety and consumer protection, with the new standards expected to be implemented by 2027 (European Commission Press Release, 2025).
Research Analyst Overview
The market continues to evolve, shaped by various dynamic factors across multiple sectors. Mining officials oversee the extraction of rock salt from underground deposits, a crucial commodity with applications ranging from agriculture to water treatment. However, this process raises environmental concerns, particularly regarding water pollution. The global population's increasing demand for food and water necessitates innovative solutions. Initiatives focusing on market segmentation analysis and sustainable practices are gaining traction. In the water treatment sector, brine extraction and solar salt segment offer economic alternatives to traditional methods. In the mining sector, solution mining and vacuum pan technology are increasingly used to extract high-purity salts, including sodium chloride, potassium chloride, and calcium hypochlorite, for various applications, including laundry care products, meat processing, and solar pools. Renewable energy sources, such as solar and wind, are driving advancements in seawater evaporation for salt production.
Safety remains a priority in salt mining and processing activities, with regulations and approvals ensuring compliance. The de-icing segment, a significant consumer of rock salt, faces growing pressure to adopt more eco-friendly alternatives. The brine segment, another major application, is undergoing transformation with advancements in waste management and quality control. Natural resources, including sodium and chlorine, are integral to various industries, from oil & gas to urban areas. As climate change continues to impact natural resources, the focus on sustainable practices and efficient material extraction becomes increasingly important. The market's continuous dynamism underscores the need for ongoing source analysis and adaptive production strategies. Additionally, the healthcare sector's demand for intravenous formulas, contact solutions, and lubricants, as well as the agriculture industry's need for salt for agricultural applications, further fuels market growth.
Dive into Technavio's strong research methodology, blending expert interviews, extensive data synthesis, and validated models for unparalleled Salt Market insights. See full methodology.
|
Market Scope |
|
|
Report Coverage |
Details |
|
Page number |
228 |
|
Base year |
2024 |
|
Historic period |
2019-2023 |
|
Forecast period |
2025-2029 |
|
Growth momentum & CAGR |
Accelerate at a CAGR of 2.3% |
|
Market growth 2025-2029 |
USD 33 billion |
|
Market structure |
Fragmented |
|
YoY growth 2024-2025(%) |
2.2 |
|
Key countries |
China, US, India, Japan, Germany, Canada, South Korea, Australia, UK, and France |
|
Competitive landscape |
Leading Companies, Market Positioning of Companies, Competitive Strategies, and Industry Risks |
What are the Key Data Covered in this Salt Market Research and Growth Report?
- CAGR of the Salt industry during the forecast period
- Detailed information on factors that will drive the growth and forecasting between 2025 and 2029
- Precise estimation of the size of the market and its contribution of the industry in focus to the parent market
- Accurate predictions about upcoming growth and trends and changes in consumer behaviour
- Growth of the market across APAC, North America, Europe, Middle East and Africa, and South America
- Thorough analysis of the market's competitive landscape and detailed information about companies
- Comprehensive analysis of factors that will challenge the salt market growth of industry companies
We can help! Our analysts can customize this salt market research report to meet your requirements.
 RIA -
RIA - 
