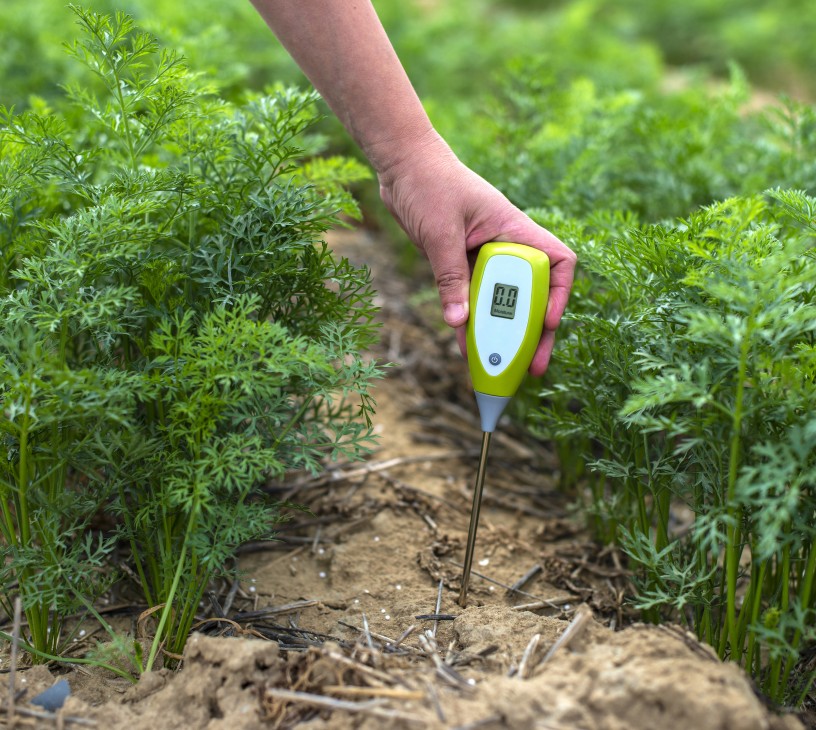
Soil Moisture Sensor Market Size 2025-2029
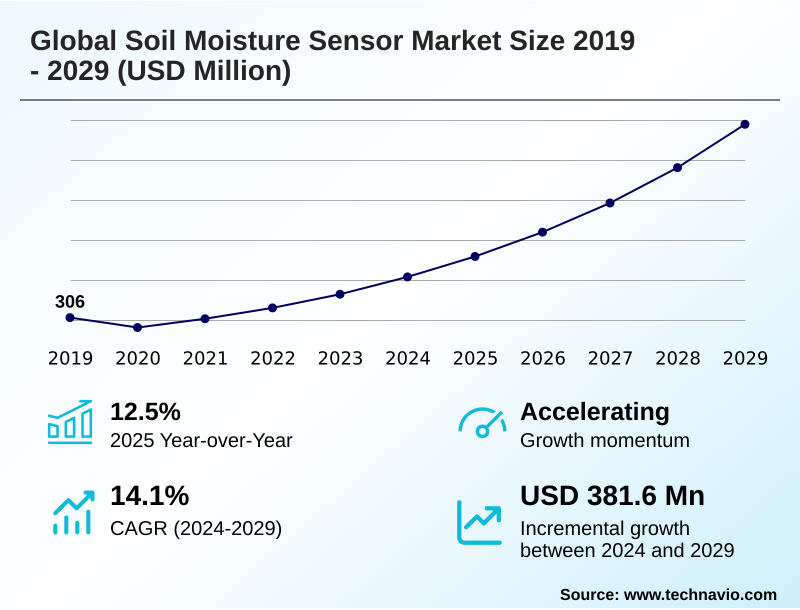
The soil moisture sensor market size is valued to increase by USD 381.6 million, at a CAGR of 14.1% from 2024 to 2029. Water scarcity and imperative for efficient management will drive the soil moisture sensor market.
Major Market Trends & Insights
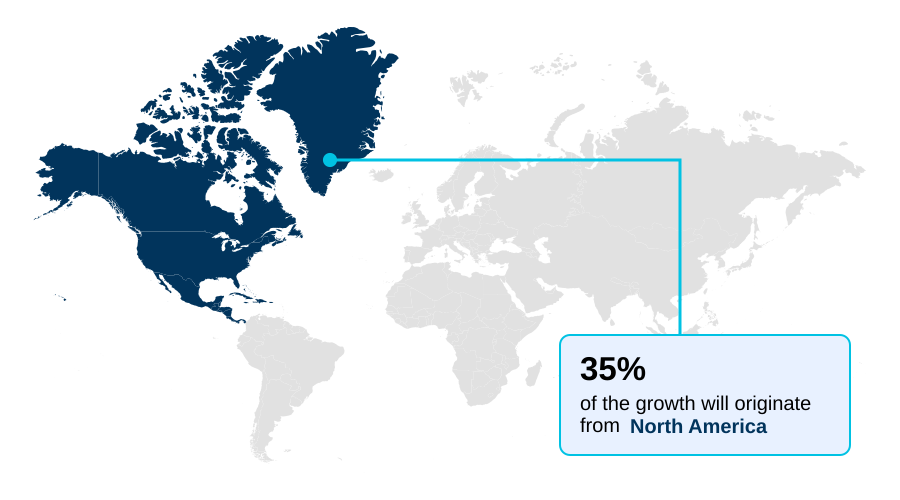
- North America dominated the market and accounted for a 34.6% growth during the forecast period.
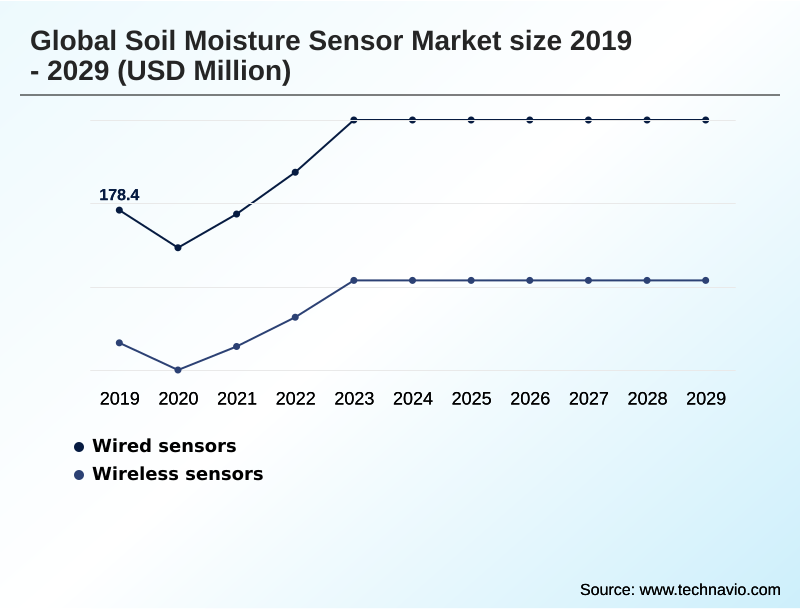
- By Connectivity - Wired sensors segment was valued at USD 212.9 million in 2023
- By Type - Digital segment accounted for the largest market revenue share in 2023
Market Size & Forecast
- Market Opportunities: USD 483.3 million
- Market Future Opportunities: USD 381.6 million
- CAGR from 2024 to 2029 : 14.1%
Market Summary
- The soil moisture sensor market is foundational to modern resource management, driven by the critical need for efficient water use in agriculture and environmental stewardship. Adherence to sustainable farming practices and the adoption of smart farming technology are accelerating the deployment of these devices.
- Innovations focus on integrating sensor networks with IoT in agriculture platforms, enabling real-time data analysis for precision irrigation scheduling. A key trend involves the use of advanced analytics to interpret data on volumetric water content and soil electrical conductivity, optimizing inputs and improving crop resilience.
- For instance, a large-scale agricultural enterprise can deploy a wireless soil sensor network to monitor diverse field zones, using the data to automate irrigation. This approach not only conserves water but also ensures uniform crop quality, directly supporting supply chain reliability.
- However, challenges such as the initial investment and the technical expertise required for data interpretation can temper adoption rates, particularly among smaller operations. The market continues to evolve toward more user-friendly, integrated systems that provide clear, actionable insights.
What will be the Size of the Soil Moisture Sensor Market during the forecast period?
Get Key Insights on Market Forecast (PDF) Get Free Sample
How is the Soil Moisture Sensor Market Segmented?
The soil moisture sensor industry research report provides comprehensive data (region-wise segment analysis), with forecasts and estimates in "USD million" for the period 2025-2029, as well as historical data from 2019-2023 for the following segments.
- Connectivity
- Wired sensors
- Wireless sensors
- Type
- Digital
- Analog
- Application
- Agriculture
- Residential
- Construction and mining
- Forestry
- Others
- Geography
- North America
- US
- Canada
- Mexico
- APAC
- China
- India
- Japan
- Europe
- Germany
- France
- UK
- Middle East and Africa
- South Africa
- Saudi Arabia
- UAE
- South America
- Brazil
- Argentina
- Colombia
- Rest of World (ROW)
- North America
By Connectivity Insights
The wired sensors segment is estimated to witness significant growth during the forecast period.
The wired sensors segment represents the foundational portion of the soil moisture sensor market, commanding a majority share of over 54% in 2024.
These systems are preferred for applications demanding high data integrity, such as long-term environmental monitoring systems and geotechnical engineering applications.
The direct physical connection of a tdr soil moisture sensor ensures a stable data pathway, making it a reliable choice for automated irrigation control.
This inherent stability supports precise fertigation management system operations and is crucial for achieving consistent volumetric water content readings.
As a cornerstone of climate smart agriculture, wired technology's robustness and low maintenance make it a cost-effective solution for permanent installations focused on agricultural water management and sustainable farming practices.
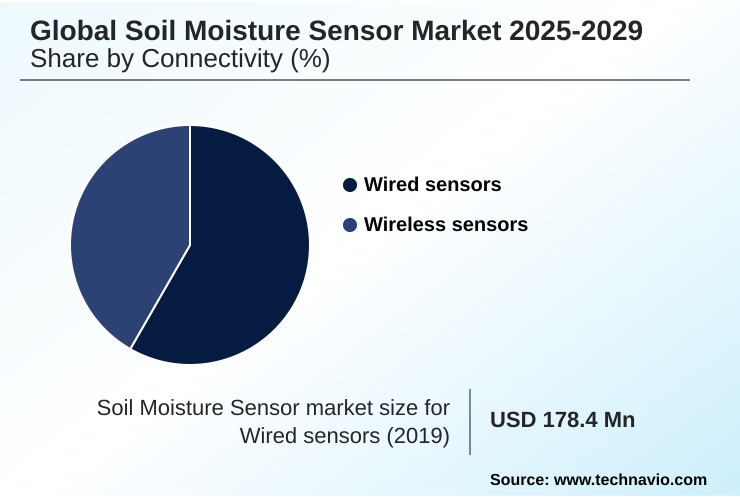
The Wired sensors segment was valued at USD 212.9 million in 2023 and showed a gradual increase during the forecast period.
Regional Analysis
North America is estimated to contribute 34.6% to the growth of the global market during the forecast period.Technavio’s analysts have elaborately explained the regional trends and drivers that shape the market during the forecast period.
See How Soil Moisture Sensor Market Demand is Rising in North America Get Free Sample
The geographic landscape is led by North America and APAC, which collectively account for over 67% of the market. In North America, adoption of precision irrigation scheduling is driven by water scarcity and large-scale commercial farming.
Meanwhile, APAC's growth is fueled by government food security initiatives and the need to modernize its vast agricultural sector. In Europe, stringent environmental regulations are a primary catalyst for implementing water scarcity solutions.
Across these regions, the use of a digital soil moisture sensor is becoming standard in efforts to improve efficiency, with some applications achieving water savings of up to 30%.
This demonstrates the technology's critical role in both advanced and developing agricultural economies. The deployment of a resistive soil moisture sensor and other low-cost options is expanding access to these vital tools.
Market Dynamics
Our researchers analyzed the data with 2024 as the base year, along with the key drivers, trends, and challenges. A holistic analysis of drivers will help companies refine their marketing strategies to gain a competitive advantage.
- Successfully leveraging sensor technology requires understanding the nuances of how to calibrate a soil moisture sensor and mastering soil moisture sensor data interpretation. The debate over time domain reflectometry vs capacitance sensors continues, with choices depending on specific accuracy and budget needs.
- For high-value crops, selecting the best soil moisture sensor for vineyards or orchards is a critical decision affecting quality and yield. As operations scale, integrating soil sensors with IoT platforms becomes essential for centralized control. This transition often involves a wireless soil sensor network cost analysis to justify the investment.
- Beyond basic moisture, measuring soil salinity with sensors helps manage crop health in arid regions. Practical considerations, such as choosing a soil moisture sensor for clay soil and ensuring correct soil sensor placement for optimal reading, are vital for data accuracy. For those exploring entry-level options, a diy soil moisture sensor arduino guide provides a gateway to learning.
- In specialized fields, the use of soil moisture sensors in forestry research and for geotechnical slope stability monitoring highlights their versatility. Advanced applications include using remote soil moisture monitoring systems and lpwan technologies for agricultural sensors to cover vast areas. Understanding soil water potential measurement techniques is key for research-grade applications.
- Ultimately, the roi of soil moisture monitoring systems is realized through improved resource management, such as preventing nutrient leaching with sensors, managing crop water stress with sensors, and enabling automated irrigation systems for landscaping, where efficiency gains often surpass those of traditional methods by a factor of two.
What are the key market drivers leading to the rise in the adoption of Soil Moisture Sensor Industry?
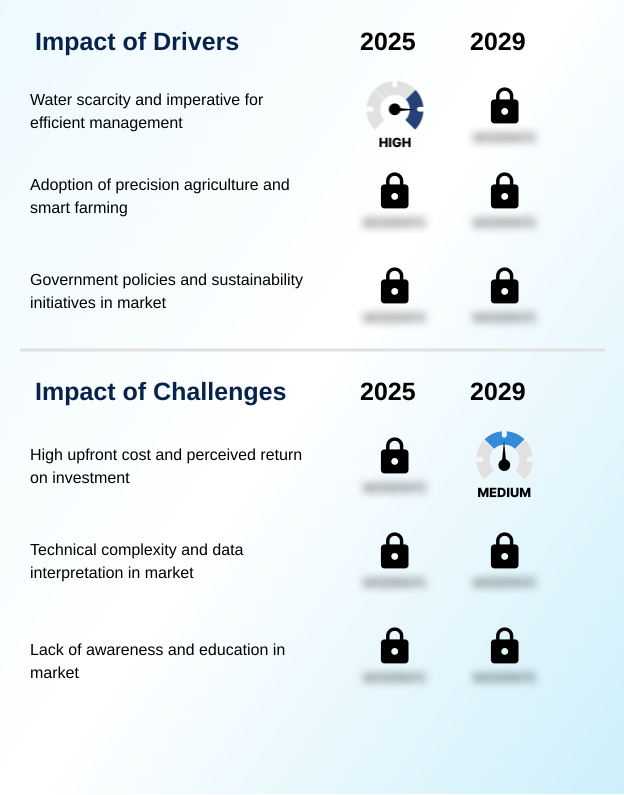
- Growing water scarcity and the corresponding imperative for efficient resource management represent a key driver for the market.
- The primary market driver is the escalating pressure on freshwater resources, compelling a shift toward more efficient water conservation methods.
- The adoption of precision agriculture, enabled by technologies measuring the dielectric constant measurement and field capacity measurement, is critical for optimizing farm operations. In water-stressed regions, implementing these systems has been shown to improve crop yields by up to 15%.
- Government policies and sustainability initiatives, such as those promoting climate-smart agriculture, provide strong incentives for adoption. These programs encourage investment in advanced technologies for agricultural water management, helping to mitigate the risks of water shortages.
- The clear return on investment, realized through direct water savings and reduced energy costs, makes soil sensors a cornerstone of modern, sustainable farming and a key tool in global food security initiatives.
What are the market trends shaping the Soil Moisture Sensor Industry?
- A key market trend is the increasing integration of Internet of Things devices with artificial intelligence and advanced analytics platforms. This convergence is shifting focus from simple data collection to providing predictive, actionable insights for resource management.
- Key market trends revolve around the integration of AI with remote sensing technologies and IoT platforms. The proliferation of low-power wide-area networks (LPWAN) is a transformative trend in data driven agriculture, enabling devices to operate for over five years without maintenance, a significant improvement over previous wireless technologies. This connectivity underpins the shift toward more intelligent environmental monitoring.
- Advanced analytics platforms now combine data from a soil temperature monitoring network with meteorological forecasts to generate predictive insights, enhancing wildfire risk assessment. This fusion of data sources improves decision-making, with some models improving accuracy by as much as 25%.
- Furthermore, these trends support a move from reactive to proactive management in golf course water management, where precise control is paramount for maintaining turf quality while adhering to sustainability goals.
What challenges does the Soil Moisture Sensor Industry face during its growth?
- The high upfront cost of advanced systems and the perceived difficulty in quantifying an immediate return on investment remain key challenges affecting industry growth.
- A primary market challenge is the high upfront cost, with advanced systems requiring a capital outlay that can be 3-5 times higher than traditional irrigation controls.
- This barrier is compounded by the technical complexity of data interpretation, which can increase implementation time by up to 40% due to the need for specialized training on soil water potential and permanent wilting point concepts.
- Many potential users, particularly in small-scale operations, lack awareness of the long-term benefits, such as improved crop water stress index and optimized landscape irrigation efficiency. The difficulty in quantifying a clear return on investment, which can take up to two growing seasons to materialize, further restrains market penetration.
- Overcoming these hurdles requires a focus on developing more affordable, user-friendly solutions and educating end-users on the value of precise soil salinity measurement and sports turf management.
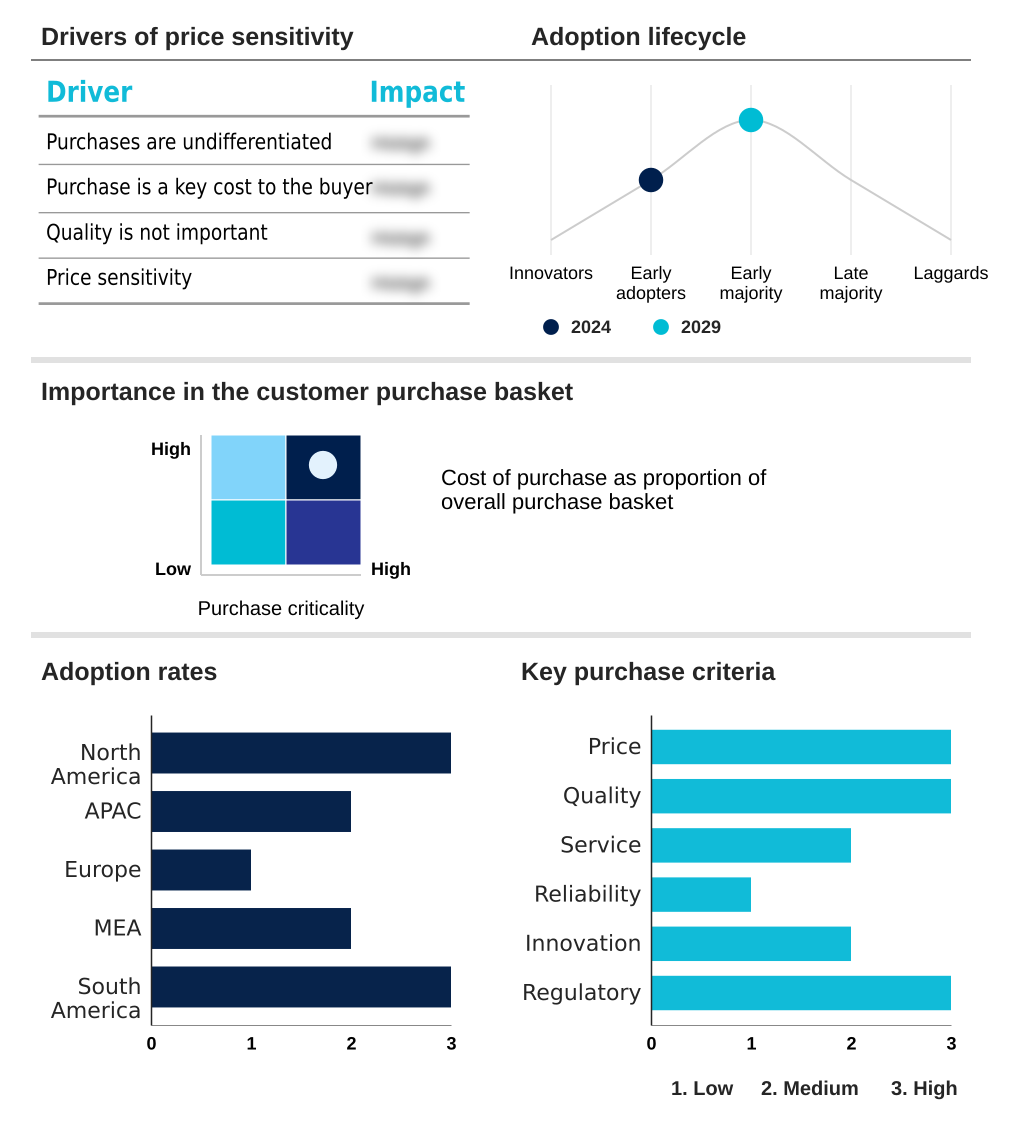
Exclusive Technavio Analysis on Customer Landscape
The soil moisture sensor market forecasting report includes the adoption lifecycle of the market, covering from the innovator’s stage to the laggard’s stage. It focuses on adoption rates in different regions based on penetration. Furthermore, the soil moisture sensor market report also includes key purchase criteria and drivers of price sensitivity to help companies evaluate and develop their market growth analysis strategies.
Customer Landscape of Soil Moisture Sensor Industry
Competitive Landscape
Companies are implementing various strategies, such as strategic alliances, soil moisture sensor market forecast, partnerships, mergers and acquisitions, geographical expansion, and product/service launches, to enhance their presence in the industry.
Acclima Inc. - Delivers cutting-edge, digital TDR soil moisture sensors, enabling advancements in water and fertilizer conservation for agricultural research.
The industry research and growth report includes detailed analyses of the competitive landscape of the market and information about key companies, including:
- Acclima Inc.
- Campbell Scientific Inc.
- CropX Technologies Ltd.
- Delta-T Devices Ltd.
- EarthScout LLC
- HydroPoint Data Systems Inc.
- IMKO Micromodultechnik GmbH
- Irrometer Co. Inc.
- METER Group Inc.
- OTT Hydromet GmbH
- Rain Bird Corp.
- SDEC France
- Sensoterra BV
- Sentek Pty Ltd
- Spectrum Technologies Inc.
- Stevens Water Monitoring Systems Inc.
- The Toro Co.
- Trellis Inc.
- Vegetronix Inc.
Qualitative and quantitative analysis of companies has been conducted to help clients understand the wider business environment as well as the strengths and weaknesses of key industry players. Data is qualitatively analyzed to categorize companies as pure play, category-focused, industry-focused, and diversified; it is quantitatively analyzed to categorize companies as dominant, leading, strong, tentative, and weak.
Recent Development and News in Soil moisture sensor market
- In August 2024, researchers published a study detailing the development of an automated drip irrigation module integrating digital capacitive soil moisture sensors with the Arduino platform, demonstrating high accuracy.
- In August 2024, Michigan State University gained attention for its Low Cost Irrigation Monitoring System (LOCOMOS), designed to provide precise irrigation recommendations and make data-driven water management more accessible.
- In October 2024, the United States Department of Agriculture announced a historic USD 1.5 billion investment in partner-driven conservation projects, many focused on addressing water conservation and drought pressures.
- In May 2025, draft plans for the European Union's next Common Agricultural Policy were reported to include intentions for new subsidies for farmers investing in technologies that reduce water waste, such as precision irrigation tools.
Dive into Technavio’s robust research methodology, blending expert interviews, extensive data synthesis, and validated models for unparalleled Soil Moisture Sensor Market insights. See full methodology.
| Market Scope | |
|---|---|
| Page number | 296 |
| Base year | 2024 |
| Historic period | 2019-2023 |
| Forecast period | 2025-2029 |
| Growth momentum & CAGR | Accelerate at a CAGR of 14.1% |
| Market growth 2025-2029 | USD 381.6 million |
| Market structure | Fragmented |
| YoY growth 2024-2025(%) | 12.5% |
| Key countries | US, Canada, Mexico, China, India, Japan, South Korea, Australia, Indonesia, Germany, France, UK, Italy, The Netherlands, Spain, South Africa, Saudi Arabia, UAE, Israel, Turkey, Brazil, Argentina and Colombia |
| Competitive landscape | Leading Companies, Market Positioning of Companies, Competitive Strategies, and Industry Risks |
Research Analyst Overview
- The soil moisture sensor market is driven by the imperative to optimize water resources through precise measurement and control. Central to this is the application of soil science principles to interpret data from technologies like time domain reflectometry and capacitive soil moisture sensors. These devices provide critical metrics, including volumetric water content, soil electrical conductivity, and soil water potential.
- While wired systems, often featuring a tdr soil moisture sensor, still account for over 54% of installations due to their reliability, the trend is toward integrated wireless soil sensor networks. The fusion of sensor data with remote sensing platforms is creating a boardroom-level conversation around capital budgeting for smart agriculture.
- For instance, demonstrating compliance with regional water usage regulations through verifiable data from these systems can unlock significant subsidies, directly impacting financial strategy.
- Effective root zone water management, guided by digital soil moisture sensor and soil temperature monitoring, is essential for preventing nutrient leaching and improving yields, making these tools indispensable for modern fertigation management systems and even geotechnical engineering applications.
What are the Key Data Covered in this Soil Moisture Sensor Market Research and Growth Report?
-
What is the expected growth of the Soil Moisture Sensor Market between 2025 and 2029?
-
USD 381.6 million, at a CAGR of 14.1%
-
-
What segmentation does the market report cover?
-
The report is segmented by Connectivity (Wired sensors, and Wireless sensors), Type (Digital, and Analog), Application (Agriculture, Residential, Construction and mining, Forestry, and Others) and Geography (North America, APAC, Europe, Middle East and Africa, South America)
-
-
Which regions are analyzed in the report?
-
North America, APAC, Europe, Middle East and Africa and South America
-
-
What are the key growth drivers and market challenges?
-
Water scarcity and imperative for efficient management, High upfront cost and perceived return on investment
-
-
Who are the major players in the Soil Moisture Sensor Market?
-
Acclima Inc., Campbell Scientific Inc., CropX Technologies Ltd., Delta-T Devices Ltd., EarthScout LLC, HydroPoint Data Systems Inc., IMKO Micromodultechnik GmbH, Irrometer Co. Inc., METER Group Inc., OTT Hydromet GmbH, Rain Bird Corp., SDEC France, Sensoterra BV, Sentek Pty Ltd, Spectrum Technologies Inc., Stevens Water Monitoring Systems Inc., The Toro Co., Trellis Inc. and Vegetronix Inc.
-
Market Research Insights
- Market dynamics are shaped by a push toward greater operational efficiency and sustainability, with adoption rates for climate smart agriculture solutions differing significantly between large-scale enterprises and smallholder farms. The implementation of water conservation methods, driven by sensor data, has demonstrated the potential for water savings of up to 30% in certain crops, improving the business case for investment.
- However, adoption is not uniform, as wired systems still outnumber wireless deployments by a notable margin in permanent installations. The focus on food security initiatives is compelling governmental and non-governmental organizations to support affordable data driven agriculture technologies.
- As part of broader environmental monitoring systems, these sensors provide crucial data that supports regulatory compliance and enhances landscape irrigation efficiency, making them central to modern agricultural water management strategies.
We can help! Our analysts can customize this soil moisture sensor market research report to meet your requirements.
 RIA -
RIA - 
