
Data Logger Market Size 2025-2029
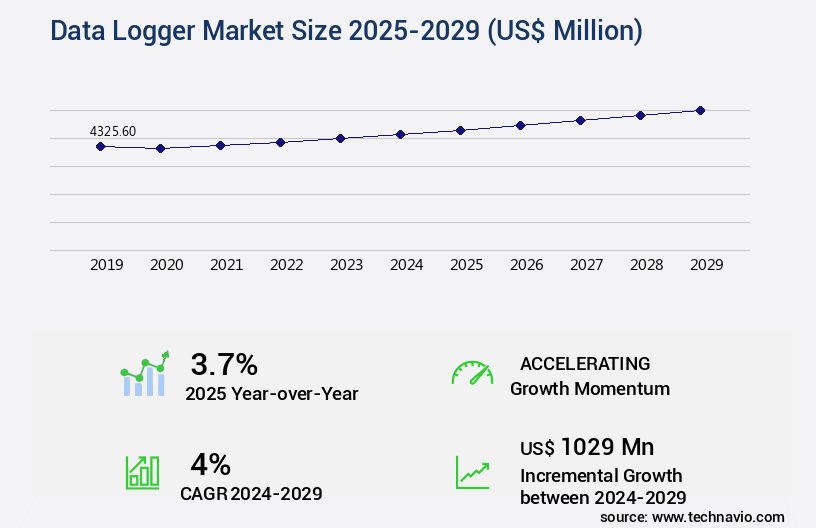
The data logger market size is valued to increase USD 1.03 billion, at a CAGR of 4% from 2024 to 2029. Increasing demand for test, measurement, and control solutions will drive the data logger market.
Major Market Trends & Insights
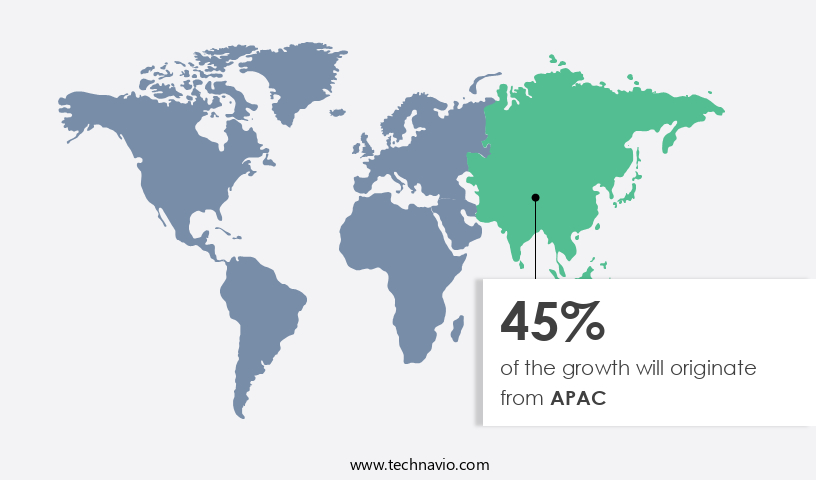
- APAC dominated the market and accounted for a 45% growth during the forecast period.
- By Type - Stand-alone systems segment was valued at USD 2.59 billion in 2023
- By Measurement - Pressure segment accounted for the largest market revenue share in 2023
Market Size & Forecast
- Market Opportunities: 35.07 million
- Market Future Opportunities: USD 1029.00 million
- CAGR : 4%
- APAC: Largest market in 2023
Market Summary
- The market represents a dynamic and continually evolving landscape, driven by increasing demands for test, measurement, and control solutions across various industries. Core technologies, such as wireless communication and cloud computing, are transforming data logging applications, enabling real-time monitoring and analysis. Service types, including installation, integration, and maintenance, are gaining traction as businesses seek customized automation solutions. Regulations, such as the European Union's GDPR and the US's HIPAA, are shaping market growth by mandating data security and privacy. Regional markets, like North America and Europe, account for significant market share due to their mature economies and stringent regulations.
- However, emerging markets in Asia Pacific and Latin America present substantial opportunities, fueled by growing industrialization and infrastructure development. Despite these opportunities, challenges persist, including high capital investments for software solutions and the need for standardization and interoperability. According to recent studies, the market is expected to grow robustly, with over 20% of industrial enterprises adopting data loggers in their operations. As related markets such as IoT and industrial automation continue to expand, the market is poised for continued growth in the coming years.
What will be the Size of the Data Logger Market during the forecast period?
Get Key Insights on Market Forecast (PDF) Request Free Sample
How is the Data Logger Market Segmented and what are the key trends of market segmentation?
The data logger industry research report provides comprehensive data (region-wise segment analysis), with forecasts and estimates in "USD million" for the period 2025-2029, as well as historical data from 2019-2023 for the following segments.
- Type
- Stand-alone systems
- AS/M
- Measurement
- Pressure
- Power
- Temperature
- Humidity
- Others
- Channel
- Single-channel data loggers
- Multi-channel data loggers
- End-user
- Manufacturing
- Energy and power
- Oil and gas
- Automotive
- Geography
- North America
- US
- Canada
- Europe
- France
- Germany
- UK
- APAC
- China
- India
- Japan
- South Korea
- Taiwan
- Rest of World (ROW)
- North America
By Type Insights
The stand-alone systems segment is estimated to witness significant growth during the forecast period.
The market encompasses various applications, with stand-alone systems holding the largest market share. These systems, which include data loggers for measuring pressure, temperature, voltage, and humidity, are extensively utilized in sectors such as food and beverage, automotive, oil and gas, industrial, and water and wastewater management. Stand-alone data loggers facilitate record maintenance and process optimization through their use in testing, management, and tracking functions. In terms of future growth, wireless communication protocols, data integrity checks, and remote monitoring systems are driving the market expansion. These advancements enable real-time data processing, predictive maintenance, and calibration procedures, which are essential for industries like healthcare, precision agriculture, and smart grids.
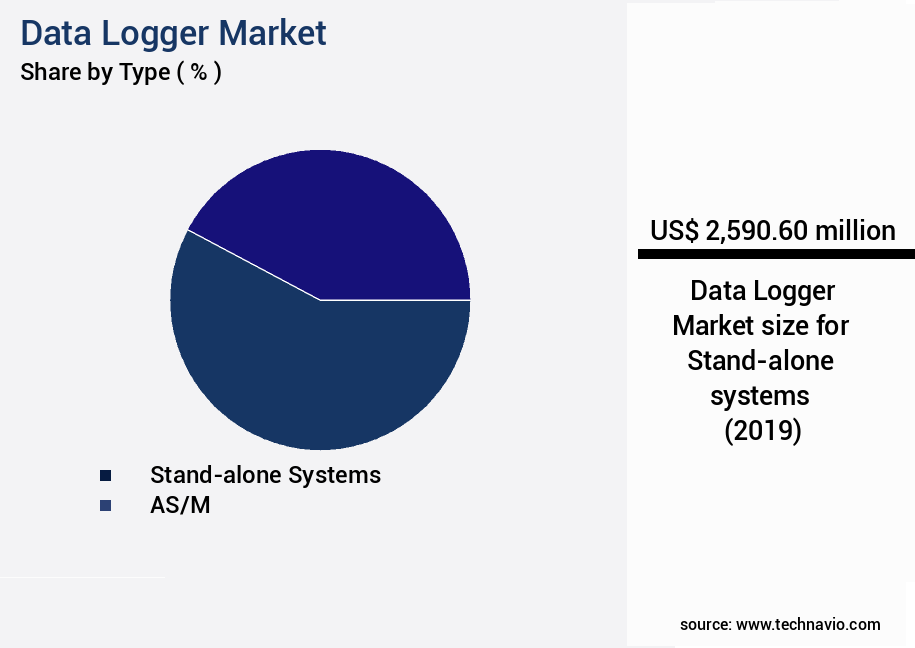
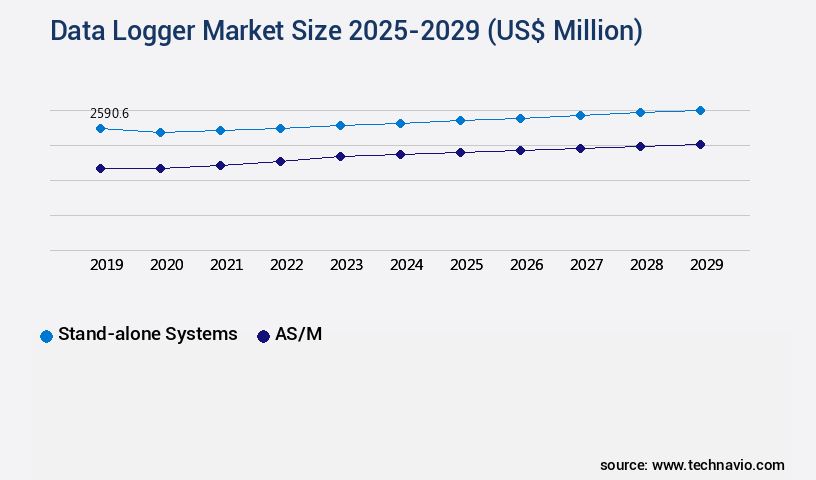
The Stand-alone systems segment was valued at USD 2.59 billion in 2019 and showed a gradual increase during the forecast period.
Battery life optimization, data redundancy, and environmental monitoring contribute to the market's growth. Moreover, the integration of data logging software, data visualization tools, and cloud data storage enhances the market's potential. Security protocols, signal processing techniques, and machine learning algorithms further strengthen the market's position. The market is expected to grow significantly in areas like IoT applications, communication bandwidth, network topology, system integration, and sensor accuracy. Currently, stand-alone data loggers account for approximately 60% of the market share, with a projected increase of 18% in adoption. Furthermore, the market is anticipated to expand by 22% in the next five years, driven by the integration of advanced technologies and the growing need for data-driven decision-making across industries.
Regional Analysis
APAC is estimated to contribute 45% to the growth of the global market during the forecast period. Technavio's analysts have elaborately explained the regional trends and drivers that shape the market during the forecast period.
See How Data Logger Market Demand is Rising in APAC Request Free Sample
The market in APAC is the largest segment in 2024, accounting for over half of the global market share. China, a significant hub for outsourced production, drives much of this growth due to its low labor costs. However, rising labor and wage rates are compelling manufacturers to automate processes. APAC's market share is predicted to remain stable, with China continuing to dominate.
Three key trends underpinning this market dynamics include the increasing adoption of IoT technology, the growing demand for real-time data monitoring, and the expanding applications in various industries, such as healthcare, agriculture, and energy. These trends are expected to fuel the market's growth and maintain APAC's market leadership.
Market Dynamics
Our researchers analyzed the data with 2024 as the base year, along with the key drivers, trends, and challenges. A holistic analysis of drivers will help companies refine their marketing strategies to gain a competitive advantage.
The market is experiencing significant growth due to the increasing demand for real-time data monitoring and predictive maintenance in various industries. Sensor network deployment strategies are a crucial aspect of data logging systems, with wireless sensor networks gaining popularity due to their flexibility and scalability. However, the choice of wireless sensor network protocols can significantly impact system performance, with comparisons showing that LoRaWAN outperforms Zigbee in terms of range and battery life. Data logger system integration challenges are another key consideration, with efficient data storage solutions for IoT being essential to handle the vast amounts of data generated. Cloud-based data logger system architecture is a popular solution, offering scalability and remote data access.
However, data quality in remote monitoring is a persistent issue, with advanced data analytics for industrial automation and high-throughput data processing algorithms being used to improve accuracy. Security vulnerabilities are a significant concern in data logger systems, with robust implementation of network security protocols essential to prevent unauthorized access. Energy-efficient data acquisition techniques are also crucial to minimize power consumption and extend battery life. Remote data logger system maintenance is another challenge, with effective sensor network monitoring and advanced data visualization dashboard design being important tools to optimize system performance. A recent study revealed that LoRaWAN-based data logger systems outperform Zigbee-based systems by up to 50% in terms of data transmission range.
This comparison highlights the importance of selecting the appropriate wireless sensor network protocol for specific use cases to maximize system efficiency and performance. Overall, the market is dynamic and evolving, with a focus on improving data quality, ensuring security, and implementing energy-efficient and scalable solutions.
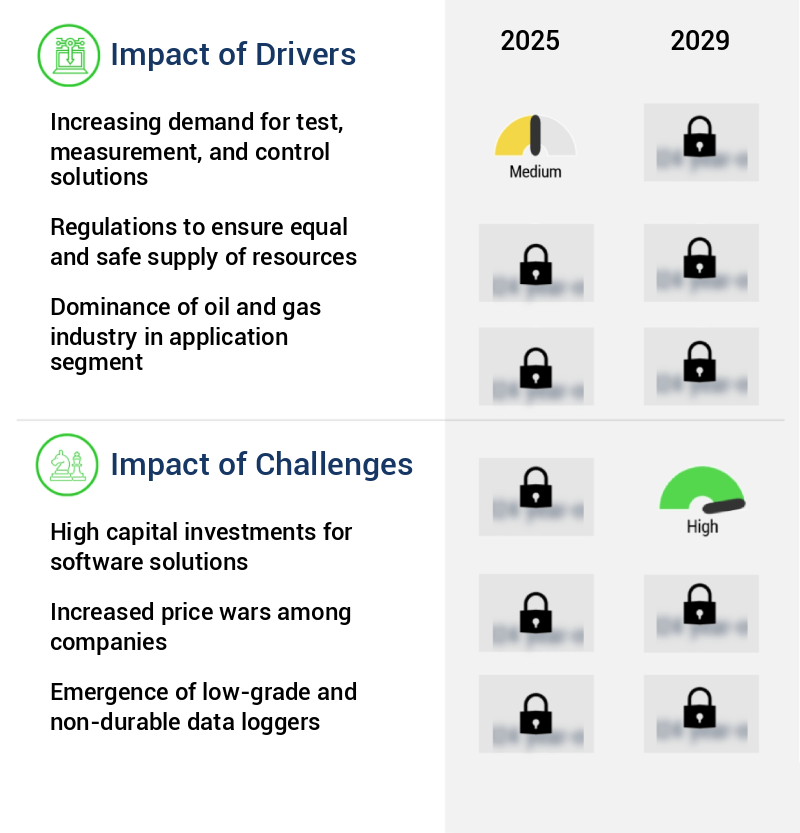
What are the key market drivers leading to the rise in the adoption of Data Logger Industry?
- The market is propelled forward by the escalating demand for test, measurement, and control solutions. These solutions are essential for ensuring accuracy, efficiency, and compliance in various industries, making them indispensable in today's technological landscape.
- In today's business landscape, the significance of automation systems and modules has grown exponentially, leading to a heightened demand for data loggers. These essential components enable automated systems to function effectively by recording and transmitting data from various measurement sensors. The role of data loggers in automation can be categorized into testing, measuring, and controlling functions. For instance, maintaining a consistent temperature in a cold storage facility necessitates the integration of data loggers with automated systems, which regulate cooling levels accordingly. Data loggers' applications span across numerous industries, with their measurement criteria varying depending on the specific use case.
What are the market trends shaping the Data Logger Industry?
- The increasing demand for customized automation solutions is a notable trend in the current market. Customization is becoming a key factor in automation solutions, as businesses seek to optimize their operations and improve efficiency.
- The market is witnessing a significant increase in demand from small and medium businesses due to the affordability of stand-alone data loggers. Customized automation solutions, which allow users to connect multiple data loggers for automated testing, measurement, and control functions, are gaining popularity. This trend is expected to continue, leading to a decrease in the cost of customized solutions and making them more accessible to end-users. By integrating multiple data loggers, businesses can streamline their operations, improve efficiency, and enhance data accuracy.
- This shift towards customized automation solutions is a key growth driver for the market. The market's expansion is further fueled by the increasing adoption of IoT technology and the growing need for real-time data monitoring across various industries. With the ability to provide actionable insights, data loggers are becoming essential tools for businesses seeking to optimize their operations and make informed decisions.
What challenges does the Data Logger Industry face during its growth?
- The significant requirement for substantial capital investments in software solutions poses a major challenge to the industry's growth trajectory.
- The market exhibits continuous evolution, with ongoing advancements in technology driving its growth. According to recent studies, the market is expected to witness significant expansion, with an increasing number of industries relying on these devices for monitoring and recording critical data. However, the adoption rate among small and medium end-users remains limited due to the high initial cost of acquiring and integrating software solutions. This challenge arises from the need to connect various data loggers, either wirelessly or via Ethernet/USB cables, to utilize these software solutions.
- Despite this hurdle, the market's future looks promising as advancements in IoT and cloud technologies are expected to make data logger solutions more accessible and cost-effective. This trend will enable a broader range of industries to leverage data loggers for optimizing processes and enhancing operational efficiency.
Exclusive Customer Landscape
The data logger market forecasting report includes the adoption lifecycle of the market, covering from the innovator's stage to the laggard's stage. It focuses on adoption rates in different regions based on penetration. Furthermore, the data logger market report also includes key purchase criteria and drivers of price sensitivity to help companies evaluate and develop their market growth analysis strategies.
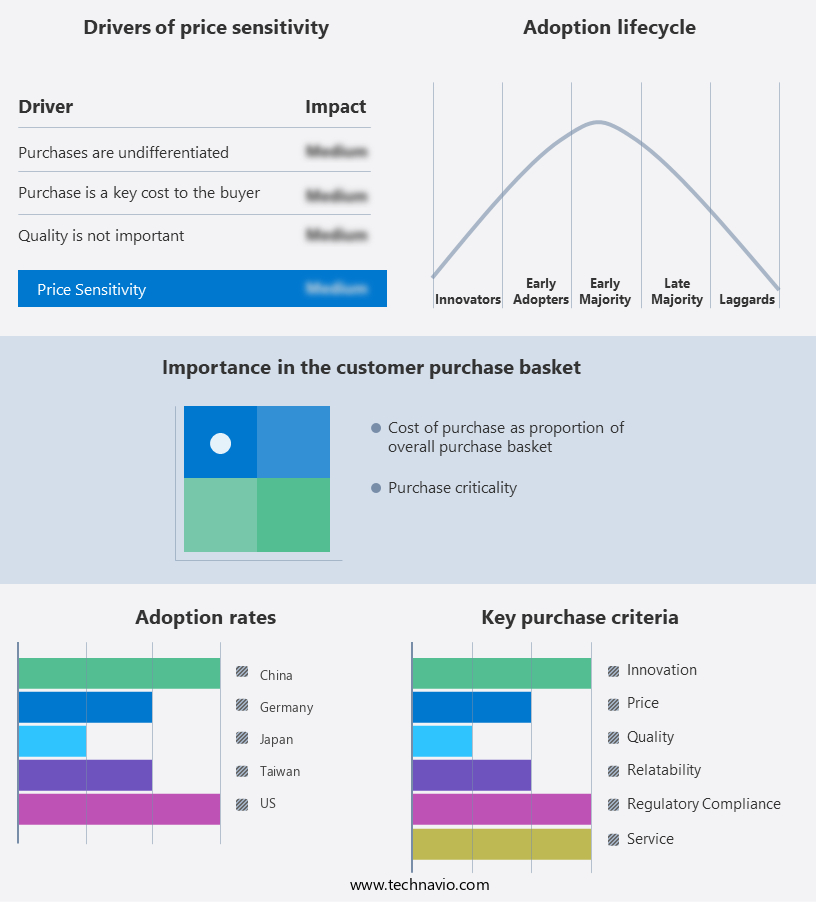
Customer Landscape of Data Logger Industry
Competitive Landscape & Market Insights
Companies are implementing various strategies, such as strategic alliances, data logger market forecast, partnerships, mergers and acquisitions, geographical expansion, and product/service launches, to enhance their presence in the industry.
ABB Ltd. - The VSN700500 product, featuring a 3840 kW AC rating and a lightweight 0.91kg design, is equipped with an ethernet communication interface.
The industry research and growth report includes detailed analyses of the competitive landscape of the market and information about key companies, including:
- ABB Ltd.
- Accsense Monitoring Systems and Data Loggers Inc
- AiM Tech Srl
- Ammonit Measurement GmbH
- Chauvin Arnoux Group
- Delphin Technology AG
- Delta Electronics Inc.
- Delta OHM Srl
- Dickson Inc.
- ELPRO BUCHS AG
- Gemini Data Loggers UK Ltd.
- Influx Technology Ltd
- Keysight Technologies Inc.
- Kimo Electronic Pvt Ltd
- Larasian Ltd
- McLaren Group Ltd.
- National Instruments Corp.
- Robert Bosch GmbH
- Thermo Fisher Scientific Inc.
- Yokogawa Electric Corp.
Qualitative and quantitative analysis of companies has been conducted to help clients understand the wider business environment as well as the strengths and weaknesses of key industry players. Data is qualitatively analyzed to categorize companies as pure play, category-focused, industry-focused, and diversified; it is quantitatively analyzed to categorize companies as dominant, leading, strong, tentative, and weak.
Recent Development and News in Data Logger Market
- In January 2024, Honeywell International Inc. announced the launch of its new data logger product line, the Honeywell Sensicycle 6100 Series, designed for monitoring and recording temperature, humidity, and other critical parameters in various industries, including pharmaceuticals and food and beverage (Honeywell press release, 2024).
- In March 2024, Schneider Electric and Siemens signed a strategic partnership to integrate Schneider Electric's EcoStruxure Asset Advisor with Siemens' MindSphere, enabling interoperability between their industrial IoT platforms and enhancing data logger solutions for their respective clients (Schneider Electric press release, 2024).
- In May 2024, TemperPack LLC, a sustainable packaging solutions provider, raised a USD 20 million Series C funding round to expand its SmartPack data logger technology, which monitors temperature and humidity during product transportation, and enhance its IoT capabilities (TemperPack press release, 2024).
- In April 2025, the European Union's Medical Devices Regulation (MDR) came into effect, mandating the use of data loggers for temperature monitoring in medical devices and increasing the demand for advanced data logger solutions (European Commission, 2020).
Dive into Technavio's robust research methodology, blending expert interviews, extensive data synthesis, and validated models for unparalleled Data Logger Market insights. See full methodology.
|
Market Scope |
|
|
Report Coverage |
Details |
|
Page number |
238 |
|
Base year |
2024 |
|
Historic period |
2019-2023 |
|
Forecast period |
2025-2029 |
|
Growth momentum & CAGR |
Accelerate at a CAGR of 4% |
|
Market growth 2025-2029 |
USD 1029 million |
|
Market structure |
Fragmented |
|
YoY growth 2024-2025(%) |
3.7 |
|
Key countries |
US, China, Germany, UK, Taiwan, Japan, Canada, France, South Korea, and India |
|
Competitive landscape |
Leading Companies, Market Positioning of Companies, Competitive Strategies, and Industry Risks |
Research Analyst Overview
- In the dynamic and evolving landscape of data logging, remote monitoring systems play a pivotal role in ensuring data integrity checks across various industries, from industrial automation to precision agriculture. Wireless communication protocols underpin the functionality of these systems, enabling seamless data transmission and real-time processing. Smart grids and environmental monitoring applications are prime adopters of data logging technologies, with battery life optimization and predictive maintenance being key focus areas. Calibration procedures and data redundancy ensure accurate and reliable data acquisition, while power consumption metrics and device compatibility are essential considerations for optimizing system performance.
- Security protocols and error correction codes are crucial components of data logging systems, ensuring data privacy and integrity. Signal processing techniques and data visualization tools facilitate efficient data analysis, while cloud data storage and software upgrades enable scalability and flexibility. Firmware updates and hardware specifications are essential for maintaining system compatibility and performance. Data encryption and transmission rates are critical factors in securing data and ensuring efficient data transfer. Data logging software and sensor networks form the backbone of IoT applications, facilitating seamless integration of various devices and systems. Machine learning algorithms and real-time data processing enable predictive maintenance and proactive system management.
- Network topology and system integration are essential for optimizing data flow and ensuring seamless communication between various components. Sensor accuracy and data analytics platform capabilities significantly impact the overall effectiveness of data logging systems. In conclusion, the data logging market is characterized by continuous innovation and evolving trends, with a focus on improving data integrity, optimizing power consumption, and ensuring secure and efficient data transfer. The integration of advanced technologies, such as machine learning algorithms and IoT applications, is driving the market forward, offering significant opportunities for growth and development.
What are the Key Data Covered in this Data Logger Market Research and Growth Report?
-
What is the expected growth of the Data Logger Market between 2025 and 2029?
-
USD 1.03 billion, at a CAGR of 4%
-
-
What segmentation does the market report cover?
-
The report segmented by Type (Stand-alone systems and AS/M), Measurement (Pressure, Power, Temperature, Humidity, and Others), Channel (Single-channel data loggers and Multi-channel data loggers), End-user (Manufacturing, Energy and power, Oil and gas, and Automotive), and Geography (APAC, North America, Europe, Middle East and Africa, and South America)
-
-
Which regions are analyzed in the report?
-
APAC, North America, Europe, Middle East and Africa, and South America
-
-
What are the key growth drivers and market challenges?
-
Increasing demand for test, measurement, and control solutions, High capital investments for software solutions
-
-
Who are the major players in the Data Logger Market?
-
Key Companies ABB Ltd., Accsense Monitoring Systems and Data Loggers Inc, AiM Tech Srl, Ammonit Measurement GmbH, Chauvin Arnoux Group, Delphin Technology AG, Delta Electronics Inc., Delta OHM Srl, Dickson Inc., ELPRO BUCHS AG, Gemini Data Loggers UK Ltd., Influx Technology Ltd, Keysight Technologies Inc., Kimo Electronic Pvt Ltd, Larasian Ltd, McLaren Group Ltd., National Instruments Corp., Robert Bosch GmbH, Thermo Fisher Scientific Inc., and Yokogawa Electric Corp.
-
Market Research Insights
- The market encompasses a diverse range of technologies and applications, with a significant focus on enhancing data accuracy and efficiency. Two key aspects of data logger development are sensor calibration and data compression. According to industry estimates, sensor calibration accounts for approximately 20% of the total development time and cost in data logger systems. In contrast, data compression techniques can reduce data volume by up to 90%, leading to improved system performance and reduced storage requirements. Data logger systems also prioritize system reliability through various methods, including fault tolerance, energy efficiency, and data lifecycle management.
- For instance, data deduplication and filtering techniques help maintain data quality, while data visualization and report generation facilitate effective data analysis. Additionally, remote diagnostics and anomaly detection enable proactive maintenance and issue resolution. With continuous advancements in data logger technology, scalability considerations, user interface design, and data governance remain essential for ensuring optimal system performance and user experience.
We can help! Our analysts can customize this data logger market research report to meet your requirements.
 RIA -
RIA - 
