Soil Testing Equipment Market Size 2025-2029
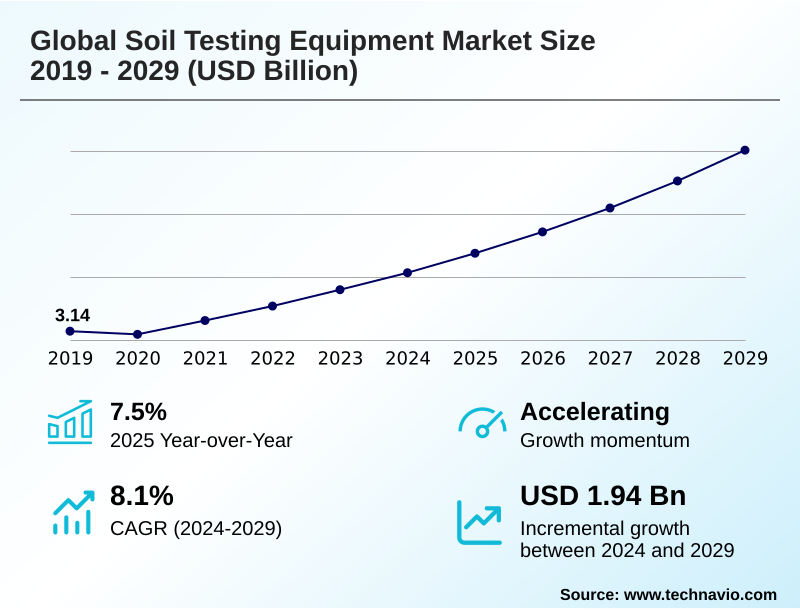
The soil testing equipment market size is valued to increase by USD 1.94 billion, at a CAGR of 8.1% from 2024 to 2029. Increasing demand for precision agriculture will drive the soil testing equipment market.
Major Market Trends & Insights
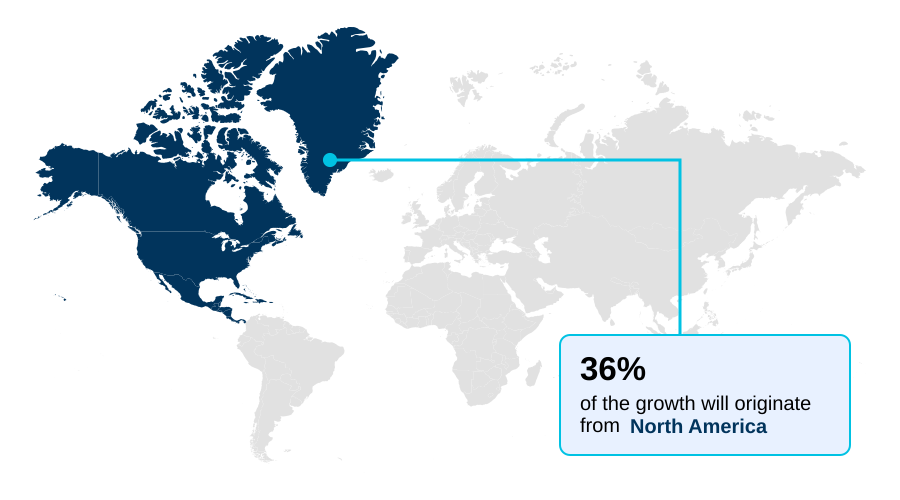
- North America dominated the market and accounted for a 36.2% growth during the forecast period.
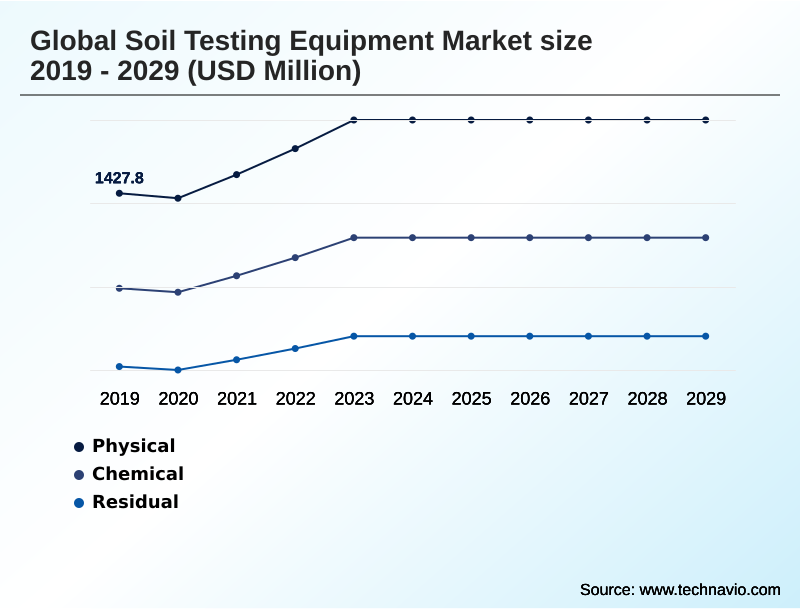
- By Test - Physical segment was valued at USD 1.74 billion in 2023
- By End-user - Agriculture segment accounted for the largest market revenue share in 2023
Market Size & Forecast
- Market Opportunities: USD 2.88 billion
- Market Future Opportunities: USD 1.94 billion
- CAGR from 2024 to 2029 : 8.1%
Market Summary
- The soil testing equipment market is undergoing a significant transformation, driven by the dual imperatives of enhancing agricultural productivity and ensuring structural and environmental safety. In agriculture, the shift toward precision farming necessitates a granular understanding of soil composition, moving beyond basic analysis. This demand fuels innovation in devices that provide actionable data for optimizing resource use.
- For example, a large-scale agribusiness can deploy a network of sensors for real-time soil monitoring across thousands of acres. This data, integrated into a central platform, allows for precise variable rate fertilizer application, which not only boosts crop yield optimization data but also minimizes environmental runoff, aligning with sustainable land management metrics.
- Simultaneously, the construction and environmental sectors rely on this equipment for geotechnical site investigation and soil contamination assessment. Before breaking ground on a major urban infrastructure project, engineers use tools for load-bearing capacity evaluation and heavy metal screening to mitigate risks and comply with stringent safety and environmental regulations.
- This convergence of data-driven agriculture and risk-averse engineering underpins the market's sustained relevance and technological evolution, making tools like portable xrf analyzers and cone penetration test systems essential for modern land management.
What will be the Size of the Soil Testing Equipment Market during the forecast period?
Get Key Insights on Market Forecast (PDF) Get Free Sample
How is the Soil Testing Equipment Market Segmented?
The soil testing equipment industry research report provides comprehensive data (region-wise segment analysis), with forecasts and estimates in "USD million" for the period 2025-2029, as well as historical data from 2019-2023 for the following segments.
- Test
- Physical
- Chemical
- Residual
- End-user
- Agriculture
- Construction
- Application
- Soil fertility analysis
- Contamination detection
- Geotechnical assessment
- Geography
- North America
- US
- Canada
- Mexico
- Europe
- Germany
- UK
- France
- APAC
- China
- India
- Japan
- South America
- Brazil
- Argentina
- Colombia
- Middle East and Africa
- Saudi Arabia
- UAE
- South Africa
- Rest of World (ROW)
- North America
By Test Insights
The physical segment is estimated to witness significant growth during the forecast period.
The physical test segment is foundational, focusing on the mechanical and structural properties of soil essential for geotechnical engineering and construction. Demand is linked to global infrastructure investment, where understanding soil stability and behavior is non-negotiable.
This involves the use of equipment for automated triaxial testing, which determines shear strength, and in-situ sampling equipment for undisturbed sample collection.
The trend is shifting toward greater automation; for instance, automated soil sample preparation systems have been shown to reduce processing errors by over 15% compared to manual methods.
Other critical tools include the digital sieve shaker for particle size analysis and the soil moisture tester, which is vital for water retention capacity testing and soil erosion control analysis.
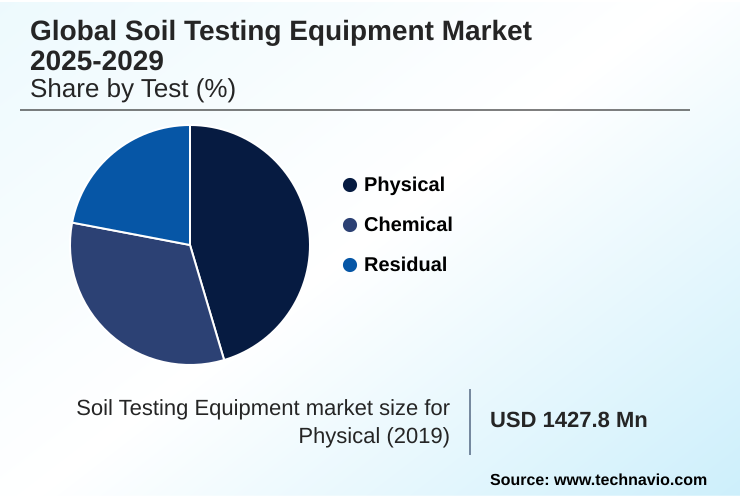
The Physical segment was valued at USD 1.74 billion in 2023 and showed a gradual increase during the forecast period.
Regional Analysis
North America is estimated to contribute 36.2% to the growth of the global market during the forecast period.Technavio’s analysts have elaborately explained the regional trends and drivers that shape the market during the forecast period.
See How Soil Testing Equipment Market Demand is Rising in North America Get Free Sample
North America commands a 36.2% share of incremental growth, driven by extensive infrastructure projects and stringent environmental regulations.
In this region, geotechnical site investigation for infrastructure safety assessment is paramount, fueling demand for advanced physical testing equipment like cone penetration test systems and cbr test equipment.
The use of wireless CPT systems has been shown to improve on-site operational efficiency by over 20%. Meanwhile, APAC is the fastest-growing region, where rapid urbanization necessitates thorough construction materials testing and geotechnical risk assessment.
Here, equipment such as the direct shear test apparatus and liquid limit testing devices is critical for accurate load-bearing capacity evaluation in new developments.
Market Dynamics
Our researchers analyzed the data with 2024 as the base year, along with the key drivers, trends, and challenges. A holistic analysis of drivers will help companies refine their marketing strategies to gain a competitive advantage.
- The market is evolving beyond traditional lab-based methods toward more agile, data-driven solutions. The integration of advanced sensors for real-time soil analysis into farming and environmental monitoring workflows is becoming a standard for proactive management.
- This shift is supported by the increasing availability of on-site soil nutrient level testing equipment, which empowers agricultural producers to make immediate adjustments to fertilizer strategies, optimizing input costs and improving yields. In parallel, the construction sector relies heavily on geotechnical testing for infrastructure safety compliance, where precision and reliability are non-negotiable.
- The use of portable analyzers for soil contamination screening has also become critical for rapid site assessments and environmental due diligence, allowing for faster decision-making in land development projects. At the forefront of this evolution are AI-driven platforms for soil health management, which synthesize data from multiple sources to provide predictive insights.
- Companies adopting these integrated platforms report decision-making speeds for land use planning that are twice as fast as those relying on disconnected data streams, showcasing a significant operational advantage.
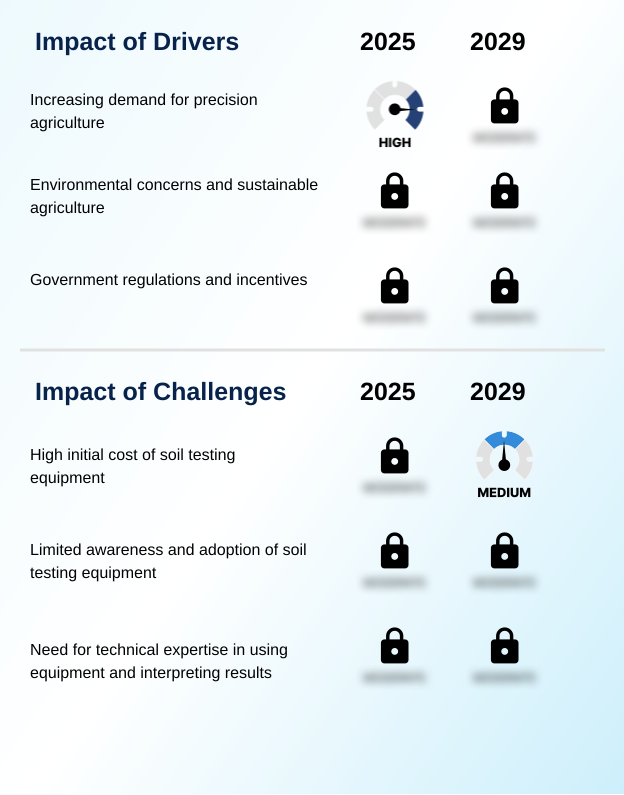
What are the key market drivers leading to the rise in the adoption of Soil Testing Equipment Industry?
- The increasing demand for precision agriculture is a fundamental driver propelling market growth and innovation.
- A key driver is the growing emphasis on sustainable land management metrics, which necessitates robust soil health diagnostics.
- This fuels demand for accessible tools like handheld soil nutrient analyzers and soil pH and EC meters, which enable more effective nutrient management planning.
- Innovations in sensor technology, including advanced electrochemical soil sensors and optical soil sensors, are making detailed agricultural soil profiling more feasible, with some devices improving data acquisition efficiency by 30%.
- Furthermore, tightening regulations for environmental compliance testing boost the adoption of portable lab-on-a-chip devices for rapid, on-site analysis, reducing reliance on external labs and cutting verification times by half for certain parameters.
What are the market trends shaping the Soil Testing Equipment Industry?
- The proliferation of precision agriculture and the enforcement of global sustainable farming mandates are key trends shaping the market's trajectory.
- Market evolution is increasingly defined by the integration of advanced technologies for real-time soil monitoring. The deployment of IoT-enabled soil sensors allows for continuous data streams, enabling variable rate fertilizer application with a precision that can reduce nutrient waste by over 25%. Concurrently, the use of drone-based remote sensing and hyperspectral imaging for soil is transforming large-scale soil fertility mapping.
- These technologies, complemented by on-site tools like portable XRF analyzers and mobile FTIR instruments, generate detailed crop yield optimization data. This shift provides actionable insights for managing precision agriculture inputs, improving decision-making speed by up to 40% compared to traditional lab-based workflows.
What challenges does the Soil Testing Equipment Industry face during its growth?
- The high initial cost of soil testing equipment presents a significant challenge to market growth.
- Despite technological advancements, the high capital cost of sophisticated laboratory instruments such as atomic absorption spectrometers remains a significant barrier. These systems, essential for detailed heavy metal screening and trace PFAS contamination analysis, can represent an investment that is 20-30% higher than more basic field equipment.
- Furthermore, the specialized expertise required to operate advanced equipment for soil structure analysis and soil organic carbon measurement using tools like soil respirometry systems creates operational challenges.
- While field instruments like soil compaction meters and those using X-ray fluorescence technology are more accessible, a skills gap can limit their effective deployment for complex tasks like comprehensive urban soil quality testing, impacting data interpretation from geotechnical data loggers.
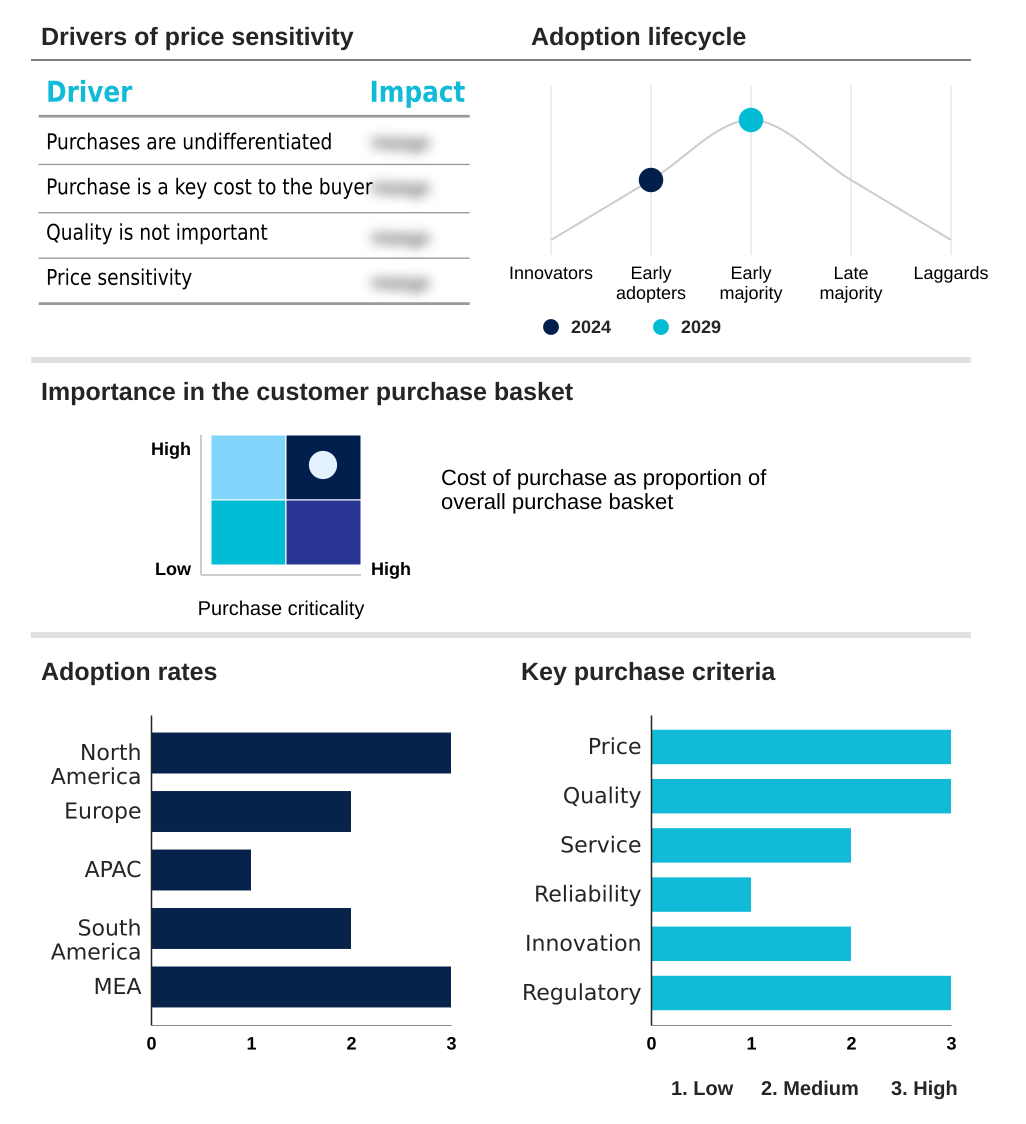
Exclusive Technavio Analysis on Customer Landscape
The soil testing equipment market forecasting report includes the adoption lifecycle of the market, covering from the innovator’s stage to the laggard’s stage. It focuses on adoption rates in different regions based on penetration. Furthermore, the soil testing equipment market report also includes key purchase criteria and drivers of price sensitivity to help companies evaluate and develop their market growth analysis strategies.
Customer Landscape of Soil Testing Equipment Industry
Competitive Landscape
Companies are implementing various strategies, such as strategic alliances, soil testing equipment market forecast, partnerships, mergers and acquisitions, geographical expansion, and product/service launches, to enhance their presence in the industry.
Agilent Technologies Inc. - Provides mobile FTIR instruments for precise sample preparation and on-site material analysis, enhancing analytical capabilities across diverse sectors.
The industry research and growth report includes detailed analyses of the competitive landscape of the market and information about key companies, including:
- Agilent Technologies Inc.
- ALFA Testing Equipment
- EIE instruments
- ELE International
- Eurofins Scientific SE
- Geotechnical Testing Equipment UK Ltd.
- Gilson Co. Inc.
- Hanna Instruments Inc.
- Humboldt Mfg. Co.
- Hydraulic and Engineering Instruments
- LaMotte Co.
- Matest Spa
- Merck KGaA
- Naugra Export
- Nova Ventures Group Corp.
- PerkinElmer US LLC
- Plasti Surge Industries Pvt. Ltd.
- S.W.COLE Engineering Inc.
- Sun LabTek Equipments Pvt. Ltd.
- Thermo Fisher Scientific Inc.
Qualitative and quantitative analysis of companies has been conducted to help clients understand the wider business environment as well as the strengths and weaknesses of key industry players. Data is qualitatively analyzed to categorize companies as pure play, category-focused, industry-focused, and diversified; it is quantitatively analyzed to categorize companies as dominant, leading, strong, tentative, and weak.
Recent Development and News in Soil testing equipment market
- In May, 2025, The African Union Commission, in partnership with several international development banks, launched the 'Soil Intelligence for Africa' initiative, allocating significant funding for the widespread deployment of soil testing kits and mobile labs to support the Nairobi Declaration's 10-year action plan.
- In March, 2025, Thermo Fisher Scientific Inc. unveiled a new generation of portable XRF analyzers with enhanced AI-driven software, reducing soil heavy metal detection time by 40% and improving compliance with new EPA screening levels for lead and other contaminants.
- In January, 2025, Agilent Technologies Inc. announced a strategic partnership with a leading agricultural drone manufacturer to integrate its compact spectrometer technology, enabling real-time, high-resolution soil nutrient mapping during aerial surveys.
- In November, 2024, Eurofins Scientific SE completed the acquisition of a leading environmental testing laboratory in Brazil, significantly expanding its capacity for soil analysis to support the country's new legal framework for bio-inputs and sustainable agriculture.
Dive into Technavio’s robust research methodology, blending expert interviews, extensive data synthesis, and validated models for unparalleled Soil Testing Equipment Market insights. See full methodology.
| Market Scope | |
|---|---|
| Page number | 287 |
| Base year | 2024 |
| Historic period | 2019-2023 |
| Forecast period | 2025-2029 |
| Growth momentum & CAGR | Accelerate at a CAGR of 8.1% |
| Market growth 2025-2029 | USD 1944.9 million |
| Market structure | Fragmented |
| YoY growth 2024-2025(%) | 7.5% |
| Key countries | US, Canada, Mexico, Germany, UK, France, Italy, Spain, The Netherlands, China, India, Japan, South Korea, Australia, Indonesia, Brazil, Argentina, Colombia, Saudi Arabia, UAE, South Africa, Egypt and Nigeria |
| Competitive landscape | Leading Companies, Market Positioning of Companies, Competitive Strategies, and Industry Risks |
Research Analyst Overview
- The soil testing equipment market is advancing through the convergence of field-based and laboratory instrumentation, addressing critical needs in agriculture and civil engineering. The adoption of IoT-enabled soil sensors, including sophisticated electrochemical soil sensors and optical soil sensors, provides continuous data streams for precision management.
- This is complemented by drone-based remote sensing and hyperspectral imaging for soil, which offer macro-level insights. For on-site analysis, handheld soil nutrient analyzers, portable XRF analyzers using X-ray fluorescence technology, and mobile FTIR instruments are becoming indispensable.
- In geotechnical applications, cone penetration test systems, including innovative wireless CPT systems, and CBR test equipment are standard for site assessments, with data captured by geotechnical data loggers. Laboratory analysis remains vital, employing atomic absorption spectrometers for trace element detection and soil respirometry systems for biological activity.
- The integration of automated systems for automated soil sample preparation and automated triaxial testing has improved analytical throughput, with some labs achieving a 30% reduction in sample processing time.
- Physical property analysis relies on mainstays like the digital sieve shaker, soil compaction meters, direct shear test apparatus, liquid limit testing devices, soil pH and EC meters, and soil moisture tester, supported by proper in-situ sampling equipment and emerging portable lab-on-a-chip devices.
What are the Key Data Covered in this Soil Testing Equipment Market Research and Growth Report?
-
What is the expected growth of the Soil Testing Equipment Market between 2025 and 2029?
-
USD 1.94 billion, at a CAGR of 8.1%
-
-
What segmentation does the market report cover?
-
The report is segmented by Test (Physical, Chemical, and Residual), End-user (Agriculture, and Construction), Application (Soil fertility analysis, Contamination detection, and Geotechnical assessment) and Geography (North America, Europe, APAC, South America, Middle East and Africa)
-
-
Which regions are analyzed in the report?
-
North America, Europe, APAC, South America and Middle East and Africa
-
-
What are the key growth drivers and market challenges?
-
Increasing demand for precision agriculture, High initial cost of soil testing equipment
-
-
Who are the major players in the Soil Testing Equipment Market?
-
Agilent Technologies Inc., ALFA Testing Equipment, EIE instruments, ELE International, Eurofins Scientific SE, Geotechnical Testing Equipment UK Ltd., Gilson Co. Inc., Hanna Instruments Inc., Humboldt Mfg. Co., Hydraulic and Engineering Instruments, LaMotte Co., Matest Spa, Merck KGaA, Naugra Export, Nova Ventures Group Corp., PerkinElmer US LLC, Plasti Surge Industries Pvt. Ltd., S.W.COLE Engineering Inc., Sun LabTek Equipments Pvt. Ltd. and Thermo Fisher Scientific Inc.
-
Market Research Insights
- Market dynamics are shaped by the convergence of agricultural optimization and infrastructure safety. The drive for sustainable land management metrics fuels demand for detailed agricultural profiling and soil health diagnostics. This data underpins nutrient management planning and enables variable rate fertilizer application, which has shown to improve resource efficiency by over 15%.
- In parallel, geotechnical site investigation is critical for infrastructure safety assessment, requiring thorough load-bearing capacity evaluation and construction materials testing. Stringent regulations mandate environmental compliance testing, including heavy metal screening and PFAS contamination analysis, often as part of urban soil quality testing and land remediation validation.
- Real-time soil monitoring provides crop yield optimization data for managing precision agriculture inputs, while physical tests for soil structure analysis, water retention capacity testing, and soil erosion control analysis inform both farming and geotechnical risk assessment. Accurate soil fertility mapping can increase farm profitability by up to 10% through targeted interventions.
We can help! Our analysts can customize this soil testing equipment market research report to meet your requirements.
 RIA -
RIA - 
