Rowing Machines Market Analysis, Size, and Forecast 2026-2030: North America (US, Canada, and Mexico), Europe (Germany, UK, and France), APAC (China, Japan, and India), South America (Brazil and Argentina), Middle East and Africa (Saudi Arabia, UAE, and South Africa), and Rest of World (ROW)

Rowing Machines Market Analysis, Size, and Forecast 2026-2030:
North America (US, Canada, and Mexico), Europe (Germany, UK, and France), APAC (China, Japan, and India), South America (Brazil and Argentina), Middle East and Africa (Saudi Arabia, UAE, and South Africa), and Rest of World (ROW)

Published: Mar 2026 284 Pages SKU: IRTNTR43507

Market Overview at a Glance

$266.7 Mn
Market Opportunity
4.6%
CAGR 2025 - 2030
36.2%
North America Growth
$631.2 Mn
Fitness centers segment 2024

Rowing Machines Market Size 2026-2030
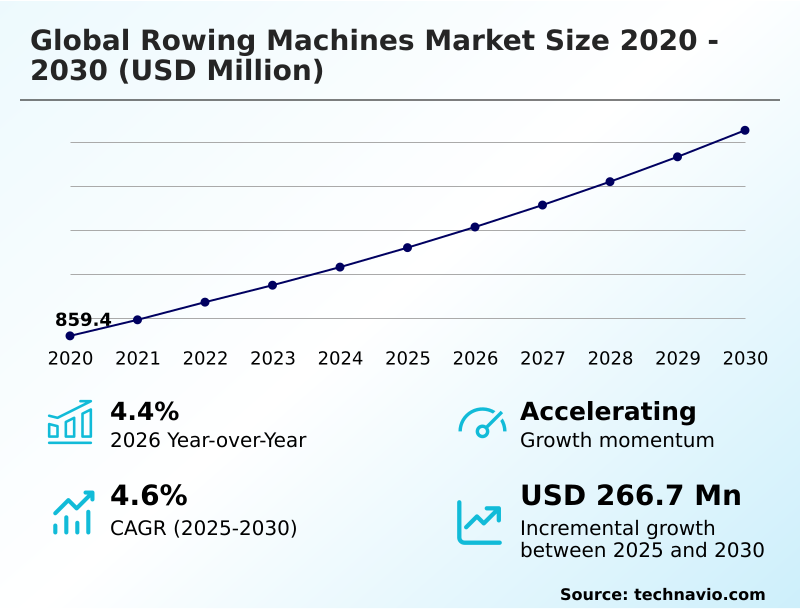
The rowing machines market size is valued to increase by USD 266.7 million, at a CAGR of 4.6% from 2025 to 2030. Technological innovation and rise of connected fitness ecosystems will drive the rowing machines market.

Major Market Trends & Insights

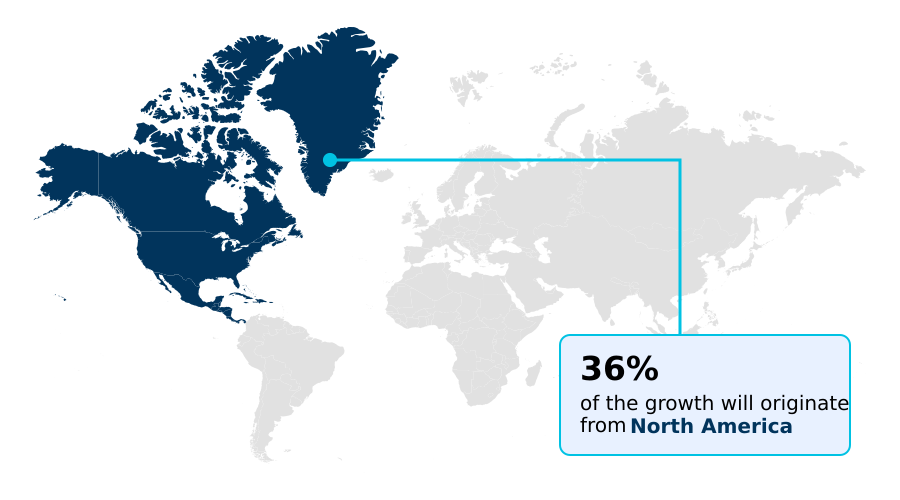
  • North America dominated the market and accounted for a 36.2% growth during the forecast period.
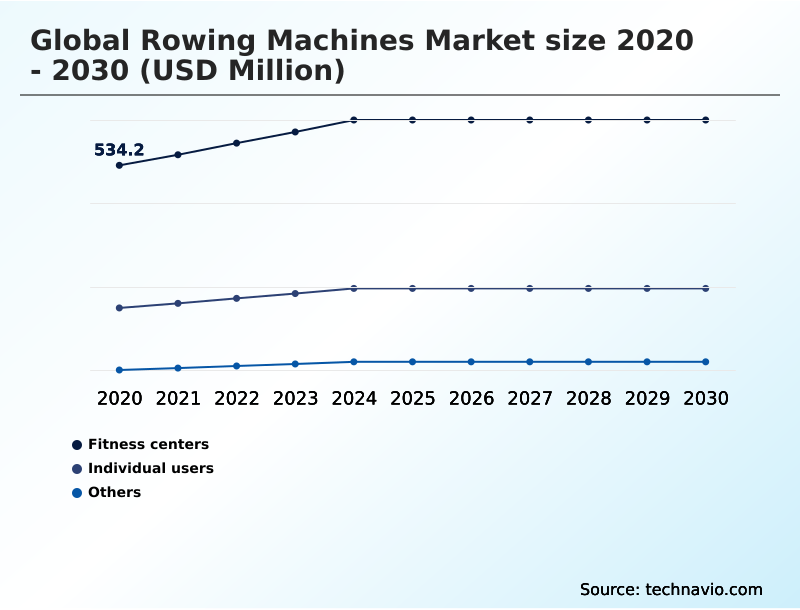
  • By End-user - Fitness centers segment was valued at USD 631.2 million in 2024
  • By Distribution Channel - Offline segment accounted for the largest market revenue share in 2024

Market Size & Forecast

  • Market Opportunities: USD 467.2 million
  • Market Future Opportunities: USD 266.7 million
  • CAGR from 2025 to 2030 : 4.6%

Market Summary

  • The rowing machines market is undergoing a significant transformation, moving beyond basic mechanical ergometers to become a cornerstone of the connected fitness landscape. This evolution is driven by consumer demand for low-impact cardiovascular solutions that provide full-body muscle engagement with minimal orthopedic strain reduction.
  • Key trends include the integration of AI-powered biometric feedback and real-time performance analytics, delivered via high-definition touchscreens and immersive virtual coaching.
  • For instance, a business operating a chain of boutique fitness studios can leverage gamified digital ecosystems and competitive virtual racing platforms to boost member retention, tracking engagement metrics to optimize class schedules and content offerings, resulting in higher lifetime customer value.
  • However, the market faces challenges related to the high cost of high-fidelity rowing units and the need for effective ergonomic education programs to ensure proper use and prevent repetitive strain injury risk. The industry is responding with space-efficient equipment design, including foldable frame mechanisms and vertical storage solutions, making high-performance training more accessible for in-home workout solutions.
  • The future will be defined by the ability of manufacturers to blend hardware innovation, such as dual-resistance systems, with compelling subscription-based content ecosystems.

What will be the Size of the Rowing Machines Market during the forecast period?

Get Key Insights on Market Forecast (PDF) Request Free Sample

How is the Rowing Machines Market Segmented?

The rowing machines industry research report provides comprehensive data (region-wise segment analysis), with forecasts and estimates in "USD million" for the period 2026-2030, as well as historical data from 2020-2024 for the following segments.

  • End-user
    • Fitness centers
    • Individual users
    • Others
  • Distribution channel
    • Offline
    • Online
  • Type
    • Metal
    • Solid wood
  • Geography
    • North America
      • US
      • Canada
      • Mexico
    • Europe
      • Germany
      • UK
      • France
    • APAC
      • China
      • Japan
      • India
    • South America
      • Brazil
      • Argentina
    • Middle East and Africa
      • Saudi Arabia
      • UAE
      • South Africa
    • Rest of World (ROW)

By End-user Insights

The fitness centers segment is estimated to witness significant growth during the forecast period.

The fitness centers segment is a foundational pillar, requiring heavy-duty, commercial-grade equipment capable of withstanding continuous use. Procurement decisions in this space are increasingly sophisticated, focusing not just on durability but also on technology integration.

Facilities select from a range of resistance mechanisms, including high-performance air resistance flywheels, silent magnetic resistance brakes, and aesthetic water-filled resistance tanks.

The adoption of high-fidelity rowing units is driven by demand for advanced features like ergonomic seating design, adjustable footplate mechanics, and versatile dual-resistance systems.

Furthermore, the integration of high-definition touchscreens enhances member engagement through subscription-based content ecosystems offering interactive game-based software, achievement-based progression, and virtual reality rowing courses.

This digital integration has improved member retention by up to 20% in boutique studios that leverage gamified fitness.

Request Free Sample

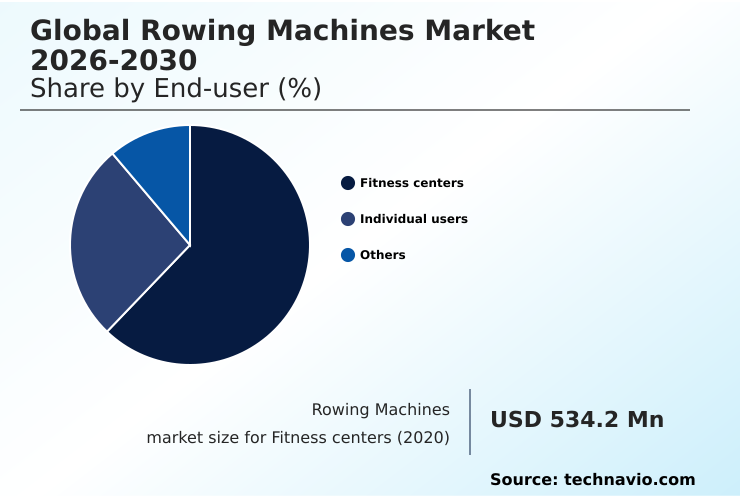
The Fitness centers segment was valued at USD 631.2 million in 2024 and showed a gradual increase during the forecast period.

Request Free Sample

Regional Analysis

North America is estimated to contribute 36.2% to the growth of the global market during the forecast period.Technavio’s analysts have elaborately explained the regional trends and drivers that shape the market during the forecast period.

See How Rowing Machines Market Demand is Rising in North America Request Free Sample

Geographically, the market is shaped by urbanization and the demand for compact urban residential design.

In densely populated regions like Europe and APAC, there is a distinct preference for space-efficient equipment design and ultra-compact folding technology to accommodate smaller living spaces.

This has accelerated the adoption of in-home workout solutions that feature foldable frame mechanisms and vertical storage solutions, with such models now accounting for 47% of consumer interest in metropolitan areas.

The trend extends to modular hybrid equipment and multi-functional workout stations that enable hybrid strength training integration. These all-in-one workout workstations may feature detachable rail systems or a rotating handlebar design.

Manufacturers are also focusing on furniture-grade aesthetics, allowing equipment to blend into home environments, a strategy that has been shown to reduce product return rates by over 10%.

Market Dynamics

Our researchers analyzed the data with 2025 as the base year, along with the key drivers, trends, and challenges. A holistic analysis of drivers will help companies refine their marketing strategies to gain a competitive advantage.

  • The evolution of the rowing machines market is increasingly defined by specific user needs and technological integrations. The demand for ai-powered biometric feedback integration is paramount, as consumers seek sophisticated real-time form correction technology to maximize low-impact full-body workout benefits and ensure ergonomic design for injury prevention.
  • For the growing home fitness segment, the appeal of gamified ecosystems for home fitness is undeniable, offering engagement through online community and social features and virtual racing platforms for competition. These digital experiences, often delivered via a high-definition screen immersive experience, are a core part of the connected fitness subscription value. Hardware innovation is equally critical.
  • The compact foldable design for apartments and options for vertical storage for small spaces address key logistical challenges for urban users. Consumers now choose between water resistance for realistic feel, magnetic resistance for silent operation, and air resistance for performance tracking, often seeking dual resistance for varied intensity.
  • The ultimate goal for many is to create multi-functional home gym solutions, which is supported by the durability of commercial-grade rowers and their ability to sync with personal devices through biometric data sync with wearables. This shift toward integrated hardware and software has improved user adherence by over 25% compared to non-connected equipment.

What are the key market drivers leading to the rise in the adoption of Rowing Machines Industry?

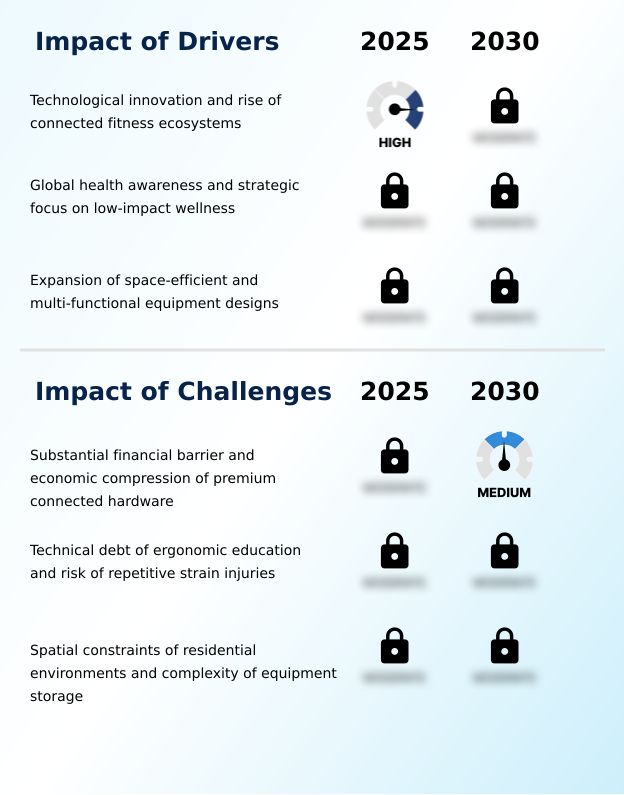
  • Technological innovation and the rise of connected fitness ecosystems are key drivers propelling market growth.

  • Market growth is significantly driven by rising health awareness and the demand for low-impact cardiovascular solutions. Equipment that ensures full-body muscle engagement while facilitating orthopedic strain reduction is gaining prominence, particularly as preventive healthcare instruments for active-aging fitness solutions.
  • Corporate wellness programs have reported a 10% reduction in employee health claims after integrating such equipment. The expansion of connected fitness ecosystems, powered by low-latency streaming hardware and mobile-compatible software, is another key driver.
  • These platforms feature AI-driven adaptive training and are increasingly built on open Bluetooth connectivity protocols to ensure cross-platform compatibility with third-party apps.
  • This strategy broadens the user base and has been linked to a 15% improvement in long-term metabolic function improvement for consistent users.

What are the market trends shaping the Rowing Machines Industry?

  • The integration of AI-powered biometric feedback and hydrometric performance data is an emerging market trend, driving demand for systems that deliver personalized coaching and real-time analysis.

  • A primary trend reshaping the market is the institutionalization of intelligent ergometry systems that deliver AI-powered biometric feedback. These platforms use machine learning biomechanics and extensive sensor array integration to provide real-time performance analytics and data-integrated coaching. This shift enables a composite performance assessment of a user's workout, with hydrometric performance scoring systems improving form consistency by up to 25%.
  • The experience is further enhanced by immersive virtual coaching and seamless biometric data synchronization with wearables. Demand is also surging for gamified digital ecosystems and competitive virtual racing platforms that transform solitary exercise into a social activity.
  • The use of personalized coaching algorithms within these platforms has demonstrated an 18% increase in weekly user engagement compared to traditional on-demand video libraries.

What challenges does the Rowing Machines Industry face during its growth?

  • A substantial financial barrier for premium connected hardware, coupled with economic compression, presents a key challenge affecting industry growth.

  • A significant challenge involves mitigating the repetitive strain injury risk associated with improper form, especially during high-intensity interval training (HIIT). The lack of accessible coaching increases the need for robust ergonomic education programs and digital onboarding programs focused on lumbar strain prevention. To address this, manufacturers are embedding technology for real-time form correction and haptic feedback systems into their equipment.
  • These systems perform detailed biomechanical alignment analysis, reducing injury rates by over 30% in novice users. Another challenge is maintaining engagement within socialized fitness networks. While virtual regatta environments and shared data leaderboards are popular, they require constant innovation to remain compelling. Advanced metrics for stroke precision measurement and power distribution analysis are becoming essential for retaining experienced users.

Exclusive Technavio Analysis on Customer Landscape

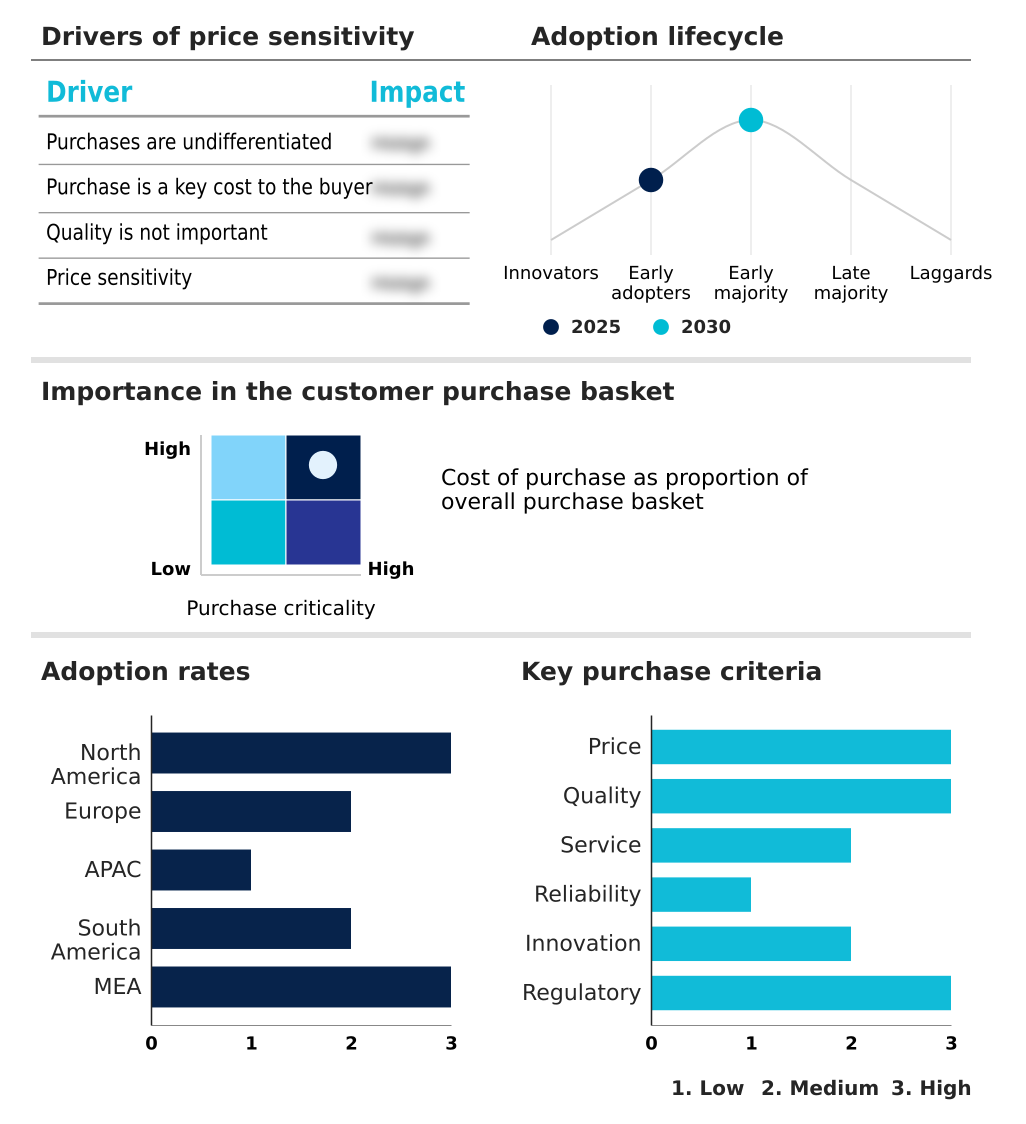
The rowing machines market forecasting report includes the adoption lifecycle of the market, covering from the innovator’s stage to the laggard’s stage. It focuses on adoption rates in different regions based on penetration. Furthermore, the rowing machines market report also includes key purchase criteria and drivers of price sensitivity to help companies evaluate and develop their market growth analysis strategies.

Customer Landscape of Rowing Machines Industry

Competitive Landscape

Companies are implementing various strategies, such as strategic alliances, rowing machines market forecast, partnerships, mergers and acquisitions, geographical expansion, and product/service launches, to enhance their presence in the industry.

Assault Fitness - A specialized portfolio focused on high-intensity resistance rowers that leverage gamified digital ecosystems and competitive virtual racing to drive user engagement and motivation.

The industry research and growth report includes detailed analyses of the competitive landscape of the market and information about key companies, including:

  • Assault Fitness
  • Aviron Interactive Inc.
  • BH Fitness
  • Body Craft Inc.
  • Concept2 Inc.
  • Core Health and Fitness LLC
  • Echelon Fitness Multimedia LLC
  • Ergatta Inc.
  • FluidRower
  • Hydrow Inc.
  • Life Fitness
  • Matrix Fitness
  • Peloton Interactive Inc.
  • Precor Inc.
  • Spirit Fitness
  • Stamina Products Inc.
  • Sunny Health and Fitness
  • Technogym S.p.A.
  • Tunturi New Fitness B.V.
  • WaterRower Inc.

Qualitative and quantitative analysis of companies has been conducted to help clients understand the wider business environment as well as the strengths and weaknesses of key industry players. Data is qualitatively analyzed to categorize companies as pure play, category-focused, industry-focused, and diversified; it is quantitatively analyzed to categorize companies as dominant, leading, strong, tentative, and weak.

Recent Development and News in Rowing machines market

  • In November, 2025, Ergatta Inc. launched the Ergatta Luxe Rower, a premium machine developed in collaboration with WaterRower, featuring American cherrywood construction to elevate aesthetic and interactive standards for at-home rowing.
  • In January, 2026, Concept2 Inc. began its fiftieth-anniversary celebrations by reaffirming its commitment to the RowErg platform and introducing the StrengthErg, a device designed for multi-modal resistance exercise.
  • In February, 2026, World Rowing conducted the 2026 World Rowing Virtual Indoor Championships, a global event using Concept2 indoor rowers and cloud-based software that enabled real-time competition between athletes across different continents.
  • In March, 2026, WaterRower Inc. announced an expansion of its Performance Series with a new line of teak models featuring an upgraded digital interface synchronized with biometric data, blending artisanal hardware with advanced tracking.

Dive into Technavio’s robust research methodology, blending expert interviews, extensive data synthesis, and validated models for unparalleled Rowing Machines Market insights. See full methodology.

Market Scope
Page number 284
Base year 2025
Historic period 2020-2024
Forecast period 2026-2030
Growth momentum & CAGR Accelerate at a CAGR of 4.6%
Market growth 2026-2030 USD 266.7 million
Market structure Fragmented
YoY growth 2025-2026(%) 4.4%
Key countries US, Canada, Mexico, Germany, UK, France, Italy, Spain, The Netherlands, China, Japan, India, South Korea, Australia, Indonesia, Brazil, Argentina, Chile, Saudi Arabia, UAE, South Africa, Israel and Turkey
Competitive landscape Leading Companies, Market Positioning of Companies, Competitive Strategies, and Industry Risks

Request Free Sample

Research Analyst Overview

  • The market is defined by a pivot toward connected fitness ecosystems, where hardware serves as a gateway to digital content. Core innovation includes AI-powered biometric feedback and hydrometric performance scoring delivered via immersive virtual coaching on high-definition touchscreens. This facilitates real-time performance analytics through biometric data synchronization.
  • The rise of gamified digital ecosystems and competitive virtual racing platforms creates socialized fitness networks and virtual regatta environments. Demand for low-impact cardiovascular solutions drives adoption, as they offer full-body muscle engagement with significant orthopedic strain reduction. To mitigate injury risk from high-intensity interval training (HIIT), manufacturers are integrating real-time form correction and haptic feedback systems.
  • The product landscape is diversifying to include modular hybrid equipment for hybrid strength training integration, creating multi-functional workout stations and all-in-one workout workstations. In a key boardroom decision, a focus on space-efficient equipment design, including foldable frame mechanisms and vertical storage solutions, has been shown to expand the addressable urban market by 35%.
  • Hardware now features dual-resistance systems, blending air resistance flywheels, magnetic resistance brakes, and water-filled resistance tanks. This is supported by AI-driven adaptive training with open Bluetooth connectivity protocols for cross-platform compatibility, ensuring precise stroke precision measurement and power distribution analysis.

What are the Key Data Covered in this Rowing Machines Market Research and Growth Report?

  • What is the expected growth of the Rowing Machines Market between 2026 and 2030?

    • USD 266.7 million, at a CAGR of 4.6%

  • What segmentation does the market report cover?

    • The report is segmented by End-user (Fitness centers, Individual users, and Others), Distribution Channel (Offline, and Online), Type (Metal, and Solid wood) and Geography (North America, Europe, APAC, South America, Middle East and Africa)

  • Which regions are analyzed in the report?

    • North America, Europe, APAC, South America and Middle East and Africa

  • What are the key growth drivers and market challenges?

    • Technological innovation and rise of connected fitness ecosystems, Substantial financial barrier and economic compression of premium connected hardware

  • Who are the major players in the Rowing Machines Market?

    • Assault Fitness, Aviron Interactive Inc., BH Fitness, Body Craft Inc., Concept2 Inc., Core Health and Fitness LLC, Echelon Fitness Multimedia LLC, Ergatta Inc., FluidRower, Hydrow Inc., Life Fitness, Matrix Fitness, Peloton Interactive Inc., Precor Inc., Spirit Fitness, Stamina Products Inc., Sunny Health and Fitness, Technogym S.p.A., Tunturi New Fitness B.V. and WaterRower Inc.

Market Research Insights

  • Market dynamics are shifting toward intelligent and personalized fitness experiences. The adoption of intelligent ergometry systems and machine learning biomechanics allows for a composite performance assessment that was previously exclusive to professional athletes, improving user performance metrics by an average of 18%. These systems rely on sensor array integration and low-latency streaming hardware to deliver data-integrated coaching.
  • The demand for preventive healthcare instruments in active-aging fitness solutions is a significant growth catalyst. Integration with mobile-compatible software and open APIs for third-party racing applications has increased platform stickiness, contributing to a 12% lower churn rate for subscription services compared to closed ecosystems. This move toward socialized fitness networks is redefining equipment value.

We can help! Our analysts can customize this rowing machines market research report to meet your requirements.

Get in touch

1. Executive Summary

1.1 Market overview

Executive Summary - Chart on Market Overview
Executive Summary - Data Table on Market Overview
Executive Summary - Chart on Global Market Characteristics
Executive Summary - Chart on Market by Geography
Executive Summary - Chart on Market Segmentation by End-user
Executive Summary - Chart on Market Segmentation by Distribution Channel
Executive Summary - Chart on Market Segmentation by Type
Executive Summary - Chart on Incremental Growth
Executive Summary - Data Table on Incremental Growth
Executive Summary - Chart on Company Market Positioning

2. Technavio Analysis

2.1 Analysis of price sensitivity, lifecycle, customer purchase basket, adoption rates, and purchase criteria

2.2 Criticality of inputs and Factors of differentiation

Chart on Overview on criticality of inputs and factors of differentiation

2.3 Factors of disruption

Chart on Overview on factors of disruption

2.4 Impact of drivers and challenges

Chart on Impact of drivers and challenges in 2025 and 2030

3. Market Landscape

3.1 Market ecosystem

Chart on Parent Market
Data Table on - Parent Market

3.2 Market characteristics

Chart on Market characteristics analysis

3.3 Value chain analysis

Chart on Value chain analysis

4. Market Sizing

4.1 Market definition

Data Table on Offerings of companies included in the market definition

4.2 Market segment analysis

Market segments

4.3 Market size 2025

4.4 Market outlook: Forecast for 2025-2030

Chart on Global - Market size and forecast 2025-2030 ($ million)
Data Table on Global - Market size and forecast 2025-2030 ($ million)
Chart on Global Market: Year-over-year growth 2025-2030 (%)
Data Table on Global Market: Year-over-year growth 2025-2030 (%)

5. Historic Market Size

5.1 Global Rowing Machines Market 2020 - 2024

Historic Market Size - Data Table on Global Rowing Machines Market 2020 - 2024 ($ million)

5.2 End-user segment analysis 2020 - 2024

Historic Market Size - End-user Segment 2020 - 2024 ($ million)

5.3 Distribution Channel segment analysis 2020 - 2024

Historic Market Size - Distribution Channel Segment 2020 - 2024 ($ million)

5.4 Type segment analysis 2020 - 2024

Historic Market Size - Type Segment 2020 - 2024 ($ million)

5.5 Geography segment analysis 2020 - 2024

Historic Market Size - Geography Segment 2020 - 2024 ($ million)

5.6 Country segment analysis 2020 - 2024

Historic Market Size - Country Segment 2020 - 2024 ($ million)

6. Qualitative Analysis

6.1 Impact of AI in global rowing machines market

6.2 Impact of geopolitical conflict for global rowing machines market

7. Five Forces Analysis

7.1 Five forces summary

Five forces analysis - Comparison between 2025 and 2030

7.2 Bargaining power of buyers

Bargaining power of buyers - Impact of key factors 2025 and 2030

7.3 Bargaining power of suppliers

Bargaining power of suppliers - Impact of key factors in 2025 and 2030

7.4 Threat of new entrants

Threat of new entrants - Impact of key factors in 2025 and 2030

7.5 Threat of substitutes

Threat of substitutes - Impact of key factors in 2025 and 2030

7.6 Threat of rivalry

Threat of rivalry - Impact of key factors in 2025 and 2030

7.7 Market condition

Chart on Market condition - Five forces 2025 and 2030

8. Market Segmentation by End-user

8.1 Market segments

Chart on End-user - Market share 2025-2030 (%)
Data Table on End-user - Market share 2025-2030 (%)

8.2 Comparison by End-user

Chart on Comparison by End-user
Data Table on Comparison by End-user

8.3 Fitness centers - Market size and forecast 2025-2030

Chart on Fitness centers - Market size and forecast 2025-2030 ($ million)
Data Table on Fitness centers - Market size and forecast 2025-2030 ($ million)
Chart on Fitness centers - Year-over-year growth 2025-2030 (%)
Data Table on Fitness centers - Year-over-year growth 2025-2030 (%)

8.4 Individual users - Market size and forecast 2025-2030

Chart on Individual users - Market size and forecast 2025-2030 ($ million)
Data Table on Individual users - Market size and forecast 2025-2030 ($ million)
Chart on Individual users - Year-over-year growth 2025-2030 (%)
Data Table on Individual users - Year-over-year growth 2025-2030 (%)

8.5 Others - Market size and forecast 2025-2030

Chart on Others - Market size and forecast 2025-2030 ($ million)
Data Table on Others - Market size and forecast 2025-2030 ($ million)
Chart on Others - Year-over-year growth 2025-2030 (%)
Data Table on Others - Year-over-year growth 2025-2030 (%)

8.6 Market opportunity by End-user

Market opportunity by End-user ($ million)
Data Table on Market opportunity by End-user ($ million)

9. Market Segmentation by Distribution Channel

9.1 Market segments

Chart on Distribution Channel - Market share 2025-2030 (%)
Data Table on Distribution Channel - Market share 2025-2030 (%)

9.2 Comparison by Distribution Channel

Chart on Comparison by Distribution Channel
Data Table on Comparison by Distribution Channel

9.3 Offline - Market size and forecast 2025-2030

Chart on Offline - Market size and forecast 2025-2030 ($ million)
Data Table on Offline - Market size and forecast 2025-2030 ($ million)
Chart on Offline - Year-over-year growth 2025-2030 (%)
Data Table on Offline - Year-over-year growth 2025-2030 (%)

9.4 Online - Market size and forecast 2025-2030

Chart on Online - Market size and forecast 2025-2030 ($ million)
Data Table on Online - Market size and forecast 2025-2030 ($ million)
Chart on Online - Year-over-year growth 2025-2030 (%)
Data Table on Online - Year-over-year growth 2025-2030 (%)

9.5 Market opportunity by Distribution Channel

Market opportunity by Distribution Channel ($ million)
Data Table on Market opportunity by Distribution Channel ($ million)

10. Market Segmentation by Type

10.1 Market segments

Chart on Type - Market share 2025-2030 (%)
Data Table on Type - Market share 2025-2030 (%)

10.2 Comparison by Type

Chart on Comparison by Type
Data Table on Comparison by Type

10.3 Metal - Market size and forecast 2025-2030

Chart on Metal - Market size and forecast 2025-2030 ($ million)
Data Table on Metal - Market size and forecast 2025-2030 ($ million)
Chart on Metal - Year-over-year growth 2025-2030 (%)
Data Table on Metal - Year-over-year growth 2025-2030 (%)

10.4 Solid wood - Market size and forecast 2025-2030

Chart on Solid wood - Market size and forecast 2025-2030 ($ million)
Data Table on Solid wood - Market size and forecast 2025-2030 ($ million)
Chart on Solid wood - Year-over-year growth 2025-2030 (%)
Data Table on Solid wood - Year-over-year growth 2025-2030 (%)

10.5 Market opportunity by Type

Market opportunity by Type ($ million)
Data Table on Market opportunity by Type ($ million)

11. Customer Landscape

11.1 Customer landscape overview

Analysis of price sensitivity, lifecycle, customer purchase basket, adoption rates, and purchase criteria

12. Geographic Landscape

12.1 Geographic segmentation

Chart on Market share by geography 2025-2030 (%)
Data Table on Market share by geography 2025-2030 (%)

12.2 Geographic comparison

Chart on Geographic comparison
Data Table on Geographic comparison

12.3 North America - Market size and forecast 2025-2030

Chart on North America - Market size and forecast 2025-2030 ($ million)
Data Table on North America - Market size and forecast 2025-2030 ($ million)
Chart on North America - Year-over-year growth 2025-2030 (%)
Data Table on North America - Year-over-year growth 2025-2030 (%)
Chart on Regional Comparison - North America
Data Table on Regional Comparison - North America

12.3.1 US - Market size and forecast 2025-2030

Chart on US - Market size and forecast 2025-2030 ($ million)
Data Table on US - Market size and forecast 2025-2030 ($ million)
Chart on US - Year-over-year growth 2025-2030 (%)
Data Table on US - Year-over-year growth 2025-2030 (%)

12.3.2 Canada - Market size and forecast 2025-2030

Chart on Canada - Market size and forecast 2025-2030 ($ million)
Data Table on Canada - Market size and forecast 2025-2030 ($ million)
Chart on Canada - Year-over-year growth 2025-2030 (%)
Data Table on Canada - Year-over-year growth 2025-2030 (%)

12.3.3 Mexico - Market size and forecast 2025-2030

Chart on Mexico - Market size and forecast 2025-2030 ($ million)
Data Table on Mexico - Market size and forecast 2025-2030 ($ million)
Chart on Mexico - Year-over-year growth 2025-2030 (%)
Data Table on Mexico - Year-over-year growth 2025-2030 (%)

12.4 Europe - Market size and forecast 2025-2030

Chart on Europe - Market size and forecast 2025-2030 ($ million)
Data Table on Europe - Market size and forecast 2025-2030 ($ million)
Chart on Europe - Year-over-year growth 2025-2030 (%)
Data Table on Europe - Year-over-year growth 2025-2030 (%)
Chart on Regional Comparison - Europe
Data Table on Regional Comparison - Europe

12.4.1 Germany - Market size and forecast 2025-2030

Chart on Germany - Market size and forecast 2025-2030 ($ million)
Data Table on Germany - Market size and forecast 2025-2030 ($ million)
Chart on Germany - Year-over-year growth 2025-2030 (%)
Data Table on Germany - Year-over-year growth 2025-2030 (%)

12.4.2 UK - Market size and forecast 2025-2030

Chart on UK - Market size and forecast 2025-2030 ($ million)
Data Table on UK - Market size and forecast 2025-2030 ($ million)
Chart on UK - Year-over-year growth 2025-2030 (%)
Data Table on UK - Year-over-year growth 2025-2030 (%)

12.4.3 France - Market size and forecast 2025-2030

Chart on France - Market size and forecast 2025-2030 ($ million)
Data Table on France - Market size and forecast 2025-2030 ($ million)
Chart on France - Year-over-year growth 2025-2030 (%)
Data Table on France - Year-over-year growth 2025-2030 (%)

12.4.4 Italy - Market size and forecast 2025-2030

Chart on Italy - Market size and forecast 2025-2030 ($ million)
Data Table on Italy - Market size and forecast 2025-2030 ($ million)
Chart on Italy - Year-over-year growth 2025-2030 (%)
Data Table on Italy - Year-over-year growth 2025-2030 (%)

12.4.5 Spain - Market size and forecast 2025-2030

Chart on Spain - Market size and forecast 2025-2030 ($ million)
Data Table on Spain - Market size and forecast 2025-2030 ($ million)
Chart on Spain - Year-over-year growth 2025-2030 (%)
Data Table on Spain - Year-over-year growth 2025-2030 (%)

12.4.6 The Netherlands - Market size and forecast 2025-2030

Chart on The Netherlands - Market size and forecast 2025-2030 ($ million)
Data Table on The Netherlands - Market size and forecast 2025-2030 ($ million)
Chart on The Netherlands - Year-over-year growth 2025-2030 (%)
Data Table on The Netherlands - Year-over-year growth 2025-2030 (%)

12.5 APAC - Market size and forecast 2025-2030

Chart on APAC - Market size and forecast 2025-2030 ($ million)
Data Table on APAC - Market size and forecast 2025-2030 ($ million)
Chart on APAC - Year-over-year growth 2025-2030 (%)
Data Table on APAC - Year-over-year growth 2025-2030 (%)
Chart on Regional Comparison - APAC
Data Table on Regional Comparison - APAC

12.5.1 China - Market size and forecast 2025-2030

Chart on China - Market size and forecast 2025-2030 ($ million)
Data Table on China - Market size and forecast 2025-2030 ($ million)
Chart on China - Year-over-year growth 2025-2030 (%)
Data Table on China - Year-over-year growth 2025-2030 (%)

12.5.2 Japan - Market size and forecast 2025-2030

Chart on Japan - Market size and forecast 2025-2030 ($ million)
Data Table on Japan - Market size and forecast 2025-2030 ($ million)
Chart on Japan - Year-over-year growth 2025-2030 (%)
Data Table on Japan - Year-over-year growth 2025-2030 (%)

12.5.3 India - Market size and forecast 2025-2030

Chart on India - Market size and forecast 2025-2030 ($ million)
Data Table on India - Market size and forecast 2025-2030 ($ million)
Chart on India - Year-over-year growth 2025-2030 (%)
Data Table on India - Year-over-year growth 2025-2030 (%)

12.5.4 South Korea - Market size and forecast 2025-2030

Chart on South Korea - Market size and forecast 2025-2030 ($ million)
Data Table on South Korea - Market size and forecast 2025-2030 ($ million)
Chart on South Korea - Year-over-year growth 2025-2030 (%)
Data Table on South Korea - Year-over-year growth 2025-2030 (%)

12.5.5 Australia - Market size and forecast 2025-2030

Chart on Australia - Market size and forecast 2025-2030 ($ million)
Data Table on Australia - Market size and forecast 2025-2030 ($ million)
Chart on Australia - Year-over-year growth 2025-2030 (%)
Data Table on Australia - Year-over-year growth 2025-2030 (%)

12.5.6 Indonesia - Market size and forecast 2025-2030

Chart on Indonesia - Market size and forecast 2025-2030 ($ million)
Data Table on Indonesia - Market size and forecast 2025-2030 ($ million)
Chart on Indonesia - Year-over-year growth 2025-2030 (%)
Data Table on Indonesia - Year-over-year growth 2025-2030 (%)

12.6 South America - Market size and forecast 2025-2030

Chart on South America - Market size and forecast 2025-2030 ($ million)
Data Table on South America - Market size and forecast 2025-2030 ($ million)
Chart on South America - Year-over-year growth 2025-2030 (%)
Data Table on South America - Year-over-year growth 2025-2030 (%)
Chart on Regional Comparison - South America
Data Table on Regional Comparison - South America

12.6.1 Brazil - Market size and forecast 2025-2030

Chart on Brazil - Market size and forecast 2025-2030 ($ million)
Data Table on Brazil - Market size and forecast 2025-2030 ($ million)
Chart on Brazil - Year-over-year growth 2025-2030 (%)
Data Table on Brazil - Year-over-year growth 2025-2030 (%)

12.6.2 Argentina - Market size and forecast 2025-2030

Chart on Argentina - Market size and forecast 2025-2030 ($ million)
Data Table on Argentina - Market size and forecast 2025-2030 ($ million)
Chart on Argentina - Year-over-year growth 2025-2030 (%)
Data Table on Argentina - Year-over-year growth 2025-2030 (%)

12.6.3 Chile - Market size and forecast 2025-2030

Chart on Chile - Market size and forecast 2025-2030 ($ million)
Data Table on Chile - Market size and forecast 2025-2030 ($ million)
Chart on Chile - Year-over-year growth 2025-2030 (%)
Data Table on Chile - Year-over-year growth 2025-2030 (%)

12.7 Middle East and Africa - Market size and forecast 2025-2030

Chart on Middle East and Africa - Market size and forecast 2025-2030 ($ million)
Data Table on Middle East and Africa - Market size and forecast 2025-2030 ($ million)
Chart on Middle East and Africa - Year-over-year growth 2025-2030 (%)
Data Table on Middle East and Africa - Year-over-year growth 2025-2030 (%)
Chart on Regional Comparison - Middle East and Africa
Data Table on Regional Comparison - Middle East and Africa

12.7.1 Saudi Arabia - Market size and forecast 2025-2030

Chart on Saudi Arabia - Market size and forecast 2025-2030 ($ million)
Data Table on Saudi Arabia - Market size and forecast 2025-2030 ($ million)
Chart on Saudi Arabia - Year-over-year growth 2025-2030 (%)
Data Table on Saudi Arabia - Year-over-year growth 2025-2030 (%)

12.7.2 UAE - Market size and forecast 2025-2030

Chart on UAE - Market size and forecast 2025-2030 ($ million)
Data Table on UAE - Market size and forecast 2025-2030 ($ million)
Chart on UAE - Year-over-year growth 2025-2030 (%)
Data Table on UAE - Year-over-year growth 2025-2030 (%)

12.7.3 South Africa - Market size and forecast 2025-2030

Chart on South Africa - Market size and forecast 2025-2030 ($ million)
Data Table on South Africa - Market size and forecast 2025-2030 ($ million)
Chart on South Africa - Year-over-year growth 2025-2030 (%)
Data Table on South Africa - Year-over-year growth 2025-2030 (%)

12.7.4 Israel - Market size and forecast 2025-2030

Chart on Israel - Market size and forecast 2025-2030 ($ million)
Data Table on Israel - Market size and forecast 2025-2030 ($ million)
Chart on Israel - Year-over-year growth 2025-2030 (%)
Data Table on Israel - Year-over-year growth 2025-2030 (%)

12.7.5 Turkey - Market size and forecast 2025-2030

Chart on Turkey - Market size and forecast 2025-2030 ($ million)
Data Table on Turkey - Market size and forecast 2025-2030 ($ million)
Chart on Turkey - Year-over-year growth 2025-2030 (%)
Data Table on Turkey - Year-over-year growth 2025-2030 (%)

12.8 Market opportunity by geography

Market opportunity by geography ($ million)
Data Tables on Market opportunity by geography ($ million)

13. Drivers, Challenges, and Opportunity

13.1 Market drivers

Technological innovation and rise of connected fitness ecosystems
Global health awareness and strategic focus on low-impact wellness
Expansion of space-efficient and multi-functional equipment designs

13.2 Market challenges

Substantial financial barrier and economic compression of premium connected hardware
Technical debt of ergonomic education and risk of repetitive strain injuries
Spatial constraints of residential environments and complexity of equipment storage

13.3 Impact of drivers and challenges

Impact of drivers and challenges in 2025 and 2030

13.4 Market opportunities

Integration of AI-powered biometric feedback and hydrometric performance
Growth of gamified digital ecosystems and competitive virtual racing platforms
Expansion of modular hybrid equipment and multi-functional strength

14. Competitive Landscape

14.1 Overview

14.2

Overview on criticality of inputs and factors of differentiation

14.3 Landscape disruption

Overview on factors of disruption

14.4 Industry risks

Impact of key risks on business

15. Competitive Analysis

15.1 Companies profiled

Companies covered

15.2 Company ranking index

15.3 Market positioning of companies

Matrix on companies position and classification

15.4 Aviron Interactive Inc.

Aviron Interactive Inc. - Overview
Aviron Interactive Inc. - Product / Service
Aviron Interactive Inc. - Key offerings
SWOT

15.5 Concept2 Inc.

Concept2 Inc. - Overview
Concept2 Inc. - Product / Service
Concept2 Inc. - Key offerings
SWOT

15.6 Echelon Fitness Multimedia LLC

Echelon Fitness Multimedia LLC - Overview
Echelon Fitness Multimedia LLC - Product / Service
Echelon Fitness Multimedia LLC - Key offerings
SWOT

15.7 Ergatta Inc.

Ergatta Inc. - Overview
Ergatta Inc. - Product / Service
Ergatta Inc. - Key offerings
SWOT

15.8 FluidRower

FluidRower - Overview
FluidRower - Product / Service
FluidRower - Key offerings
SWOT

15.9 Hydrow Inc.

Hydrow Inc. - Overview
Hydrow Inc. - Product / Service
Hydrow Inc. - Key offerings
SWOT

15.10 Life Fitness

Life Fitness - Overview
Life Fitness - Product / Service
Life Fitness - Key offerings
SWOT

15.11 Matrix Fitness

Matrix Fitness - Overview
Matrix Fitness - Product / Service
Matrix Fitness - Key offerings
SWOT

15.12 Peloton Interactive Inc.

Peloton Interactive Inc. - Overview
Peloton Interactive Inc. - Business segments
Peloton Interactive Inc. - Key offerings
Peloton Interactive Inc. - Segment focus
SWOT

15.13 Precor Inc.

Precor Inc. - Overview
Precor Inc. - Product / Service
Precor Inc. - Key offerings
SWOT

15.14 Stamina Products Inc.

Stamina Products Inc. - Overview
Stamina Products Inc. - Product / Service
Stamina Products Inc. - Key offerings
SWOT

15.15 Sunny Health and Fitness

Sunny Health and Fitness - Overview
Sunny Health and Fitness - Product / Service
Sunny Health and Fitness - Key offerings
SWOT

15.16 Technogym S.p.A.

Technogym S.p.A. - Overview
Technogym S.p.A. - Product / Service
Technogym S.p.A. - Key offerings
SWOT

15.17 Tunturi New Fitness B.V.

Tunturi New Fitness B.V. - Overview
Tunturi New Fitness B.V. - Product / Service
Tunturi New Fitness B.V. - Key offerings
SWOT

15.18 WaterRower Inc.

WaterRower Inc. - Overview
WaterRower Inc. - Product / Service
WaterRower Inc. - Key offerings
SWOT

16. Appendix

16.1 Scope of the report

Market definition
Objectives
Notes and caveats

16.2 Inclusions and exclusions checklist

Inclusions checklist
Exclusions checklist

16.3 Currency conversion rates for US$

16.4 Research methodology

16.5 Data procurement

Information sources

16.6 Data validation

16.7 Validation techniques employed for market sizing

16.8 Data synthesis

16.9 360 degree market analysis

16.10 List of abbreviations

Research Methodology

Technavio presents a detailed picture of the market by way of study, synthesis, and summation of data from multiple sources. The analysts have presented the various facets of the market with a particular focus on identifying the key industry influencers. The data thus presented is comprehensive, reliable, and the result of extensive research, both primary and secondary.

INFORMATION SOURCES

Primary sources

  • Manufacturers and suppliers
  • Channel partners
  • Industry experts
  • Strategic decision makers

Secondary sources

  • Industry journals and periodicals
  • Government data
  • Financial reports of key industry players
  • Historical data
  • Press releases

DATA ANALYSIS

Data Synthesis

  • Collation of data
  • Estimation of key figures
  • Analysis of derived insights

Data Validation

  • Triangulation with data models
  • Reference against proprietary databases
  • Corroboration with industry experts

REPORT WRITING

Qualitative

  • Market drivers
  • Market challenges
  • Market trends
  • Five forces analysis

Quantitative

  • Market size and forecast
  • Market segmentation
  • Geographical insights
  • Competitive landscape

Interested in this report?

Get your sample now to see our research methodology and insights!

Download Now

Frequently Asked Questions

Rowing Machines market growth will increase by USD 266.7 million during 2026-2030.

The Rowing Machines market is expected to grow at a CAGR of 4.6% during 2026-2030.

Rowing Machines market is segmented by End-user (Fitness centers, Individual users, Others) Distribution channel (Offline, Online) Type (Metal, Solid wood)

Assault Fitness, Aviron Interactive Inc., BH Fitness, Body Craft Inc., Concept2 Inc., Core Health and Fitness LLC, Echelon Fitness Multimedia LLC, Ergatta Inc., FluidRower, Hydrow Inc., Life Fitness, Matrix Fitness, Peloton Interactive Inc., Precor Inc., Spirit Fitness, Stamina Products Inc., Sunny Health and Fitness, Technogym S.p.A., Tunturi New Fitness B.V., WaterRower Inc. are a few of the key vendors in the Rowing Machines market.

North America will register the highest growth rate of 36.2% among the other regions. Therefore, the Rowing Machines market in North America is expected to garner significant business opportunities for the vendors during the forecast period.

US, Canada, Mexico, Germany, UK, France, Italy, Spain, The Netherlands, China, Japan, India, South Korea, Australia, Indonesia, Brazil, Argentina, Chile, Saudi Arabia, UAE, South Africa, Israel, Turkey

  • Technological innovation and rise of connected fitness ecosystems is the driving factor this market.

The Rowing Machines market vendors should focus on grabbing business opportunities from the End-user segment as it accounted for the largest market share in the base year.
RIA - Research AI Assistant
Ask RIA