Static Mixer Market Analysis, Size, and Forecast 2026-2030: APAC (China, India, and Japan), North America (US, Canada, and Mexico), Europe (UK, Germany, and France), South America (Brazil and Argentina), Middle East and Africa (Saudi Arabia, South Africa, and UAE), and Rest of World (ROW)

Static Mixer Market Analysis, Size, and Forecast 2026-2030:
APAC (China, India, and Japan), North America (US, Canada, and Mexico), Europe (UK, Germany, and France), South America (Brazil and Argentina), Middle East and Africa (Saudi Arabia, South Africa, and UAE), and Rest of World (ROW)

Published: Dec 2025 300 Pages SKU: IRTNTR72608

Market Overview at a Glance

$227.4 Mn
Market Opportunity
4.6%
CAGR 2025 - 2030
46.8%
APAC Growth
$508.3 Mn
Laminar flow segment 2024

Static Mixer Market Size 2026-2030

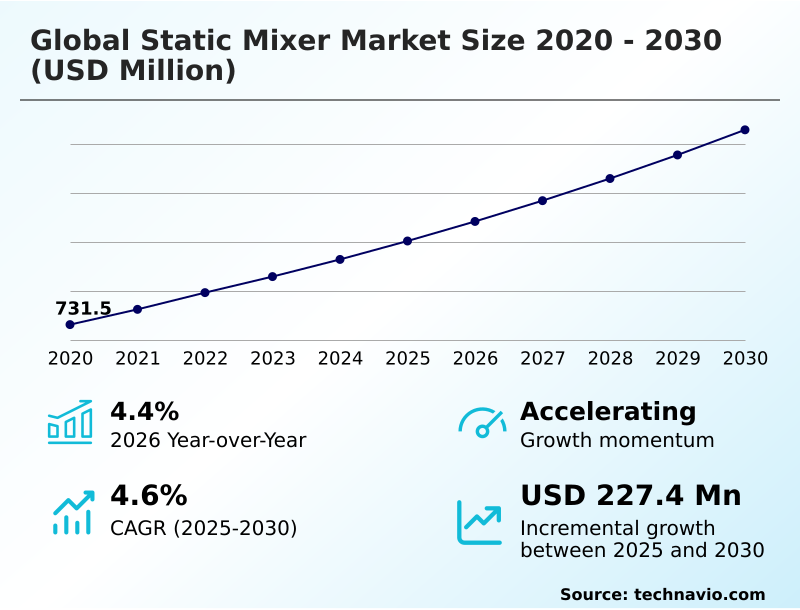
The static mixer market size is valued to increase by USD 227.4 million, at a CAGR of 4.6% from 2025 to 2030. Imperative for energy efficiency and industrial decarbonization will drive the static mixer market.

Major Market Trends & Insights

  • APAC dominated the market and accounted for a 46.8% growth during the forecast period.
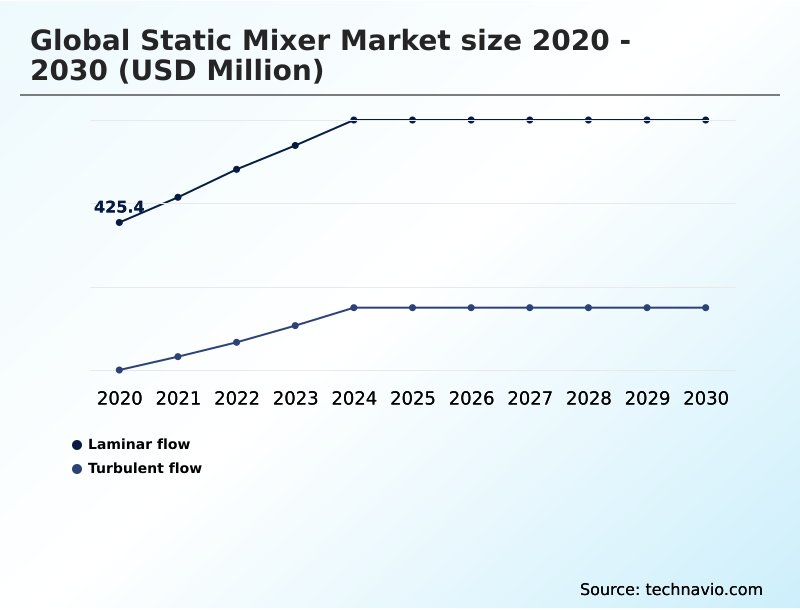
  • By Application - Laminar flow segment was valued at USD 508.3 million in 2024
  • By End-user - Oil and gas segment accounted for the largest market revenue share in 2024

Market Size & Forecast

  • Market Opportunities: USD 398.4 million
  • Market Future Opportunities: USD 227.4 million
  • CAGR from 2025 to 2030 : 4.6%

Market Summary

  • The Static Mixer Market is defined by a fundamental shift toward process intensification and continuous manufacturing, displacing traditional dynamic agitation. This evolution is propelled by the need for enhanced energy efficiency and lower operational expenditure, as static mixers operate without moving parts, leveraging the fluid's own energy for homogenization. Key sectors like chemical processing and water treatment are primary adopters.
  • In a typical scenario, a petrochemical facility implements inline static mixers to replace large batch reactors for a polymerization process. This transition not only improves thermal homogenization and product consistency but also reduces energy consumption and maintenance downtime, leading to higher plant availability.
  • Furthermore, advancements in computational fluid dynamics are enabling the design of highly optimized mixing elements tailored to specific fluid properties and process requirements, from laminar flow in high-viscosity applications to turbulent flow in gas-liquid systems, further cementing their role in modern industrial operations.

What will be the Size of the Static Mixer Market during the forecast period?

Get Key Insights on Market Forecast (PDF) Request Free Sample

How is the Static Mixer Market Segmented?

The static mixer industry research report provides comprehensive data (region-wise segment analysis), with forecasts and estimates in "USD million" for the period 2026-2030, as well as historical data from 2020-2024 for the following segments.

  • Application
    • Laminar flow
    • Turbulent flow
  • End-user
    • Oil and gas
    • Chemical and petrochemical
    • Food and beverage
    • Water and wastewater
    • Others
  • Distribution channel
    • OEMs
    • Third-party distributors
    • Online retail
  • Geography
    • APAC
      • China
      • India
      • Japan
    • North America
      • US
      • Canada
      • Mexico
    • Europe
      • UK
      • Germany
      • France
    • South America
      • Brazil
      • Argentina
    • Middle East and Africa
      • Saudi Arabia
      • South Africa
      • UAE
    • Rest of World (ROW)

By Application Insights

The laminar flow segment is estimated to witness significant growth during the forecast period.

The laminar flow segment is critical for applications involving high viscosity fluids, where achieving homogenization is challenging.

This segment relies on flow division, using helical elements to create millions of fluid layers, reducing striation thickness to microscopic levels for high viscosity mixing and effective emulsion preparation.

This method ensures thorough blending with minimal shear stress, preserving the integrity of sensitive materials in polymer melt blending.

In sectors like medical devices and electronics, single-use technology, such as the disposable mixer nozzle for adhesive dispensing system applications, is gaining traction.

The precise control offered by laminar flow mixers can improve blend uniformity by over 99%, eliminating inconsistencies in the final product. This low shear blending is fundamental for specialized processes.

Request Free Sample

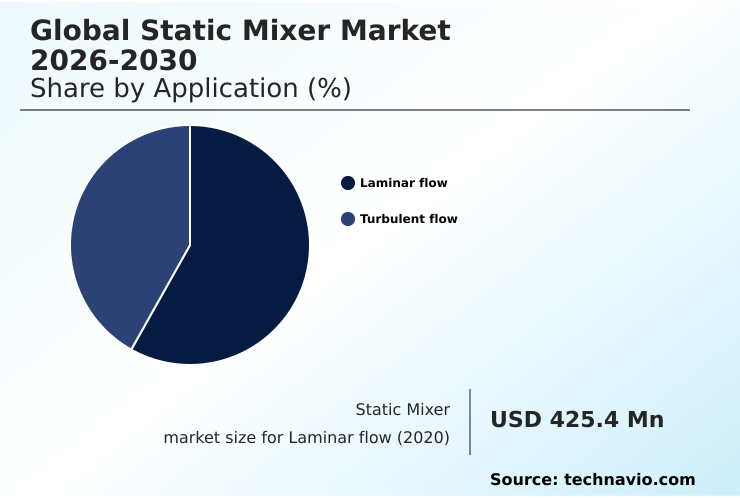
The Laminar flow segment was valued at USD 508.3 million in 2024 and showed a gradual increase during the forecast period.

Request Free Sample

Regional Analysis

APAC is estimated to contribute 46.8% to the growth of the global market during the forecast period.Technavio’s analysts have elaborately explained the regional trends and drivers that shape the market during the forecast period.

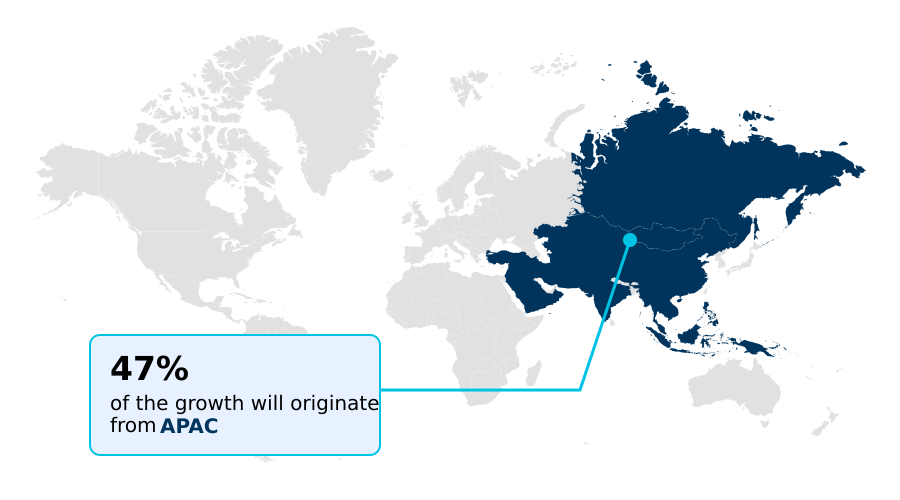
See How Static Mixer Market Demand is Rising in APAC Request Free Sample

APAC is the fastest-growing region, projected to contribute nearly 47% of the market's incremental growth, driven by industrialization and infrastructure projects in China and India.

This growth is fueled by demand in biopolymer processing and water treatment, where the fluid homogenization process is critical. In North America, the market is mature, with a focus on high-tech applications like aseptic fluid mixing.

European markets prioritize sustainability, driving innovation in hydrogen blending and gas sparging applications. The Middle East focuses on large-scale desalination and petrochemicals, requiring advanced reactor design and dosing system solutions.

Across regions, the core technology of plug flow and cross-flow mixers, used for gas-liquid dispersion and thermal homogenization, remains central for custody transfer and aseptic mixing.

Market Dynamics

Our researchers analyzed the data with 2025 as the base year, along with the key drivers, trends, and challenges. A holistic analysis of drivers will help companies refine their marketing strategies to gain a competitive advantage.

  • The strategic implementation of static mixers hinges on a deep understanding of fluid dynamics and application-specific requirements. The static mixer design for high viscosity fluids is fundamentally different from that for low-viscosity applications, creating a clear distinction between laminar vs turbulent flow static mixers.
  • A primary engineering goal is reducing pressure drop in static mixers while maximizing homogeneity, a challenge often addressed through computational fluid dynamics for mixer design. In the polymer industry, static mixers for continuous polymerization have become standard, with some facilities reporting throughput increases of over 20% compared to legacy batch systems.
  • The sanitary static mixer for food industry requires specialized materials and finishes to meet stringent hygiene regulations. Similarly, single-use mixers for biopharmaceutical applications are critical for preventing cross-contamination in aseptic processes, while low shear static mixer for biologics preserves delicate cellular structures.
  • Other key areas include optimizing mass transfer in gas-liquid mixers, the static mixer for hydrogen blending to support the energy transition, and the static mixer heat exchanger design for thermal management. Proper static mixer selection for corrosive fluids and for static mixers for non-newtonian fluids is crucial for equipment longevity.
  • For operators, troubleshooting clogging in static mixers and ensuring mixing homogeneity in laminar flow are ongoing priorities. The ability to scaling up static mixer reactors from lab to production is a key advantage, as is their use in inline blending for custody transfer and for static mixers for two component adhesives.
  • Precise helical static mixer pressure drop calculation and their role in static mixers in wastewater treatment showcase the technology's wide-ranging impact.

What are the key market drivers leading to the rise in the adoption of Static Mixer Industry?

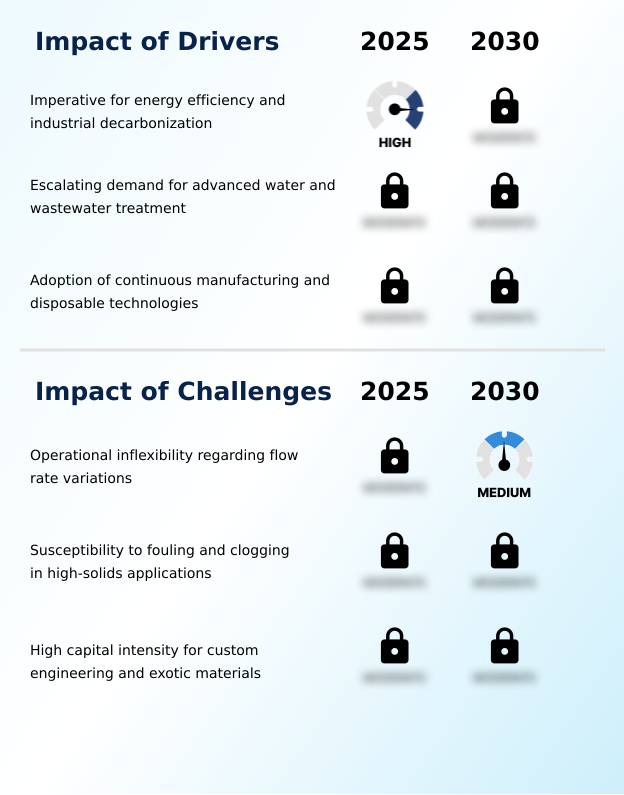
  • The industrial imperative for improved energy efficiency and progressive decarbonization is a key driver for market growth.

  • The demand for advanced water and wastewater treatment is a major driver, with turbulent flow mixers becoming standard for the flash mixing of coagulants and flocculants.
  • This wastewater chemical mixing, using a chemical dosing system or an ozone injection system, enhances mass transfer efficiency and can cut chemical usage by over 20%. As a passive mixing device, they offer significant energy savings.
  • The shift to continuous manufacturing utilizes mixers as plug-flow reactor units for precise residence time control.
  • Additionally, the growing hydrogen economy relies on this technology for safe hydrogen gas blending and inline blending, while applications in desalination and as a static aerator underscore their versatility and efficiency.

What are the market trends shaping the Static Mixer Industry?

  • The integration of additive manufacturing is enabling the creation of complex, topology-optimized geometries. This development is transforming static mixer design and production, allowing for previously unachievable performance characteristics.

  • A key trend is the use of additive manufacturing, which allows for novel sanitary design and process intensification. Paired with computational fluid dynamics, this enables the creation of custom geometries for non-newtonian fluid mixing, achieving superior radial mixing in a bioreactor or pipeline reactor. This reduces pressure drop by up to 25% compared to conventional designs.
  • Microfluidics and continuous flow chemistry are also expanding the market, requiring miniature mixers for two-component fluids. These innovations, including the wafer style mixer, are moving the industry from standard components to highly engineered, application-specific solutions, with some firms seeing a 15% increase in project wins for custom-designed systems.

What challenges does the Static Mixer Industry face during its growth?

  • Operational inflexibility with respect to variations in flow rate, also known as a limited turn-down ratio, poses a key challenge to industry growth.

  • Key challenges include operational inflexibility, such as a limited turn-down ratio, where performance degrades if the flow drops below the required Reynolds number. Another significant issue is susceptibility to fouling and clogging in slurry handling and slurry mixing applications, which necessitates frequent downtime and negates the low-maintenance benefit, increasing operational costs by up to 30% in high-solids environments.
  • This impacts the Coefficient of Variation and blend consistency. The high cost of corrosion-resistant alloys for specialized units, like a heat exchanger mixer or for gas-liquid contacting and powder-liquid dispersion, creates a high capital barrier. Designs like structured packing and open-channel mixing systems attempt to mitigate some of these issues, but challenges remain.

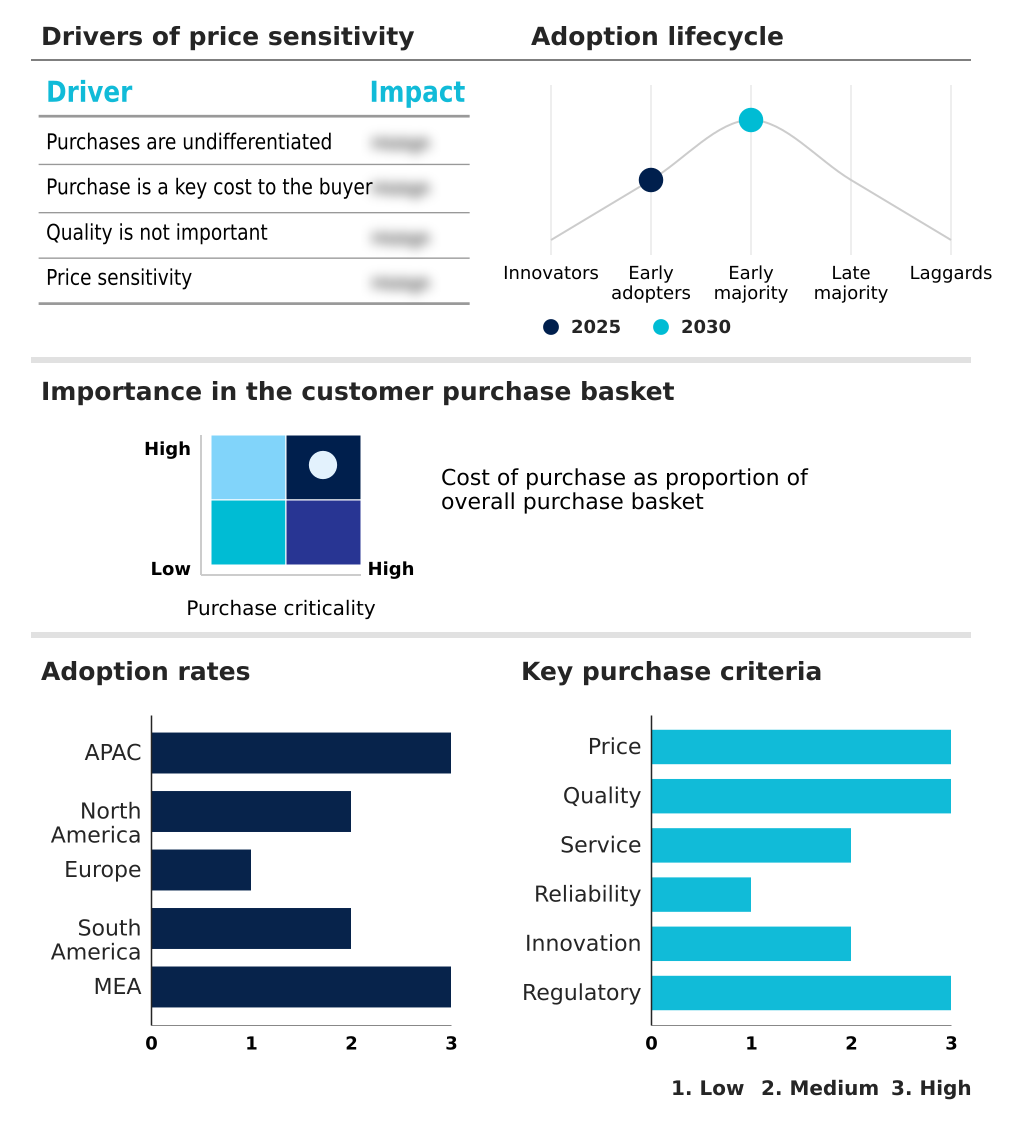
Exclusive Technavio Analysis on Customer Landscape

The static mixer market forecasting report includes the adoption lifecycle of the market, covering from the innovator’s stage to the laggard’s stage. It focuses on adoption rates in different regions based on penetration. Furthermore, the static mixer market report also includes key purchase criteria and drivers of price sensitivity to help companies evaluate and develop their market growth analysis strategies.

Customer Landscape of Static Mixer Industry

Competitive Landscape

Companies are implementing various strategies, such as strategic alliances, static mixer market forecast, partnerships, mergers and acquisitions, geographical expansion, and product/service launches, to enhance their presence in the industry.

Admix Inc. - Offers engineered mass transfer and static mixing technologies, focusing on petrochemical, refining, and biopolymer solutions through its Chemtech division, delivering structured and helical equipment.

The industry research and growth report includes detailed analyses of the competitive landscape of the market and information about key companies, including:

  • Admix Inc.
  • Antylia Scientific
  • Eesiflo Technologies Inc.
  • Flexachem
  • Fuel Tech Inc.
  • Koflo Corp.
  • Komax Systems
  • Lenntech BV
  • Mott Corp.
  • NanTong Hennly Machinery Co. Ltd.
  • Nordson Corp.
  • NOV Inc.
  • Primix BV
  • SPX FLOW Inc.
  • Stamixco AG
  • Statiflo Group
  • Sulzer Ltd.
  • Verder Liquids
  • Westfall Manufacturing Co.
  • ZelenTech Pte Ltd.

Qualitative and quantitative analysis of companies has been conducted to help clients understand the wider business environment as well as the strengths and weaknesses of key industry players. Data is qualitatively analyzed to categorize companies as pure play, category-focused, industry-focused, and diversified; it is quantitatively analyzed to categorize companies as dominant, leading, strong, tentative, and weak.

Recent Development and News in Static mixer market

  • In August 2024, IDEX Corp. completed its acquisition of Mott Corp., integrating precision filtration and flow control expertise to enhance its portfolio of specialized fluidic subsystems.
  • In January 2025, Nordson EFD launched a new series of high-efficiency disposable static mixers engineered for two-component fluid dispensing in electronics assembly and life sciences.
  • In February 2025, a European energy consortium announced the deployment of high-pressure static mixing units in the North Sea gas network to facilitate the blending of green hydrogen with natural gas.
  • In March 2025, a prominent flow control technology provider introduced a smart static mixing unit with integrated IoT sensors and edge computing to monitor mixing homogeneity in real time.

Dive into Technavio’s robust research methodology, blending expert interviews, extensive data synthesis, and validated models for unparalleled Static Mixer Market insights. See full methodology.

Market Scope
Page number 300
Base year 2025
Historic period 2020-2024
Forecast period 2026-2030
Growth momentum & CAGR Accelerate at a CAGR of 4.6%
Market growth 2026-2030 USD 227.4 million
Market structure Fragmented
YoY growth 2025-2026(%) 4.4%
Key countries China, India, Japan, South Korea, Australia, Indonesia, US, Canada, Mexico, UK, Germany, France, Italy, Spain, The Netherlands, Brazil, Argentina, Chile, Saudi Arabia, South Africa, UAE, Egypt and Nigeria
Competitive landscape Leading Companies, Market Positioning of Companies, Competitive Strategies, and Industry Risks

Request Free Sample

Research Analyst Overview

  • The Static Mixer Market is evolving from a supplier of standard components to a provider of highly engineered solutions for process intensification. This shift is driven by the need for precise residence time control and superior homogenization in complex processes.
  • Advanced computational fluidodynamics allows for custom reactor design of helical elements and other geometries, optimizing performance for specific viscosity and Reynolds number conditions. In applications like gas-liquid dispersion, this can lead to a 30% improvement in mass transfer efficiency.
  • Boardroom decisions are increasingly influenced by the technology's ability to handle challenging media, from slurry handling to aseptic mixing of two-component fluids, and its role in desalination and achieving a low Coefficient of Variation. The use of corrosion-resistant alloys for harsh environments and the adoption of single-use technology in biopharma are key investment areas.
  • The move toward sanitary design and inline blending for custody transfer also highlights the market's alignment with stringent regulatory and quality standards, impacting CAPEX planning for plug flow systems, heat exchangers, dosing systems, and managing fouling and clogging and thermal homogenization.

What are the Key Data Covered in this Static Mixer Market Research and Growth Report?

  • What is the expected growth of the Static Mixer Market between 2026 and 2030?

    • USD 227.4 million, at a CAGR of 4.6%

  • What segmentation does the market report cover?

    • The report is segmented by Application (Laminar flow, and Turbulent flow), End-user (Oil and gas, Chemical and petrochemical, Food and beverage, Water and wastewater, and Others), Distribution Channel (OEMs, Third-party distributors, and Online retail) and Geography (APAC, North America, Europe, South America, Middle East and Africa)

  • Which regions are analyzed in the report?

    • APAC, North America, Europe, South America and Middle East and Africa

  • What are the key growth drivers and market challenges?

    • Imperative for energy efficiency and industrial decarbonization, Operational inflexibility regarding flow rate variations

  • Who are the major players in the Static Mixer Market?

    • Admix Inc., Antylia Scientific, Eesiflo Technologies Inc., Flexachem, Fuel Tech Inc., Koflo Corp., Komax Systems, Lenntech BV, Mott Corp., NanTong Hennly Machinery Co. Ltd., Nordson Corp., NOV Inc., Primix BV, SPX FLOW Inc., Stamixco AG, Statiflo Group, Sulzer Ltd., Verder Liquids, Westfall Manufacturing Co. and ZelenTech Pte Ltd.

Market Research Insights

  • The market is driven by the efficiency of a passive mixing device in various applications, from wastewater chemical mixing to biopolymer processing. The adoption of a chemical dosing system with static mixers can improve accuracy by over 15%, reducing waste. Similarly, implementing an ozone injection system with proper mixing improves disinfection efficiency by up to 25%.
  • Technologies like the heat exchanger mixer and disposable mixer nozzle address specific industrial needs, with the latter seeing rapid adoption in adhesive dispensing system and aseptic fluid mixing scenarios. The push for continuous flow chemistry and better gas-liquid contacting in pipeline reactor setups further propels demand. These advancements confirm the technology’s value in optimizing complex processes.

We can help! Our analysts can customize this static mixer market research report to meet your requirements.

Get in touch

1. Executive Summary

1.1 Market overview

Executive Summary - Chart on Market Overview
Executive Summary - Data Table on Market Overview
Executive Summary - Chart on Global Market Characteristics
Executive Summary - Chart on Market by Geography
Executive Summary - Chart on Market Segmentation by Application
Executive Summary - Chart on Market Segmentation by End-user
Executive Summary - Chart on Market Segmentation by Distribution Channel
Executive Summary - Chart on Incremental Growth
Executive Summary - Data Table on Incremental Growth
Executive Summary - Chart on Company Market Positioning

2. Technavio Analysis

2.1 Analysis of price sensitivity, lifecycle, customer purchase basket, adoption rates, and purchase criteria

2.2 Criticality of inputs and Factors of differentiation

Chart on Overview on criticality of inputs and factors of differentiation

2.3 Factors of disruption

Chart on Overview on factors of disruption

2.4 Impact of drivers and challenges

Chart on Impact of drivers and challenges in 2025 and 2030

3. Market Landscape

3.1 Market ecosystem

Chart on Parent Market
Data Table on - Parent Market

3.2 Market characteristics

Chart on Market characteristics analysis

3.3 Value chain analysis

Chart on Value chain analysis

4. Market Sizing

4.1 Market definition

Data Table on Offerings of companies included in the market definition

4.2 Market segment analysis

Market segments

4.3 Market size 2025

4.4 Market outlook: Forecast for 2025-2030

Chart on Global - Market size and forecast 2025-2030 ($ million)
Data Table on Global - Market size and forecast 2025-2030 ($ million)
Chart on Global Market: Year-over-year growth 2025-2030 (%)
Data Table on Global Market: Year-over-year growth 2025-2030 (%)

5. Historic Market Size

5.1 Global Static Mixer Market 2020 - 2024

Historic Market Size - Data Table on Global Static Mixer Market 2020 - 2024 ($ million)

5.2 Application segment analysis 2020 - 2024

Historic Market Size - Application Segment 2020 - 2024 ($ million)

5.3 End-user segment analysis 2020 - 2024

Historic Market Size - End-user Segment 2020 - 2024 ($ million)

5.4 Distribution Channel segment analysis 2020 - 2024

Historic Market Size - Distribution Channel Segment 2020 - 2024 ($ million)

5.5 Geography segment analysis 2020 - 2024

Historic Market Size - Geography Segment 2020 - 2024 ($ million)

5.6 Country segment analysis 2020 - 2024

Historic Market Size - Country Segment 2020 - 2024 ($ million)

6. Qualitative Analysis

6.1 Impact of AI in global static mixer market

7. Five Forces Analysis

7.1 Five forces summary

Five forces analysis - Comparison between 2025 and 2030

7.2 Bargaining power of buyers

Bargaining power of buyers - Impact of key factors 2025 and 2030

7.3 Bargaining power of suppliers

Bargaining power of suppliers - Impact of key factors in 2025 and 2030

7.4 Threat of new entrants

Threat of new entrants - Impact of key factors in 2025 and 2030

7.5 Threat of substitutes

Threat of substitutes - Impact of key factors in 2025 and 2030

7.6 Threat of rivalry

Threat of rivalry - Impact of key factors in 2025 and 2030

7.7 Market condition

Chart on Market condition - Five forces 2025 and 2030

8. Market Segmentation by Application

8.1 Market segments

Chart on Application - Market share 2025-2030 (%)
Data Table on Application - Market share 2025-2030 (%)

8.2 Comparison by Application

Chart on Comparison by Application
Data Table on Comparison by Application

8.3 Laminar flow - Market size and forecast 2025-2030

Chart on Laminar flow - Market size and forecast 2025-2030 ($ million)
Data Table on Laminar flow - Market size and forecast 2025-2030 ($ million)
Chart on Laminar flow - Year-over-year growth 2025-2030 (%)
Data Table on Laminar flow - Year-over-year growth 2025-2030 (%)

8.4 Turbulent flow - Market size and forecast 2025-2030

Chart on Turbulent flow - Market size and forecast 2025-2030 ($ million)
Data Table on Turbulent flow - Market size and forecast 2025-2030 ($ million)
Chart on Turbulent flow - Year-over-year growth 2025-2030 (%)
Data Table on Turbulent flow - Year-over-year growth 2025-2030 (%)

8.5 Market opportunity by Application

Market opportunity by Application ($ million)
Data Table on Market opportunity by Application ($ million)

9. Market Segmentation by End-user

9.1 Market segments

Chart on End-user - Market share 2025-2030 (%)
Data Table on End-user - Market share 2025-2030 (%)

9.2 Comparison by End-user

Chart on Comparison by End-user
Data Table on Comparison by End-user

9.3 Oil and gas - Market size and forecast 2025-2030

Chart on Oil and gas - Market size and forecast 2025-2030 ($ million)
Data Table on Oil and gas - Market size and forecast 2025-2030 ($ million)
Chart on Oil and gas - Year-over-year growth 2025-2030 (%)
Data Table on Oil and gas - Year-over-year growth 2025-2030 (%)

9.4 Chemical and petrochemical - Market size and forecast 2025-2030

Chart on Chemical and petrochemical - Market size and forecast 2025-2030 ($ million)
Data Table on Chemical and petrochemical - Market size and forecast 2025-2030 ($ million)
Chart on Chemical and petrochemical - Year-over-year growth 2025-2030 (%)
Data Table on Chemical and petrochemical - Year-over-year growth 2025-2030 (%)

9.5 Food and beverage - Market size and forecast 2025-2030

Chart on Food and beverage - Market size and forecast 2025-2030 ($ million)
Data Table on Food and beverage - Market size and forecast 2025-2030 ($ million)
Chart on Food and beverage - Year-over-year growth 2025-2030 (%)
Data Table on Food and beverage - Year-over-year growth 2025-2030 (%)

9.6 Water and wastewater - Market size and forecast 2025-2030

Chart on Water and wastewater - Market size and forecast 2025-2030 ($ million)
Data Table on Water and wastewater - Market size and forecast 2025-2030 ($ million)
Chart on Water and wastewater - Year-over-year growth 2025-2030 (%)
Data Table on Water and wastewater - Year-over-year growth 2025-2030 (%)

9.7 Others - Market size and forecast 2025-2030

Chart on Others - Market size and forecast 2025-2030 ($ million)
Data Table on Others - Market size and forecast 2025-2030 ($ million)
Chart on Others - Year-over-year growth 2025-2030 (%)
Data Table on Others - Year-over-year growth 2025-2030 (%)

9.8 Market opportunity by End-user

Market opportunity by End-user ($ million)
Data Table on Market opportunity by End-user ($ million)

10. Market Segmentation by Distribution Channel

10.1 Market segments

Chart on Distribution Channel - Market share 2025-2030 (%)
Data Table on Distribution Channel - Market share 2025-2030 (%)

10.2 Comparison by Distribution Channel

Chart on Comparison by Distribution Channel
Data Table on Comparison by Distribution Channel

10.3 OEMs - Market size and forecast 2025-2030

Chart on OEMs - Market size and forecast 2025-2030 ($ million)
Data Table on OEMs - Market size and forecast 2025-2030 ($ million)
Chart on OEMs - Year-over-year growth 2025-2030 (%)
Data Table on OEMs - Year-over-year growth 2025-2030 (%)

10.4 Third-party distributors - Market size and forecast 2025-2030

Chart on Third-party distributors - Market size and forecast 2025-2030 ($ million)
Data Table on Third-party distributors - Market size and forecast 2025-2030 ($ million)
Chart on Third-party distributors - Year-over-year growth 2025-2030 (%)
Data Table on Third-party distributors - Year-over-year growth 2025-2030 (%)

10.5 Online retail - Market size and forecast 2025-2030

Chart on Online retail - Market size and forecast 2025-2030 ($ million)
Data Table on Online retail - Market size and forecast 2025-2030 ($ million)
Chart on Online retail - Year-over-year growth 2025-2030 (%)
Data Table on Online retail - Year-over-year growth 2025-2030 (%)

10.6 Market opportunity by Distribution Channel

Market opportunity by Distribution Channel ($ million)
Data Table on Market opportunity by Distribution Channel ($ million)

11. Customer Landscape

11.1 Customer landscape overview

Analysis of price sensitivity, lifecycle, customer purchase basket, adoption rates, and purchase criteria

12. Geographic Landscape

12.1 Geographic segmentation

Chart on Market share by geography 2025-2030 (%)
Data Table on Market share by geography 2025-2030 (%)

12.2 Geographic comparison

Chart on Geographic comparison
Data Table on Geographic comparison

12.3 APAC - Market size and forecast 2025-2030

Chart on APAC - Market size and forecast 2025-2030 ($ million)
Data Table on APAC - Market size and forecast 2025-2030 ($ million)
Chart on APAC - Year-over-year growth 2025-2030 (%)
Data Table on APAC - Year-over-year growth 2025-2030 (%)
Chart on Regional Comparison - APAC
Data Table on Regional Comparison - APAC

12.3.1 China - Market size and forecast 2025-2030

Chart on China - Market size and forecast 2025-2030 ($ million)
Data Table on China - Market size and forecast 2025-2030 ($ million)
Chart on China - Year-over-year growth 2025-2030 (%)
Data Table on China - Year-over-year growth 2025-2030 (%)

12.3.2 India - Market size and forecast 2025-2030

Chart on India - Market size and forecast 2025-2030 ($ million)
Data Table on India - Market size and forecast 2025-2030 ($ million)
Chart on India - Year-over-year growth 2025-2030 (%)
Data Table on India - Year-over-year growth 2025-2030 (%)

12.3.3 Japan - Market size and forecast 2025-2030

Chart on Japan - Market size and forecast 2025-2030 ($ million)
Data Table on Japan - Market size and forecast 2025-2030 ($ million)
Chart on Japan - Year-over-year growth 2025-2030 (%)
Data Table on Japan - Year-over-year growth 2025-2030 (%)

12.3.4 South Korea - Market size and forecast 2025-2030

Chart on South Korea - Market size and forecast 2025-2030 ($ million)
Data Table on South Korea - Market size and forecast 2025-2030 ($ million)
Chart on South Korea - Year-over-year growth 2025-2030 (%)
Data Table on South Korea - Year-over-year growth 2025-2030 (%)

12.3.5 Australia - Market size and forecast 2025-2030

Chart on Australia - Market size and forecast 2025-2030 ($ million)
Data Table on Australia - Market size and forecast 2025-2030 ($ million)
Chart on Australia - Year-over-year growth 2025-2030 (%)
Data Table on Australia - Year-over-year growth 2025-2030 (%)

12.3.6 Indonesia - Market size and forecast 2025-2030

Chart on Indonesia - Market size and forecast 2025-2030 ($ million)
Data Table on Indonesia - Market size and forecast 2025-2030 ($ million)
Chart on Indonesia - Year-over-year growth 2025-2030 (%)
Data Table on Indonesia - Year-over-year growth 2025-2030 (%)

12.4 North America - Market size and forecast 2025-2030

Chart on North America - Market size and forecast 2025-2030 ($ million)
Data Table on North America - Market size and forecast 2025-2030 ($ million)
Chart on North America - Year-over-year growth 2025-2030 (%)
Data Table on North America - Year-over-year growth 2025-2030 (%)
Chart on Regional Comparison - North America
Data Table on Regional Comparison - North America

12.4.1 US - Market size and forecast 2025-2030

Chart on US - Market size and forecast 2025-2030 ($ million)
Data Table on US - Market size and forecast 2025-2030 ($ million)
Chart on US - Year-over-year growth 2025-2030 (%)
Data Table on US - Year-over-year growth 2025-2030 (%)

12.4.2 Canada - Market size and forecast 2025-2030

Chart on Canada - Market size and forecast 2025-2030 ($ million)
Data Table on Canada - Market size and forecast 2025-2030 ($ million)
Chart on Canada - Year-over-year growth 2025-2030 (%)
Data Table on Canada - Year-over-year growth 2025-2030 (%)

12.4.3 Mexico - Market size and forecast 2025-2030

Chart on Mexico - Market size and forecast 2025-2030 ($ million)
Data Table on Mexico - Market size and forecast 2025-2030 ($ million)
Chart on Mexico - Year-over-year growth 2025-2030 (%)
Data Table on Mexico - Year-over-year growth 2025-2030 (%)

12.5 Europe - Market size and forecast 2025-2030

Chart on Europe - Market size and forecast 2025-2030 ($ million)
Data Table on Europe - Market size and forecast 2025-2030 ($ million)
Chart on Europe - Year-over-year growth 2025-2030 (%)
Data Table on Europe - Year-over-year growth 2025-2030 (%)
Chart on Regional Comparison - Europe
Data Table on Regional Comparison - Europe

12.5.1 UK - Market size and forecast 2025-2030

Chart on UK - Market size and forecast 2025-2030 ($ million)
Data Table on UK - Market size and forecast 2025-2030 ($ million)
Chart on UK - Year-over-year growth 2025-2030 (%)
Data Table on UK - Year-over-year growth 2025-2030 (%)

12.5.2 Germany - Market size and forecast 2025-2030

Chart on Germany - Market size and forecast 2025-2030 ($ million)
Data Table on Germany - Market size and forecast 2025-2030 ($ million)
Chart on Germany - Year-over-year growth 2025-2030 (%)
Data Table on Germany - Year-over-year growth 2025-2030 (%)

12.5.3 France - Market size and forecast 2025-2030

Chart on France - Market size and forecast 2025-2030 ($ million)
Data Table on France - Market size and forecast 2025-2030 ($ million)
Chart on France - Year-over-year growth 2025-2030 (%)
Data Table on France - Year-over-year growth 2025-2030 (%)

12.5.4 Italy - Market size and forecast 2025-2030

Chart on Italy - Market size and forecast 2025-2030 ($ million)
Data Table on Italy - Market size and forecast 2025-2030 ($ million)
Chart on Italy - Year-over-year growth 2025-2030 (%)
Data Table on Italy - Year-over-year growth 2025-2030 (%)

12.5.5 Spain - Market size and forecast 2025-2030

Chart on Spain - Market size and forecast 2025-2030 ($ million)
Data Table on Spain - Market size and forecast 2025-2030 ($ million)
Chart on Spain - Year-over-year growth 2025-2030 (%)
Data Table on Spain - Year-over-year growth 2025-2030 (%)

12.5.6 The Netherlands - Market size and forecast 2025-2030

Chart on The Netherlands - Market size and forecast 2025-2030 ($ million)
Data Table on The Netherlands - Market size and forecast 2025-2030 ($ million)
Chart on The Netherlands - Year-over-year growth 2025-2030 (%)
Data Table on The Netherlands - Year-over-year growth 2025-2030 (%)

12.6 South America - Market size and forecast 2025-2030

Chart on South America - Market size and forecast 2025-2030 ($ million)
Data Table on South America - Market size and forecast 2025-2030 ($ million)
Chart on South America - Year-over-year growth 2025-2030 (%)
Data Table on South America - Year-over-year growth 2025-2030 (%)
Chart on Regional Comparison - South America
Data Table on Regional Comparison - South America

12.6.1 Brazil - Market size and forecast 2025-2030

Chart on Brazil - Market size and forecast 2025-2030 ($ million)
Data Table on Brazil - Market size and forecast 2025-2030 ($ million)
Chart on Brazil - Year-over-year growth 2025-2030 (%)
Data Table on Brazil - Year-over-year growth 2025-2030 (%)

12.6.2 Argentina - Market size and forecast 2025-2030

Chart on Argentina - Market size and forecast 2025-2030 ($ million)
Data Table on Argentina - Market size and forecast 2025-2030 ($ million)
Chart on Argentina - Year-over-year growth 2025-2030 (%)
Data Table on Argentina - Year-over-year growth 2025-2030 (%)

12.6.3 Chile - Market size and forecast 2025-2030

Chart on Chile - Market size and forecast 2025-2030 ($ million)
Data Table on Chile - Market size and forecast 2025-2030 ($ million)
Chart on Chile - Year-over-year growth 2025-2030 (%)
Data Table on Chile - Year-over-year growth 2025-2030 (%)

12.7 Middle East and Africa - Market size and forecast 2025-2030

Chart on Middle East and Africa - Market size and forecast 2025-2030 ($ million)
Data Table on Middle East and Africa - Market size and forecast 2025-2030 ($ million)
Chart on Middle East and Africa - Year-over-year growth 2025-2030 (%)
Data Table on Middle East and Africa - Year-over-year growth 2025-2030 (%)
Chart on Regional Comparison - Middle East and Africa
Data Table on Regional Comparison - Middle East and Africa

12.7.1 Saudi Arabia - Market size and forecast 2025-2030

Chart on Saudi Arabia - Market size and forecast 2025-2030 ($ million)
Data Table on Saudi Arabia - Market size and forecast 2025-2030 ($ million)
Chart on Saudi Arabia - Year-over-year growth 2025-2030 (%)
Data Table on Saudi Arabia - Year-over-year growth 2025-2030 (%)

12.7.2 South Africa - Market size and forecast 2025-2030

Chart on South Africa - Market size and forecast 2025-2030 ($ million)
Data Table on South Africa - Market size and forecast 2025-2030 ($ million)
Chart on South Africa - Year-over-year growth 2025-2030 (%)
Data Table on South Africa - Year-over-year growth 2025-2030 (%)

12.7.3 UAE - Market size and forecast 2025-2030

Chart on UAE - Market size and forecast 2025-2030 ($ million)
Data Table on UAE - Market size and forecast 2025-2030 ($ million)
Chart on UAE - Year-over-year growth 2025-2030 (%)
Data Table on UAE - Year-over-year growth 2025-2030 (%)

12.7.4 Egypt - Market size and forecast 2025-2030

Chart on Egypt - Market size and forecast 2025-2030 ($ million)
Data Table on Egypt - Market size and forecast 2025-2030 ($ million)
Chart on Egypt - Year-over-year growth 2025-2030 (%)
Data Table on Egypt - Year-over-year growth 2025-2030 (%)

12.7.5 Nigeria - Market size and forecast 2025-2030

Chart on Nigeria - Market size and forecast 2025-2030 ($ million)
Data Table on Nigeria - Market size and forecast 2025-2030 ($ million)
Chart on Nigeria - Year-over-year growth 2025-2030 (%)
Data Table on Nigeria - Year-over-year growth 2025-2030 (%)

12.8 Market opportunity by geography

Market opportunity by geography ($ million)
Data Tables on Market opportunity by geography ($ million)

13. Drivers, Challenges, and Opportunity

13.1 Market drivers

Imperative for energy efficiency and industrial decarbonization
Escalating demand for advanced water and wastewater treatment
Adoption of continuous manufacturing and disposable technologies

13.2 Market challenges

Operational inflexibility regarding flow rate variations
Susceptibility to fouling and clogging in high-solids applications
High capital intensity for custom engineering and exotic materials

13.3 Impact of drivers and challenges

Impact of drivers and challenges in 2025 and 2030

13.4 Market opportunities

Integration of additive manufacturing for complex geometries
Convergence of static mixing with digital monitoring systems
Miniaturization for microfluidics and precision dispensing

14. Competitive Landscape

14.1 Overview

14.2

Overview on criticality of inputs and factors of differentiation

14.3 Landscape disruption

Overview on factors of disruption

14.4 Industry risks

Impact of key risks on business

15. Competitive Analysis

15.1 Companies profiled

Companies covered

15.2 Company ranking index

15.3 Market positioning of companies

Matrix on companies position and classification

15.4 Antylia Scientific

Antylia Scientific - Overview
Antylia Scientific - Product / Service
Antylia Scientific - Key offerings
SWOT

15.5 Fuel Tech Inc.

Fuel Tech Inc. - Overview
Fuel Tech Inc. - Business segments
Fuel Tech Inc. - Key offerings
Fuel Tech Inc. - Segment focus
SWOT

15.6 Koflo Corp.

Koflo Corp. - Overview
Koflo Corp. - Product / Service
Koflo Corp. - Key offerings
SWOT

15.7 Komax Systems

Komax Systems - Overview
Komax Systems - Product / Service
Komax Systems - Key offerings
SWOT

15.8 Lenntech BV

Lenntech BV - Overview
Lenntech BV - Product / Service
Lenntech BV - Key offerings
SWOT

15.9 Mott Corp.

Mott Corp. - Overview
Mott Corp. - Product / Service
Mott Corp. - Key offerings
SWOT

15.10 Nordson Corp.

Nordson Corp. - Overview
Nordson Corp. - Business segments
Nordson Corp. - Key news
Nordson Corp. - Key offerings
Nordson Corp. - Segment focus
SWOT

15.11 NOV Inc.

NOV Inc. - Overview
NOV Inc. - Business segments
NOV Inc. - Key news
NOV Inc. - Key offerings
NOV Inc. - Segment focus
SWOT

15.12 Primix BV

Primix BV - Overview
Primix BV - Product / Service
Primix BV - Key offerings
SWOT

15.13 SPX FLOW Inc.

SPX FLOW Inc. - Overview
SPX FLOW Inc. - Product / Service
SPX FLOW Inc. - Key news
SPX FLOW Inc. - Key offerings
SWOT

15.14 Stamixco AG

Stamixco AG - Overview
Stamixco AG - Product / Service
Stamixco AG - Key offerings
SWOT

15.15 Statiflo Group

Statiflo Group - Overview
Statiflo Group - Product / Service
Statiflo Group - Key offerings
SWOT

15.16 Sulzer Ltd.

Sulzer Ltd. - Overview
Sulzer Ltd. - Business segments
Sulzer Ltd. - Key news
Sulzer Ltd. - Key offerings
Sulzer Ltd. - Segment focus
SWOT

15.17 Verder Liquids

Verder Liquids - Overview
Verder Liquids - Product / Service
Verder Liquids - Key offerings
SWOT

15.18 Westfall Manufacturing Co.

Westfall Manufacturing Co. - Overview
Westfall Manufacturing Co. - Product / Service
Westfall Manufacturing Co. - Key offerings
SWOT

16. Appendix

16.1 Scope of the report

Market definition
Objectives
Notes and caveats

16.2 Inclusions and exclusions checklist

Inclusions checklist
Exclusions checklist

16.3 Currency conversion rates for US$

16.4 Research methodology

16.5 Data procurement

Information sources

16.6 Data validation

16.7 Validation techniques employed for market sizing

16.8 Data synthesis

16.9 360 degree market analysis

16.10 List of abbreviations

Research Methodology

Technavio presents a detailed picture of the market by way of study, synthesis, and summation of data from multiple sources. The analysts have presented the various facets of the market with a particular focus on identifying the key industry influencers. The data thus presented is comprehensive, reliable, and the result of extensive research, both primary and secondary.

INFORMATION SOURCES

Primary sources

  • Manufacturers and suppliers
  • Channel partners
  • Industry experts
  • Strategic decision makers

Secondary sources

  • Industry journals and periodicals
  • Government data
  • Financial reports of key industry players
  • Historical data
  • Press releases

DATA ANALYSIS

Data Synthesis

  • Collation of data
  • Estimation of key figures
  • Analysis of derived insights

Data Validation

  • Triangulation with data models
  • Reference against proprietary databases
  • Corroboration with industry experts

REPORT WRITING

Qualitative

  • Market drivers
  • Market challenges
  • Market trends
  • Five forces analysis

Quantitative

  • Market size and forecast
  • Market segmentation
  • Geographical insights
  • Competitive landscape

Interested in this report?

Get your sample now to see our research methodology and insights!

Download Now

Frequently Asked Questions

Static Mixer market growth will increase by USD 227.4 million during 2026-2030.

The Static Mixer market is expected to grow at a CAGR of 4.6% during 2026-2030.

Static Mixer market is segmented by Application (Laminar flow, Turbulent flow) End-user (Oil and gas, Chemical and petrochemical, Food and beverage, Water and wastewater, Others) Distribution channel (OEMs, Third-party distributors, Online retail)

Admix Inc., Antylia Scientific, Eesiflo Technologies Inc., Flexachem, Fuel Tech Inc., Koflo Corp., Komax Systems, Lenntech BV, Mott Corp., NanTong Hennly Machinery Co. Ltd., Nordson Corp., NOV Inc., Primix BV, SPX FLOW Inc., Stamixco AG, Statiflo Group, Sulzer Ltd., Verder Liquids, Westfall Manufacturing Co., ZelenTech Pte Ltd. are a few of the key vendors in the Static Mixer market.

APAC will register the highest growth rate of 46.8% among the other regions. Therefore, the Static Mixer market in APAC is expected to garner significant business opportunities for the vendors during the forecast period.

China, India, Japan, South Korea, Australia, Indonesia, US, Canada, Mexico, UK, Germany, France, Italy, Spain, The Netherlands, Brazil, Argentina, Chile, Saudi Arabia, South Africa, UAE, Egypt, Nigeria

  • Imperative for energy efficiency and industrial decarbonization is the driving factor this market.

The Static Mixer market vendors should focus on grabbing business opportunities from the Application segment as it accounted for the largest market share in the base year.