
US Supplements Market Size 2025-2029
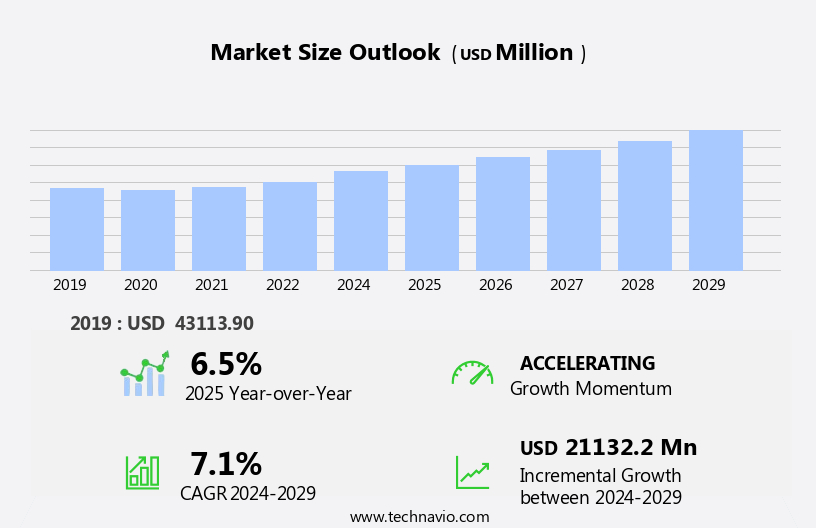
The US supplements market size is forecast to increase by USD 21.13 billion at a CAGR of 7.1% between 2024 and 2029.
- The global supplements market is experiencing significant growth, driven by rising consumer awareness and participation in health and wellness initiatives. Social media marketing has played a pivotal role in increasing the visibility of supplements, making them a popular choice among consumers seeking to improve their overall health and performance. This trend is particularly prominent in regions with a high focus on fitness and sports, such as North America and Europe. However, market growth is not without challenges. Stringent government regulations governing the production and marketing of supplements pose significant hurdles for companies seeking to enter or expand in this market. Product forms include tablets, capsules, gummy supplements, liquids, powders, and nutraceuticals in the form of branded vitamins, herbal supplements, probiotics, fish oils, glucosamine, and enzymes.
- Compliance with these regulations requires substantial investment in research and development, as well as adherence to strict quality standards. Despite these challenges, the supplements market presents ample opportunities for companies that can navigate regulatory complexities and meet the evolving demands of health-conscious consumers. Companies that prioritize innovation, transparency, and sustainability are best positioned to capitalize on this growing market and establish a strong competitive advantage.
What will be the size of the US Supplements Market during the forecast period?
- The market in the US is experiencing significant growth, driven by health-conscious consumers seeking to optimize their athletic performance, cognitive function, and prevent chronic diseases. Safety standards, FDA regulations, and GMP certification are key considerations for companies in this industry. Subscription models and e-commerce platforms are transforming how consumers access supplements, from functional foods to vegan options. Label claims, dosage recommendations, and absorption rates are critical factors influencing purchasing decisions. Safety and quality are paramount, with manufacturing processes, ingredient sourcing, and third-party testing ensuring efficacy and consumer trust. The regulatory landscape continues to evolve, with ongoing discussions around dosage recommendations, ingredient labeling, and FDA regulations.
- The nutraceuticals market encompasses a diverse range of products, including dietary supplements, herbal remedies, and functional foods, catering to various consumer segments. The aging population's demand for energy boosting, sleep aid, immune support, and preventive healthcare supplements is on the rise. Market dynamics include a focus on scientific evidence, consumer education, and transparency. Weight management, muscle building, and clinical trials are ongoing areas of research, while organic supplements and efficacy studies continue to gain popularity. The market trends towards functional foods, cognitive function, and preventive healthcare, with a growing emphasis on ingredient sourcing and manufacturing processes that prioritize quality control.
How is this market segmented?
The market research report provides comprehensive data (region-wise segment analysis), with forecasts and estimates in "USD million" for the period 2025-2029, as well as historical data from 2019-2023 for the following segments.
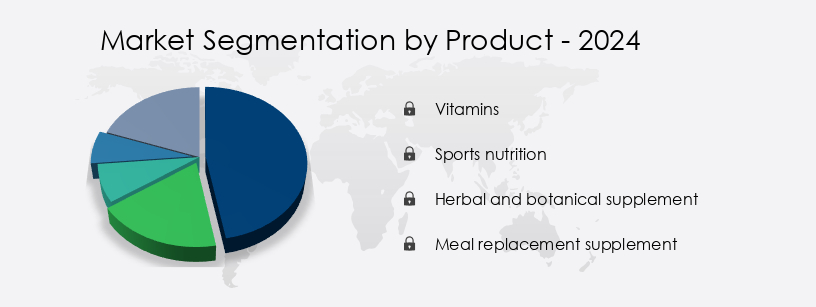
- Product
- Vitamins
- Sports nutrition
- Herbal and botanical supplement
- Meal replacement supplement
- Distribution Channel
- Retail outlets
- Online stores
- End-user
- Adults
- Elderly population
- Children and adolescents
- Formulation
- Capsules
- Tablets
- Powders
- Liquids
- Softgels
- Geography
- North America
- US
- North America
By Product Insights
The vitamins segment is estimated to witness significant growth during the forecast period. In the health and wellness sector, US consumers are increasingly relying on dietary supplements to support their preventive healthcare regimens. Vitamin D supplements, for instance, have gained popularity among the aging population residing in states with limited sunlight exposure. This trend is driven by the growing awareness of the benefits of maintaining optimal health and well-being. Functional foods and beverages, including those fortified with essential vitamins and minerals, are also gaining traction among health-conscious consumers. E-commerce platforms facilitate the easy purchase of these products, enabling consumers to access a wide range of options from the convenience of their homes.
Quality control is a critical factor influencing consumer trust in dietary supplements. Third-party testing, GMP certification, and scientific evidence are essential for ensuring product safety and efficacy. Manufacturers are investing in advanced manufacturing processes to improve absorption rates and personalize nutrition recommendations. Sports nutrition supplements, such as protein powders, are popular among fitness enthusiasts and athletes seeking to enhance their performance. Consumer education is vital in this category, as dosage recommendations and ingredient labeling are essential for safe and effective use. The regulatory landscape plays a significant role in the dietary supplement market. FDA regulations and safety standards are crucial for ensuring product quality and consumer protection.
Transparency in ingredient sourcing and labeling is also essential for building consumer trust and loyalty. The market for dietary supplements includes a wide range of products, including herbal supplements, organic supplements, joint health supplements, and omega-3 fatty acids. These supplements cater to various health concerns, such as cognitive function, energy boosting, immune support, and weight management. In summary, the dietary supplement market in the US is driven by increasing awareness of preventive healthcare, consumer demand for convenience, and a growing aging population. Manufacturers are investing in advanced manufacturing processes and quality control measures to meet consumer expectations for safety, efficacy, and transparency.
Get a glance at the market share of various segments Request Free Sample
The Vitamins segment was valued at USD 19974.60 million in 2019 and showed a gradual increase during the forecast period.
Market Dynamics
Our researchers analyzed the data with 2024 as the base year, along with the key drivers, trends, and challenges. A holistic analysis of drivers will help companies refine their marketing strategies to gain a competitive advantage.
What are the key market drivers leading to the rise in the adoption of US Supplements Industry?
- Social media marketing plays a crucial role in driving market awareness through its ability to reach vast audiences and foster engagement. The supplement market is witnessing significant growth due to targeted marketing efforts towards potential consumer groups, particularly aged men and women. Various associations and organizations are utilizing online channels to increase awareness among end-users. Social media marketing is a key strategy for manufacturers to expand their reach and attract new consumers. With an increasing number of social network users, companies and marketers are investing more in social media platforms to boost sales and maximize profits.
- Young adults are a significant target demographic, as they can refer these products to their family members and create a high demand in the market. Companies are expected to allocate greater resources to social media marketing to capitalize on this trend.
What are the market trends shaping the US Supplements Industry?
- The current market trend underscores the importance of increased engagement in sports and fitness activities, with a growing number of individuals prioritizing health and wellness. Engaging in sports and physical activities plays a pivotal role in promoting health and wellness for both children and adults. These activities not only enhance an individual's physical fitness and overall health but also contribute to preventing childhood obesity, a significant health concern. The benefits of regular physical activity extend to reducing the risk of developing type 2 diabetes and metabolic syndrome, improving metabolism, and enhancing musculoskeletal health.
- An active individual boasts higher cardiorespiratory fitness and stronger muscles compared to their sedentary counterparts. This trend underscores the importance of incorporating physical activities into daily routines for optimal health outcomes.
What challenges does the US Supplements Industry face during its growth?
- The strict implementation of government regulations poses a significant challenge to the expansion and growth of the industry. The supplements market in the US is subject to rigorous government regulations, which pose significant challenges for market participants. Compliance with these rules and regulations, including permits, entry of new companies, residual management, and expiry dates for certain supplement products, is mandatory. The Food and Drug Administration (FDA) plays a pivotal role in regulating the manufacturing and distribution of supplements and their ingredients. In a notable development, the FDA announced plans to explore rulemaking for N-acetyl-L-cysteine (NAC) supplements in July 2024.
- This initiative aims to address regulatory uncertainties surrounding this ingredient, which was initially researched or approved as a drug. If implemented, this would mark the first time an ingredient could legally be included in dietary supplements, setting a precedent for the industry. Adhering to these regulations is essential for maintaining consumer trust and ensuring product safety and quality.
Exclusive Customer Landscape
The supplements market in US forecasting report includes the adoption lifecycle of the market, covering from the innovator's stage to the laggard's stage. It focuses on adoption rates in different regions based on penetration. Furthermore, the supplements market in US report also includes key purchase criteria and drivers of price sensitivity to help companies evaluate and develop their market growth analysis strategies.
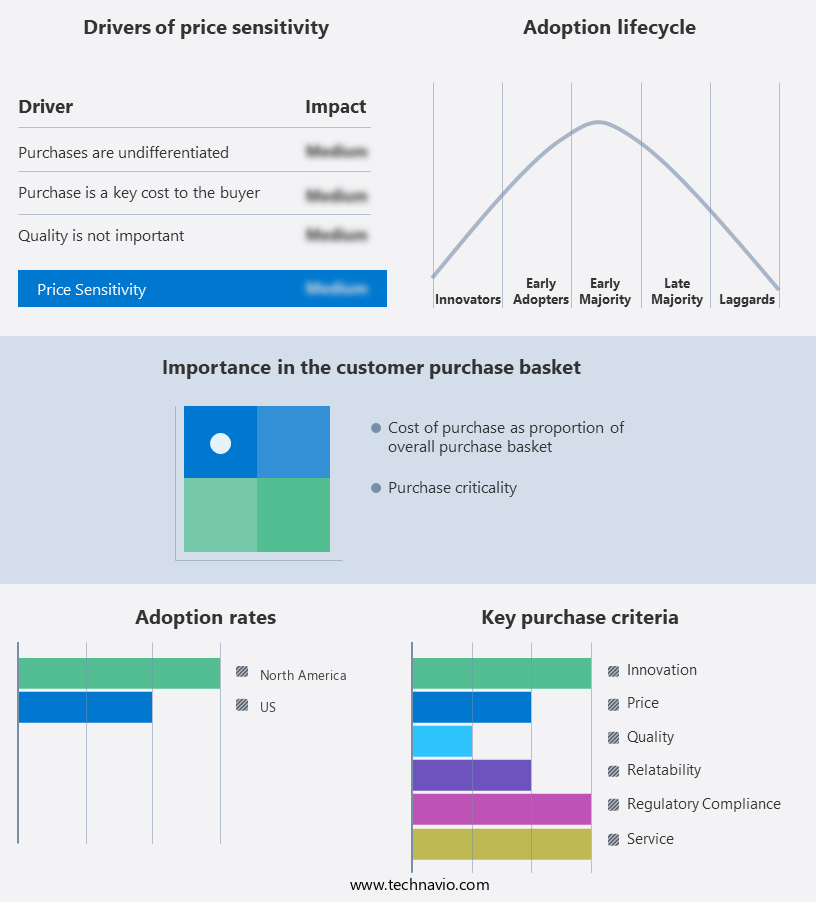
Customer Landscape
Key Companies & Market Insights
Companies are implementing various strategies, such as strategic alliances, supplements market in US forecast, partnerships, mergers and acquisitions, geographical expansion, and product/service launches, to enhance their presence in the industry.
Amway Corp. - The company offers vitamins supplements under the brand called Nutrilite.
The industry research and growth report includes detailed analyses of the competitive landscape of the market and information about key companies, including:
- Amway Corp.
- Cyanotech Corp.
- ECNutra
- Glanbia plc
- GNC Holdings LLC
- Herbalife International of America Inc.
- Liquid Health Inc.
- Lonza Group Ltd.
- Mondelez International Inc.
- Natures Bounty
- Nestle SA
- NOW Foods
- Paragon Laboratories
- Pfizer Inc.
- PipingRock Health Products LLC
- Reckitt Benckiser Group Plc
- SDC Nutrition Inc.
- Superior Supplement Manufacturing LLC
- Supplement Manufacturing Partner
- Vitakem Nutraceutical Inc.
Qualitative and quantitative analysis of companies has been conducted to help clients understand the wider business environment as well as the strengths and weaknesses of key industry players. Data is qualitatively analyzed to categorize companies as pure play, category-focused, industry-focused, and diversified; it is quantitatively analyzed to categorize companies as dominant, leading, strong, tentative, and weak.
Recent Development and News in US Supplements Market
- In February 2025, Nestle Health Science, a global leader in nutritional science, announced the launch of its new line of medical food products under the brand name, Peptamen. These supplements are designed for individuals with gastrointestinal disorders, providing essential nutrients for improved gut health (Nestle Health Science Press Release, 2025).
- In October 2024, Amway, a leading global direct selling company, entered into a strategic partnership with DSM, a Dutch science-based company active in health, nutrition, and materials. This collaboration aimed to co-create and distribute nutritional supplements and solutions, leveraging DSM's expertise in nutritional science and Amway's extensive distribution network (Amway Press Release, 2024).
- In March 2024, Danone Manifesto Ventures, a venture capital arm of Danone, invested in Ritual, a California-based vitamin company, to expand its presence in the supplement market. This investment will help Ritual accelerate its growth and expand its product offerings, catering to the increasing demand for personalized and science-backed supplements (Danone Manifesto Ventures Press Release, 2024).
- In January 2024, Glanbia Nutritionals, a global leader in nutritional solutions, acquired Probi, a Norwegian probiotics company. This acquisition will strengthen Glanbia's position in the global probiotics market, providing it with access to Probi's proprietary probiotic strains and advanced production capabilities (Glanbia Nutritionals Press Release, 2024).
Research Analyst Overview
The global supplement market continues to experience significant growth, driven by the increasing demand from fitness enthusiasts seeking to enhance their muscle building efforts and improve their overall health and wellness. E-commerce platforms have played a pivotal role in facilitating the accessibility of these products, allowing consumers to easily purchase functional foods, herbal supplements, and protein powders from the comfort of their homes. Quality control is a crucial factor in the supplement industry, with consumers placing a high emphasis on efficacy studies and scientific evidence to support the claims made on product labels. Subscription models have also gained popularity, providing consumers with regular deliveries of their preferred supplements and ensuring they maintain a consistent regimen.
Chronic diseases and cognitive function are among the key health concerns driving the demand for supplements. Sleep aid supplements have also gained significant traction, as consumers seek natural solutions to improve their rest and overall well-being. Ingredient sourcing and manufacturing processes are increasingly important considerations for health-conscious consumers, with a growing preference for organic and vegan supplements. The regulatory landscape for dietary supplements is evolving, with a focus on safety standards and third-party testing to ensure product quality and efficacy. GMP certification and ingredient labeling are essential components of this regulatory framework, ensuring that consumers have access to accurate and reliable information about the products they are purchasing.
Sports nutrition supplements have long been a staple in the industry, with a focus on energy boosting and athletic performance. However, the market is expanding to include supplements for preventive healthcare, weight management, immune support, and joint health. Omega-3 fatty acids, in particular, have gained widespread popularity due to their numerous health benefits. Personalized nutrition and dosage recommendations are becoming increasingly important in the supplement industry, as consumers seek tailored solutions to meet their unique health needs. Consumers are also demanding greater transparency and education about the supplements they are taking, with a growing interest in the scientific evidence supporting their use.
The aging population is another significant market driver, as older adults seek to maintain their health and independence through the use of dietary supplements. Vitamin D, for example, has gained widespread attention due to its role in bone health and immune function. Clinical trials and ongoing research continue to provide new insights into the potential benefits of various supplements, further fueling consumer interest and demand. The global supplement market is experiencing robust growth, driven by a combination of factors including health concerns, consumer preferences, and regulatory trends. Fitness enthusiasts, athletes, and older adults are among the key consumer groups driving demand for a wide range of supplements, from muscle builders to cognitive function enhancers.
The industry is responding with innovative products, personalized solutions, and a focus on quality and transparency, ensuring that consumers have access to effective and safe supplements to support their health and wellness goals. The Supplements Market in the US shows remarkable expansion, driven by extensive market research and growth analysis. Enhanced market growth and forecasting and precise market forecasting have identified key trends fueling this surge. Detailed market report insights reveal increasing demand for protein powder, among other products. Projections in market forecast highlight the influence of online retailers, whose growing presence has revolutionized accessibility and distribution. As more consumers turn to online retailers for convenience, this channel significantly shapes purchasing behavior. These factors, combined with evolving consumer preferences and health-conscious trends, position the supplements market for sustained growth. The interplay of data-driven strategies and innovative approaches ensures the market adapts to ever-changing dynamics while remaining highly competitive.
Dive into Technavio's robust research methodology, blending expert interviews, extensive data synthesis, and validated models for unparalleled Supplements Market in US insights. See full methodology.
|
Market Scope |
|
|
Report Coverage |
Details |
|
Page number |
200 |
|
Base year |
2024 |
|
Historic period |
2019-2023 |
|
Forecast period |
2025-2029 |
|
Growth momentum & CAGR |
Accelerate at a CAGR of 7.1% |
|
Market growth 2025-2029 |
USD 21.13 billion |
|
Market structure |
Fragmented |
|
YoY growth 2024-2025(%) |
6.5 |
|
Key countries |
US |
|
Competitive landscape |
Leading Companies, Market Positioning of Companies, Competitive Strategies, and Industry Risks |
What are the Key Data Covered in this Supplements Market in US Research and Growth Report?
- CAGR of the Supplements in US industry during the forecast period
- Detailed information on factors that will drive the growth and forecasting between 2025 and 2029
- Precise estimation of the size of the market and its contribution of the industry in focus to the parent market
- Accurate predictions about upcoming growth and trends and changes in consumer behaviour
- Growth of the market across US
- Thorough analysis of the market's competitive landscape and detailed information about companies
- Comprehensive analysis of factors that will challenge the supplements market in US growth of industry companies
We can help! Our analysts can customize this supplements market in US research report to meet your requirements.
 RIA -
RIA - 
