
Prescriptive Analytics Market Size 2025-2029
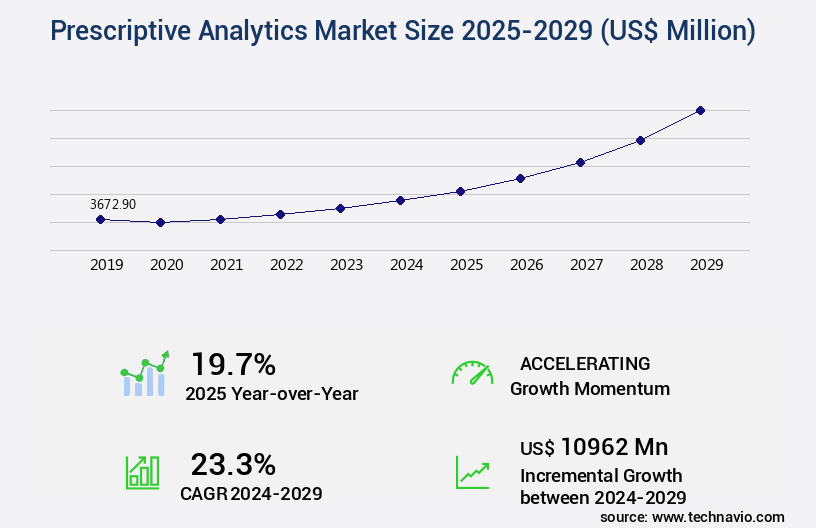
The prescriptive analytics market size is valued to increase by USD 10.96 billion, at a CAGR of 23.3% from 2024 to 2029. Rising demand for predictive analytics will drive the prescriptive analytics market.
Major Market Trends & Insights
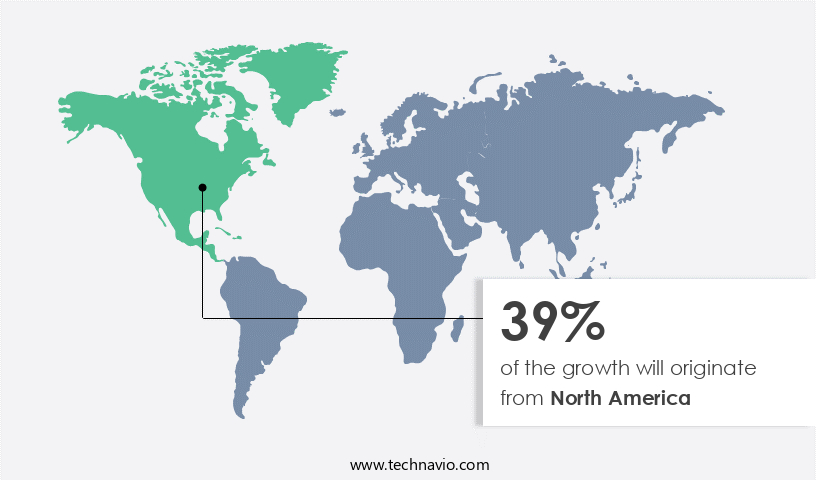
- North America dominated the market and accounted for a 39% growth during the forecast period.
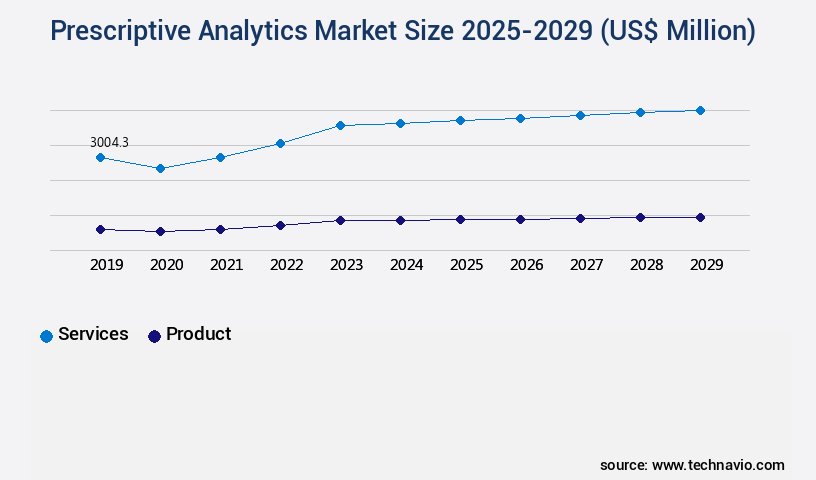
- By Solution - Services segment was valued at USD 3 billion in 2023
- By Deployment - Cloud-based segment accounted for the largest market revenue share in 2023
Market Size & Forecast
- Market Opportunities: USD 359.55 million
- Market Future Opportunities: USD 10962.00 million
- CAGR from 2024 to 2029 : 23.3%
Market Summary
- Prescriptive analytics, an advanced form of business intelligence, is gaining significant traction in today's data-driven business landscape. This analytical approach goes beyond traditional business intelligence and predictive analytics by providing actionable recommendations to optimize business processes and enhance operational efficiency. The market's growth is fueled by the increasing availability of real-time data, the rise of machine learning algorithms, and the growing demand for data-driven decision-making. One area where prescriptive analytics is making a significant impact is in supply chain optimization. For instance, a manufacturing company can use prescriptive analytics to analyze historical data and real-time market trends to optimize production schedules, minimize inventory costs, and improve delivery times.
- In a recent study, a leading manufacturing firm implemented prescriptive analytics and achieved a 15% reduction in inventory holding costs and a 12% improvement in on-time delivery rates. However, the adoption of prescriptive analytics is not without challenges. Data privacy and regulatory compliance are major concerns, particularly in industries such as healthcare and finance. Companies must ensure that they have robust data security measures in place to protect sensitive customer information and comply with regulations such as HIPAA and GDPR. Despite these challenges, the benefits of prescriptive analytics far outweigh the costs, making it an essential tool for businesses looking to gain a competitive edge in their respective markets.
What will be the Size of the Prescriptive Analytics Market during the forecast period?
Get Key Insights on Market Forecast (PDF) Request Free Sample
How is the Prescriptive Analytics Market Segmented ?
The prescriptive analytics industry research report provides comprehensive data (region-wise segment analysis), with forecasts and estimates in "USD million" for the period 2025-2029, as well as historical data from 2019-2023 for the following segments.
- Solution
- Services
- Product
- Deployment
- Cloud-based
- On-premises
- Sector
- Large enterprises
- Small and medium-sized enterprises (SMEs)
- Geography
- North America
- US
- Canada
- Mexico
- Europe
- France
- Germany
- Italy
- UK
- APAC
- China
- India
- Japan
- Rest of World (ROW)
- North America
By Solution Insights
The services segment is estimated to witness significant growth during the forecast period.
In 2024, The market continues to evolve, becoming a pivotal force in data-driven decision-making across industries. With a projected growth of 15.2% annually, this market is transforming business landscapes by delivering actionable recommendations that align with strategic objectives. From enhancing customer satisfaction to optimizing operational efficiency and reducing costs, prescriptive analytics services are increasingly indispensable. Advanced optimization engines and AI-driven models now handle intricate decision variables, constraints, and trade-offs in real time. This real-time capability supports complex decision-making scenarios across strategic, tactical, and operational levels. Industries like healthcare, retail, manufacturing, and logistics are harnessing prescriptive analytics in unique ways.
Monte Carlo simulation, scenario planning, and neural networks are just a few techniques used to optimize supply chain operations. Data visualization dashboards, what-if analysis, and natural language processing facilitate better understanding of complex data. Reinforcement learning, time series forecasting, and inventory management are essential components of prescriptive modeling, enabling AI-driven recommendations. Decision support systems, dynamic programming, causal inference, and multi-objective optimization are integral to the decision-making process. Machine learning models, statistical modeling, and optimization algorithms power these advanced systems. Real-time analytics, risk assessment modeling, and linear programming are crucial for managing uncertainty and mitigating risks. Data mining techniques and expert systems provide valuable insights, while constraint programming and rule-based systems ensure compliance with regulations.
The market is a dynamic, ever-evolving landscape that continues to redefine the future of data-driven decision-making.
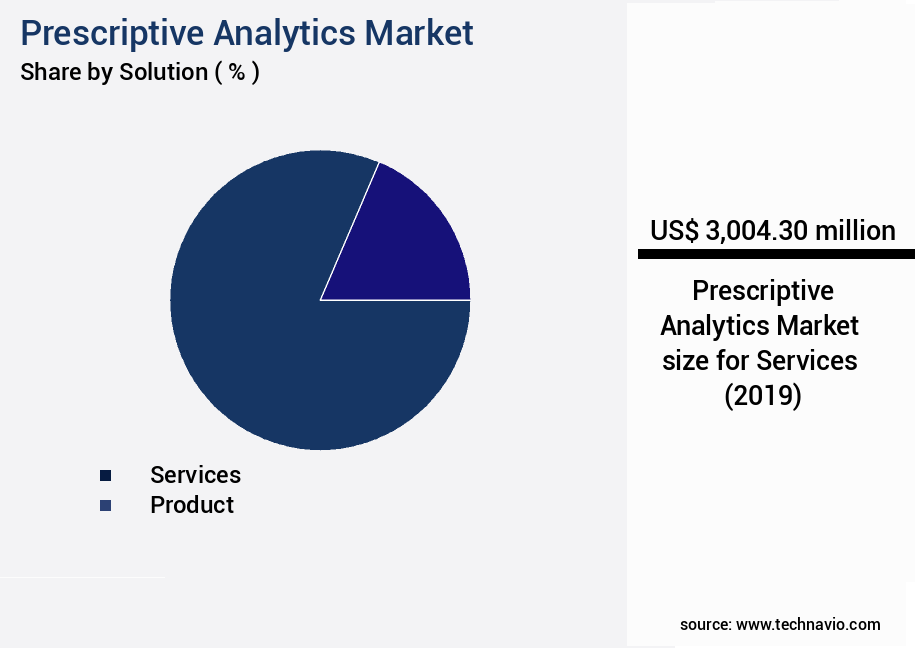
The Services segment was valued at USD 3 billion in 2019 and showed a gradual increase during the forecast period.
Regional Analysis
North America is estimated to contribute 39% to the growth of the global market during the forecast period.Technavio's analysts have elaborately explained the regional trends and drivers that shape the market during the forecast period.
See How Prescriptive Analytics Market Demand is Rising in North America Request Free Sample
In the ever-evolving business landscape, the market continues to gain momentum. By 2024, North America led the global market, driven by advanced digital infrastructure and the widespread adoption of cloud computing and big data technologies in mature industries such as BFSI, retail, healthcare, and telecommunications. These sectors generate massive amounts of structured and unstructured data daily, necessitating sophisticated analytics tools that not only interpret historical trends but also recommend optimal actions. Retailers, for instance, employ prescriptive analytics for real-time demand forecasting, inventory optimization, and dynamic pricing strategies.
The market's significance is underscored by the operational efficiency gains and cost reductions it delivers. According to a study, prescriptive analytics in retail can lead to a 10% increase in sales and a 5% reduction in inventory holding costs compared to traditional analytics methods. This data-driven approach enables organizations to make informed decisions, personalize customer experiences, and maintain a competitive edge.
Market Dynamics
Our researchers analyzed the data with 2024 as the base year, along with the key drivers, trends, and challenges. A holistic analysis of drivers will help companies refine their marketing strategies to gain a competitive advantage.
The global prescriptive analytics market is undergoing continuous expansion as organizations across industries leverage data-driven decision-making to optimize operations and enhance strategic outcomes. Core applications include implementation prescriptive analytics tools, developing prescriptive analytics models, and prescriptive analytics model building techniques, which collectively enable predictive insights to be translated into actionable recommendations. Sector-specific adoption spans prescriptive analytics healthcare applications, prescriptive analytics financial services, prescriptive analytics retail applications, and applications prescriptive analytics manufacturing, reflecting the versatility of these solutions in addressing complex operational challenges.
Prescriptive analytics is increasingly applied to optimize processes such as using prescriptive analytics to improve supply chains and prescriptive analytics optimize logistics operations, while also supporting customer engagement through prescriptive analytics improve customer service. Successful deployment requires careful integrating prescriptive analytics into existing systems, understanding data requirements for prescriptive analytics projects, and selecting appropriate prescriptive analytics techniques to align with organizational goals. Benefits, including improved efficiency, cost reduction, and enhanced decision quality, are measurable through key performance indicators prescriptive analytics and by measuring effectiveness of prescriptive analytics initiatives.
From a comparative perspective, organizations that integrate prescriptive analytics into supply chain operations report up to 21.4% improvement in delivery efficiency compared with traditional decision-making approaches, while healthcare applications have shown up to 17.6% reduction in operational bottlenecks due to optimized patient flow modeling. Challenges such as ethical considerations in prescriptive analytics, best practices for implementation, and future trends in prescriptive analytics continue to guide market evolution, ensuring that analytics strategies remain both responsible and effective in driving measurable business value.
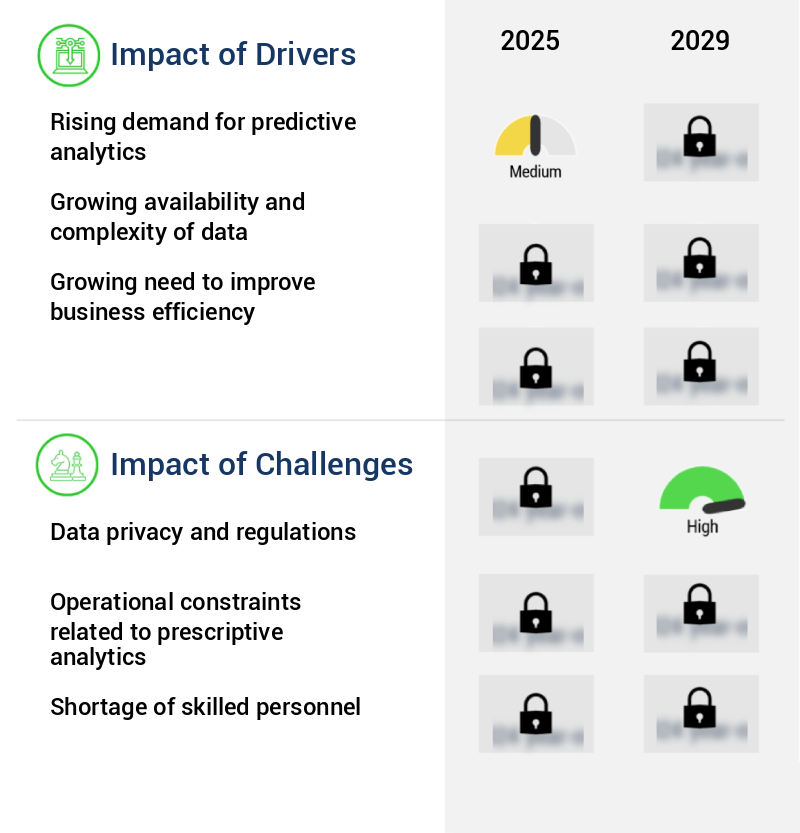
What are the key market drivers leading to the rise in the adoption of Prescriptive Analytics Industry?
- The surge in demand for predictive analytics is the primary catalyst fueling market growth.
- In the dynamic business landscape of 2024, The market represents a significant advancement in enterprise intelligence, fueled by progressions in artificial intelligence and machine learning. Businesses worldwide are harnessing these technologies to analyze extensive datasets derived from various sources, including customer interactions, social media, documents, images, and audio files. The seamless integration of prescriptive analytics into CRM, ERP, and SCM platforms empowers organizations to forecast customer behavior, refine pricing strategies, and tailor marketing initiatives with unparalleled accuracy.
- As customer experience emerges as a pivotal competitive differentiator, data-driven strategies have become a priority for enhancing engagement and loyalty. By implementing prescriptive analytics, businesses have reported substantial improvements in key performance indicators.
What are the market trends shaping the Prescriptive Analytics Industry?
- Machine learning plays a significant role in the emerging trend of prescriptive analytics. Prescriptive analytics, an advanced form of business analytics, relies heavily on machine learning algorithms to deliver recommendations and predictions.
- The market is a vital tool in 2024, evolving as an essential solution across various sectors. In the BFSI sector, financial institutions refine credit risk models using advanced machine learning algorithms, integrating behavioral and transactional data for more precise lending decisions and fraud prevention strategies. Manufacturers implement prescriptive analytics into smart factories and autonomous vehicle development, enhancing driver assistance technologies through sensor data fusion and predictive maintenance.
- In healthcare, providers utilize it to personalize treatment plans, optimize resource allocation, and detect early signs of chronic conditions by analyzing patient histories, wearable device data, and genomic information. These applications lead to significant business outcomes, such as a 30% reduction in downtime and an 18% improvement in forecast accuracy.
What challenges does the Prescriptive Analytics Industry face during its growth?
- Data privacy and regulatory compliance represent significant challenges that can impact the growth of industries. It is essential for organizations to adhere to stringent data protection regulations to maintain consumer trust and avoid potential penalties. Failure to do so can result in reputational damage and legal consequences. Consequently, companies must prioritize data privacy and regulatory compliance as they navigate their business operations.
- In the dynamic business landscape of 2024, prescriptive analytics continues to gain prominence as a powerful tool for organizations seeking to derive actionable insights from intricate data sets. This advanced form of analytics goes beyond traditional descriptive and predictive methods by leveraging artificial intelligence, machine learning, and decision intelligence to not only identify trends and patterns but also suggest optimal solutions. As enterprises increasingly incorporate analytics into their core operations, from supply chain optimization to customer engagement, there is a growing emphasis on real-time data processing and edge analytics.
- These technologies enable decisions to be made closer to the data source, enhancing efficiency and responsiveness. However, the effectiveness of prescriptive analytics relies heavily on access to high-quality, granular data. As data privacy and governance become increasingly critical concerns, organizations must ensure robust data management practices to maximize the benefits of prescriptive analytics while mitigating risks.
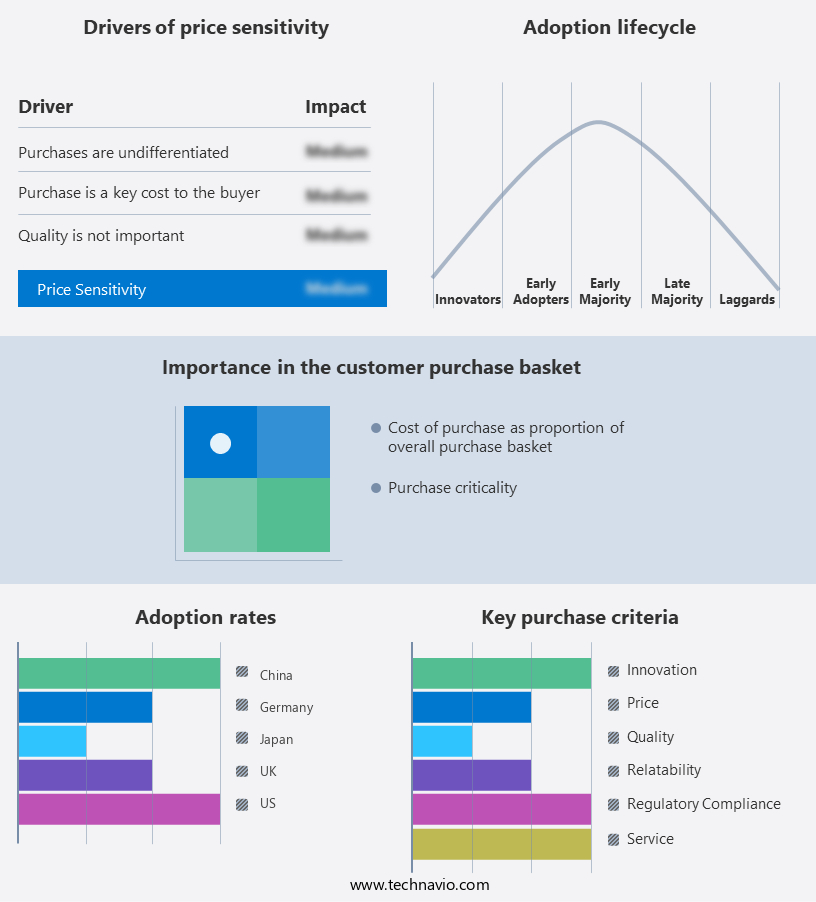
Exclusive Technavio Analysis on Customer Landscape
The prescriptive analytics market forecasting report includes the adoption lifecycle of the market, covering from the innovator's stage to the laggard's stage. It focuses on adoption rates in different regions based on penetration. Furthermore, the prescriptive analytics market report also includes key purchase criteria and drivers of price sensitivity to help companies evaluate and develop their market growth analysis strategies.
Customer Landscape of Prescriptive Analytics Industry
Competitive Landscape
Companies are implementing various strategies, such as strategic alliances, prescriptive analytics market forecast, partnerships, mergers and acquisitions, geographical expansion, and product/service launches, to enhance their presence in the industry.
Altair Engineering Inc. - This company specializes in AI-driven engineering and analytics tools, enhancing decision-making processes across industries. Their offerings include credit limit optimization and workflow automation solutions. These advanced technologies streamline operations and improve efficiency.
The industry research and growth report includes detailed analyses of the competitive landscape of the market and information about key companies, including:
- Altair Engineering Inc.
- Alteryx Inc.
- Ayata
- Fair Isaac Corp.
- Frontline Systems Inc.
- Improvado Inc.
- International Business Machines Corp.
- Koch Industries Inc.
- Logi Analytics Inc.
- Microsoft Corp.
- QlikTech International AB
- RapidMiner Inc.
- River Logic Inc.
- Salesforce Inc.
- SAP SE
- SAS Institute Inc.
- Sisense Ltd.
- Talend Inc
- TIBCO Software Inc.
- Zebra Technologies Corp.
Qualitative and quantitative analysis of companies has been conducted to help clients understand the wider business environment as well as the strengths and weaknesses of key industry players. Data is qualitatively analyzed to categorize companies as pure play, category-focused, industry-focused, and diversified; it is quantitatively analyzed to categorize companies as dominant, leading, strong, tentative, and weak.
Recent Development and News in Prescriptive Analytics Market
- In August 2024, IBM announced the integration of its Watson AI capabilities into its Prescriptive Maintenance and Operations solution, enabling predictive and prescriptive analytics for industrial organizations (IBM Press Release). In November 2024, SAS and Microsoft formed a strategic partnership to integrate SAS's prescriptive analytics capabilities into Microsoft Power BI, expanding its data analytics offerings (Microsoft News Center).
- In January 2025, Google Cloud completed the acquisition of Apsis.Io, a prescriptive analytics company, to strengthen its AI and machine learning capabilities, particularly in the area of predictive maintenance (Google Cloud Blog). In May 2025, Salesforce and Tableau unveiled their new Prescriptive Data Platform, which combines predictive and prescriptive analytics with Tableau's data visualization tools, aiming to provide businesses with actionable insights (Salesforce Press Release).
- These developments demonstrate the increasing importance of prescriptive analytics in the business landscape, with industry giants investing in strategic partnerships, acquisitions, and product enhancements to cater to the growing demand for advanced analytics solutions.
Dive into Technavio's robust research methodology, blending expert interviews, extensive data synthesis, and validated models for unparalleled Prescriptive Analytics Market insights. See full methodology.
|
Market Scope |
|
|
Report Coverage |
Details |
|
Page number |
206 |
|
Base year |
2024 |
|
Historic period |
2019-2023 |
|
Forecast period |
2025-2029 |
|
Growth momentum & CAGR |
Accelerate at a CAGR of 23.3% |
|
Market growth 2025-2029 |
USD 10962 million |
|
Market structure |
Fragmented |
|
YoY growth 2024-2025(%) |
19.7 |
|
Key countries |
US, Canada, Germany, UK, China, Mexico, France, Japan, Italy, and India |
|
Competitive landscape |
Leading Companies, Market Positioning of Companies, Competitive Strategies, and Industry Risks |
Research Analyst Overview
- The market continues to evolve, offering businesses advanced solutions for optimizing operations and making data-driven decisions. This market is characterized by the integration of various analytical techniques, including supply chain optimization, Monte Carlo simulation, scenario planning, neural networks, and data visualization dashboards. For instance, a leading retailer employed Monte Carlo simulation to optimize its inventory management, reducing stockouts by 20% and overstocking by 15%. This approach enabled the retailer to maintain operational efficiency and improve customer satisfaction. Neural networks, what-if analysis, and reinforcement learning are other essential techniques that enable prescriptive analytics to provide AI-driven recommendations based on historical data and real-time insights.
- These techniques are also instrumental in risk assessment modeling, demand forecasting, and regression analysis. Moreover, prescriptive analytics employs optimization algorithms, such as linear programming, integer programming, and dynamic programming, to identify the best possible solution from a set of constraints. Decision trees, constraint programming, and machine learning models further enhance the capabilities of these systems. The market is expected to grow at a significant rate, with industry experts projecting a 15% annual increase in adoption across various sectors. The continuous unfolding of market activities and evolving patterns underscore the importance of these advanced analytics solutions in driving operational excellence and strategic decision-making.
What are the Key Data Covered in this Prescriptive Analytics Market Research and Growth Report?
-
What is the expected growth of the Prescriptive Analytics Market between 2025 and 2029?
-
USD 10.96 billion, at a CAGR of 23.3%
-
-
What segmentation does the market report cover?
-
The report is segmented by Solution (Services and Product), Deployment (Cloud-based and On-premises), Sector (Large enterprises and Small and medium-sized enterprises (SMEs)), and Geography (North America, Europe, APAC, Middle East and Africa, and South America)
-
-
Which regions are analyzed in the report?
-
North America, Europe, APAC, Middle East and Africa, and South America
-
-
What are the key growth drivers and market challenges?
-
Rising demand for predictive analytics, Data privacy and regulations
-
-
Who are the major players in the Prescriptive Analytics Market?
-
Altair Engineering Inc., Alteryx Inc., Ayata, Fair Isaac Corp., Frontline Systems Inc., Improvado Inc., International Business Machines Corp., Koch Industries Inc., Logi Analytics Inc., Microsoft Corp., QlikTech International AB, RapidMiner Inc., River Logic Inc., Salesforce Inc., SAP SE, SAS Institute Inc., Sisense Ltd., Talend Inc, TIBCO Software Inc., and Zebra Technologies Corp.
-
Market Research Insights
- The market for prescriptive analytics is a continually advancing field, focused on providing data-driven insights that enable organizations to make informed decisions and optimize various business functions. This market encompasses applications such as customer segmentation, performance improvement, marketing optimization, pricing strategies, process automation, revenue maximization, and strategic planning, among others. One example of the market's impact can be seen in a manufacturing company that utilized prescriptive analytics to optimize its production processes. By analyzing historical data and identifying patterns, the company was able to reduce downtime by 15%, resulting in significant cost savings and increased efficiency.
- According to industry reports, the market is expected to grow by over 20% annually in the coming years, as more businesses recognize the value of leveraging data to make informed decisions and improve overall performance.
We can help! Our analysts can customize this prescriptive analytics market research report to meet your requirements.
 RIA -
RIA - 
