Supply Risk Analytics Market Analysis, Size, and Forecast 2026-2030: North America (US, Canada, and Mexico), Europe (Germany, UK, and France), APAC (China, Japan, and India), South America (Brazil, Argentina, and Colombia), Middle East and Africa (Saudi Arabia, UAE, and South Africa), and Rest of World (ROW)

Supply Risk Analytics Market Analysis, Size, and Forecast 2026-2030:
North America (US, Canada, and Mexico), Europe (Germany, UK, and France), APAC (China, Japan, and India), South America (Brazil, Argentina, and Colombia), Middle East and Africa (Saudi Arabia, UAE, and South Africa), and Rest of World (ROW)

Published: May 2026 320 Pages SKU: IRTNTR81509

Market Overview at a Glance

$2.58 B
Market Opportunity
15.2%
CAGR 2025 - 2030
31.6%
North America Growth
$649.9 Mn
Supplier risk segment 2024

Supply Risk Analytics Market Size 2026-2030

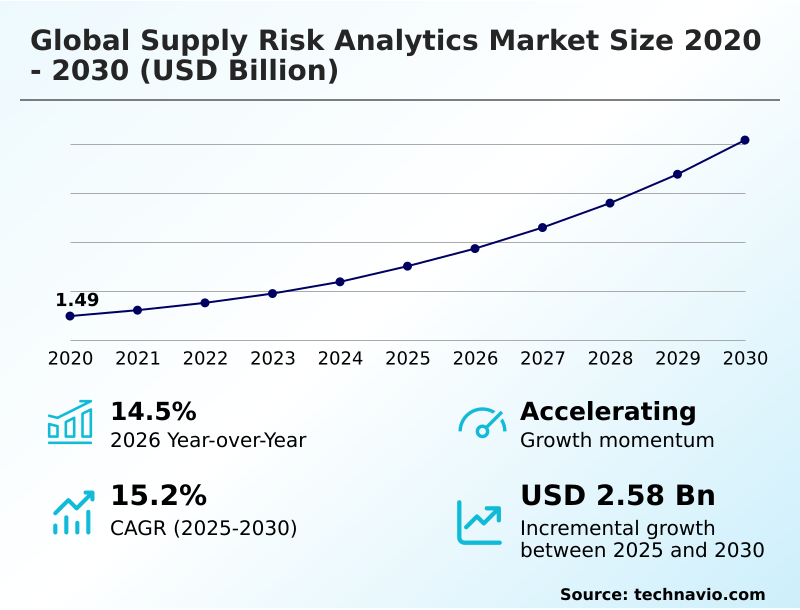
The supply risk analytics market size is valued to increase by USD 2.58 billion, at a CAGR of 15.2% from 2025 to 2030. Escalating frequency of global supply disruptions will drive the supply risk analytics market.

Major Market Trends & Insights

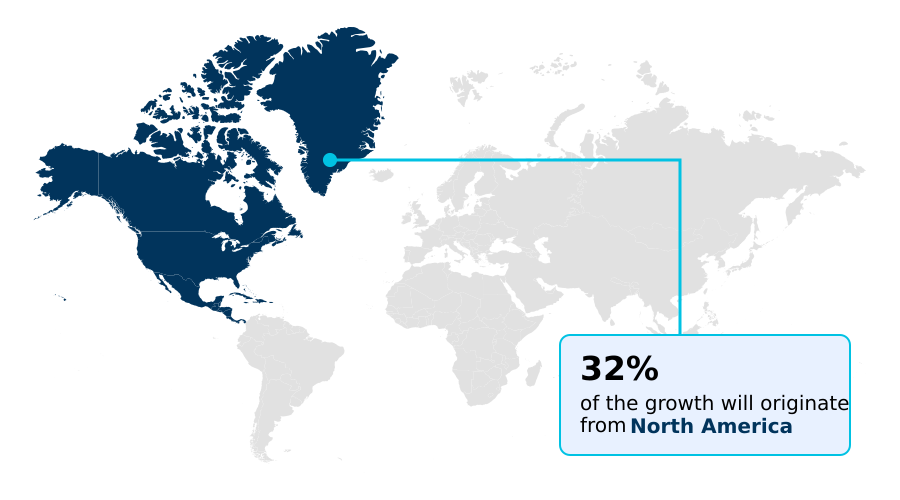
  • North America dominated the market and accounted for a 31.6% growth during the forecast period.
  • By Type - Supplier risk segment was valued at USD 649.9 million in 2024
  • By End-user - Manufacturing segment accounted for the largest market revenue share in 2024

Market Size & Forecast

  • Market Opportunities: USD 3.59 billion
  • Market Future Opportunities: USD 2.58 billion
  • CAGR from 2025 to 2030 : 15.2%

Market Summary

  • The Supply Risk Analytics Market is rapidly expanding as multinational organizations transition from reactive crisis management to predictive operational continuity. In a real-world scenario, automotive manufacturers managing thousands of specialized component providers utilize automated platforms to simulate port closures and dynamically reroute shipments.
  • This proactive approach has allowed early adopters to experience a 35% reduction in unplanned factory downtime compared to those relying on legacy spreadsheet forecasting. The escalating frequency of logistical disruptions acts as a primary catalyst for adoption, driving enterprises to invest heavily in visibility software to identify single points of failure before production is impacted.
  • Conversely, immense complexities in data formatting and the reluctance of secondary providers to share sensitive operational metrics create significant blind spots, restraining the seamless integration of risk intelligence software. Ultimately, the Supply Risk Analytics Market serves as a foundational digital defense, empowering procurement executives to navigate an increasingly volatile commercial landscape with data-backed precision.

What will be the Size of the Supply Risk Analytics Market during the forecast period?

Get Key Insights on Market Forecast (PDF) Get Free Sample

How is the Supply Risk Analytics Market Segmented?

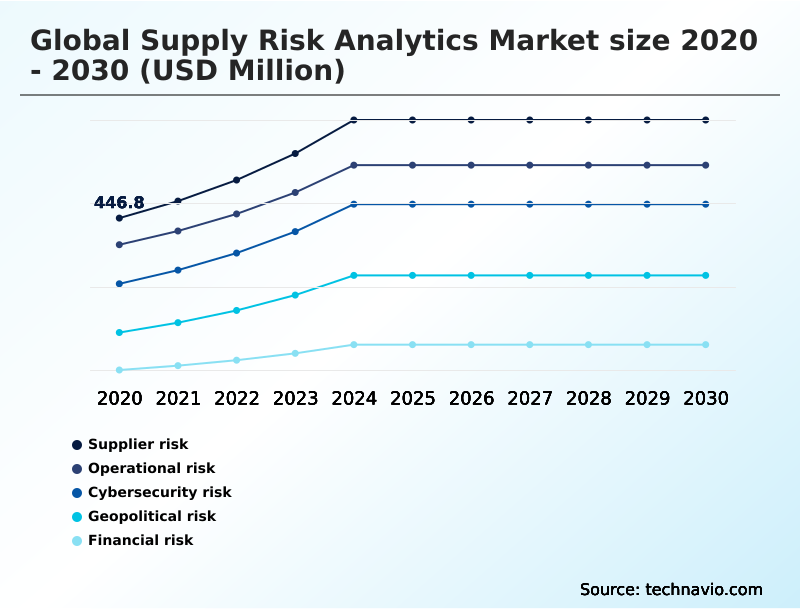
The supply risk analytics industry research report provides comprehensive data (region-wise segment analysis), with forecasts and estimates in "USD million" for the period 2026-2030, as well as historical data from 2020-2024 for the following segments.

  • Type
    • Supplier risk
    • Operational risk
    • Cybersecurity risk
    • Geopolitical risk
    • Financial risk
  • End-user
    • Manufacturing
    • Retail and consumer goods
    • Automotive
    • Pharmaceuticals
    • Others
  • Technology
    • AI analytics
    • Predictive analytics
    • Big data analytics
    • IoT enabled monitoring
    • Blockchain traceability
  • Geography
    • North America
      • US
      • Canada
      • Mexico
    • Europe
      • Germany
      • UK
      • France
      • The Netherlands
      • Italy
      • Spain
    • APAC
      • China
      • Japan
      • India
      • South Korea
      • Australia
      • Indonesia
    • South America
      • Brazil
      • Argentina
      • Colombia
    • Middle East and Africa
      • Saudi Arabia
      • UAE
      • South Africa
      • Israel
      • Turkey

By Type Insights

The supplier risk segment is estimated to witness significant growth during the forecast period.

Supplier risk evaluation serves as a critical defense mechanism within enterprise procurement frameworks, enabling organizations to maintain operational continuity amid global volatility. By deploying predictive disruption modeling, companies can systematically execute logistical infrastructure evaluation and raw material provenance tracking.

This transition enables organizations to shift from reactive troubleshooting toward dynamic sourcing optimization. Utilizing distributed ledger traceability, businesses have reported that component shortage detection improved by 25% compared to manual assessment methodologies.

Furthermore, integrating natural language processing alerts with climate event forecasting allows organizations to generate automated disruption alerts instantly.

This strategic capability directly enhances just-in-time manufacturing resilience by optimizing strategic stockpile allocation, effectively protecting profit margins and shielding the parent organization from severe reputational damage during unforeseen systemic failures.

Get Free Sample

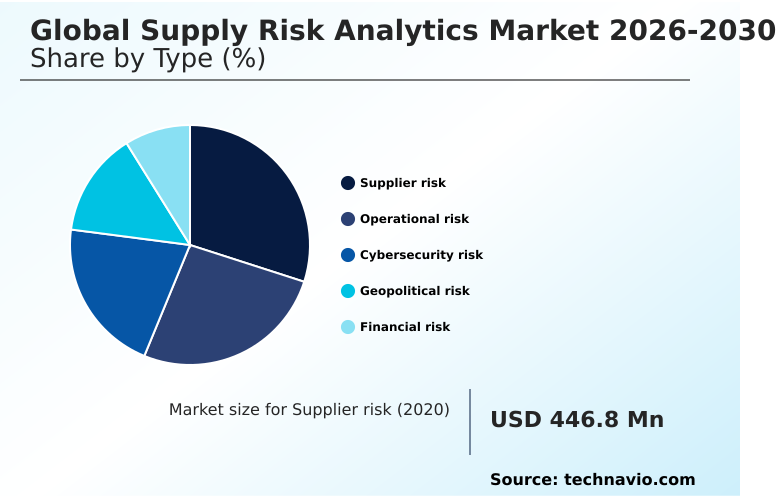
The Supplier risk segment was valued at USD 649.9 million in 2024 and showed a gradual increase during the forecast period.

Get Free Sample

Regional Analysis

North America is estimated to contribute 31.6% to the growth of the global market during the forecast period.Technavio’s analysts have elaborately explained the regional trends and drivers that shape the market during the forecast period.

See How Supply Risk Analytics Market Demand is Rising in North America Get Free Sample

The adoption of supply visibility platforms varies significantly across regional landscapes due to distinct industrial priorities.

North America leads the rapid deployment of operational resilience modeling, where manufacturers leverage deep network mapping to evaluate geopolitical threat quantification alongside sudden trade policy shifts.

This approach yields a 40% improvement in logistics bottleneck prediction compared to traditional European methodologies. Conversely, the European sector prioritizes continuous threat surveillance and cyber risk quantification due to stringent data sovereignty mandates.

European conglomerates mandate rigorous digital hygiene assessment and vulnerability patching analysis to audit their networks, reducing supply chain auditing costs by 22%.

North American organizations focus primarily on algorithmic threat detection, whereas European enterprises embed cybersecurity threat integration directly into procurement workflows. These divergent strategic imperatives ensure that platform developers must customize risk algorithms to address regional operational efficiency effectively.

Market Dynamics

Our researchers analyzed the data with 2025 as the base year, along with the key drivers, trends, and challenges. A holistic analysis of drivers will help companies refine their marketing strategies to gain a competitive advantage.

  • Modern enterprise resilience necessitates moving beyond static spreadsheets toward highly dynamic, automated frameworks that can anticipate global friction. Implementing machine learning for supplier risk has fundamentally altered how multinational corporations safeguard their procurement channels. By rapidly analyzing historical performance data and external market signals, organizations can predict vendor defaults before they trigger critical material shortages.
  • This transition allows procurement teams to optimize inventory positioning while evaluating tier-n operational vulnerabilities deep within complex secondary and tertiary vendor networks. Companies deploying these sophisticated analytical ecosystems frequently witness disruption response times accelerate by over 40% compared to industry peers relying on manual risk reviews.
  • Furthermore, the introduction of digital twin supply chain simulation provides strategists with an unparalleled capability to stress-test their logistical architectures against hypothetical disaster scenarios without impacting physical operations. This virtual modeling is heavily augmented by real-time geopolitical threat monitoring, which continuously tracks international trade policy shifts to calculate the probabilistic impact on cross-border material flows.
  • To feed these complex mathematical models, organizations rely on advanced unstructured data ingestion for procurement, transforming scattered news feeds, financial reports, and social media alerts into actionable intelligence. By merging physical logistics oversight with advanced digital foresight, business leaders can proactively secure alternative sourcing routes, ensuring uninterrupted production and shielding revenue margins.

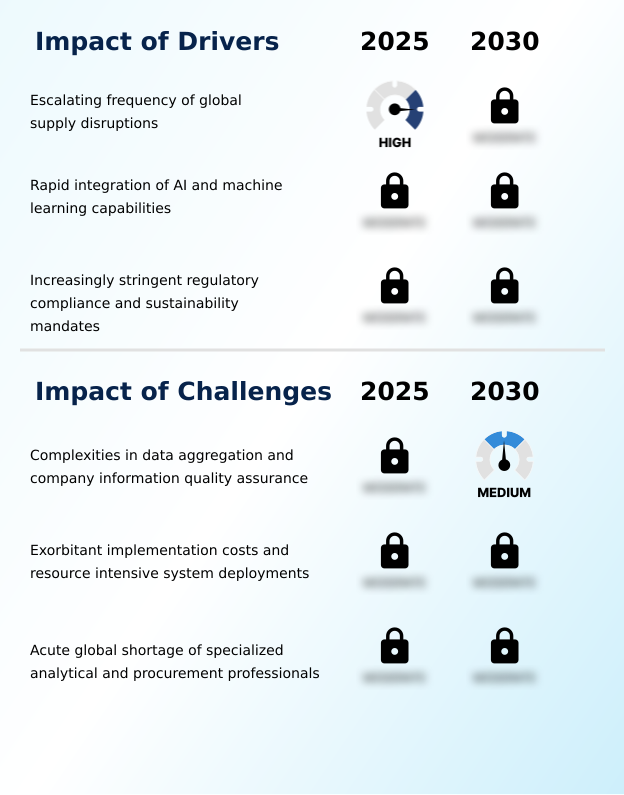
What are the key market drivers leading to the rise in the adoption of Supply Risk Analytics Industry?

  • The escalating frequency of global supply disruptions serves as a primary catalyst, compelling enterprises to prioritize proactive vulnerability identification over reactive crisis management.

  • The escalating enforcement of stringent international sustainability mandates acts as a massive catalyst for expanding tier-n supplier visibility. Regulatory bodies hold parent organizations accountable for the environmental compliance metrics of their extended networks.
  • To avoid penalties, corporations deploy automated compliance tracking and algorithmic vulnerability detection to deeply scrutinize tertiary providers. By actively executing ethical sourcing verification and carbon footprint tracking, enterprises can isolate vendors violating critical emission standards.
  • This proactive real-time procurement monitoring has enabled manufacturers to lower their regulatory penalty exposure by 40% and improve ESG reporting efficiency by 25% compared to manual audits.
  • Furthermore, ensuring cold chain integrity and active pharmaceutical ingredient tracking provides business leaders with the critical intelligence necessary to align global operations with rigid corporate governance standards.

What are the market trends shaping the Supply Risk Analytics Industry?

  • The proliferation of digital twin technology for advanced scenario modeling represents a defining trend in the current market landscape. Organizations are increasingly adopting these virtual replicas to conduct rigorous stress tests and optimize proactive operational resilience.

  • The rapid proliferation of digital twin supply mapping is fundamentally reengineering how global organizations execute third-party risk management. By constructing virtual replicas of physical networks, strategists perform advanced scenario simulation and scenario stress testing without disrupting live operations. This technological evolution allows organizations to integrate supplier financial health scoring with geospatial risk mapping to proactively identify structural vulnerabilities.
  • Consequently, facilities utilizing these virtual environments for freight transit monitoring have improved factory downtime prevention by 35% and enhanced inventory buffer optimization by over 20% compared to conventional models. Ultimately, this integration empowers executives to refine inventory positioning algorithms and secure secondary sourcing agreements, ensuring continuous product delivery amid unpredictable global friction.

What challenges does the Supply Risk Analytics Industry face during its growth?

  • The immense complexities inherent in cross-platform data aggregation and ensuring third-party information quality severely impede the seamless deployment of comprehensive vulnerability assessment frameworks.

  • Consolidating highly fragmented operational data from disparate sources remains a formidable structural barrier to achieving true network transparency, severely complicating legacy system integration. Countless international suppliers exhibit extreme reluctance to share production metrics, creating blind spots that degrade machine learning risk forecasting.
  • This persistent lack of data standardization protocols directly compromises the accuracy of vendor insolvency prediction and customs clearance prediction models. When risk engines process incomplete unstructured data ingestion, the resulting strategies regarding commodity price volatility are fundamentally flawed.
  • Consequently, organizations struggling with cloud-based risk architecture report that their transportation network reliability metrics are 30% less accurate, while deployment costs soar 18% above projections. Overcoming these massive data hygiene obstacles requires highly specialized talent, constraining the rapid deployment of comprehensive cross-border trade friction mitigation systems.

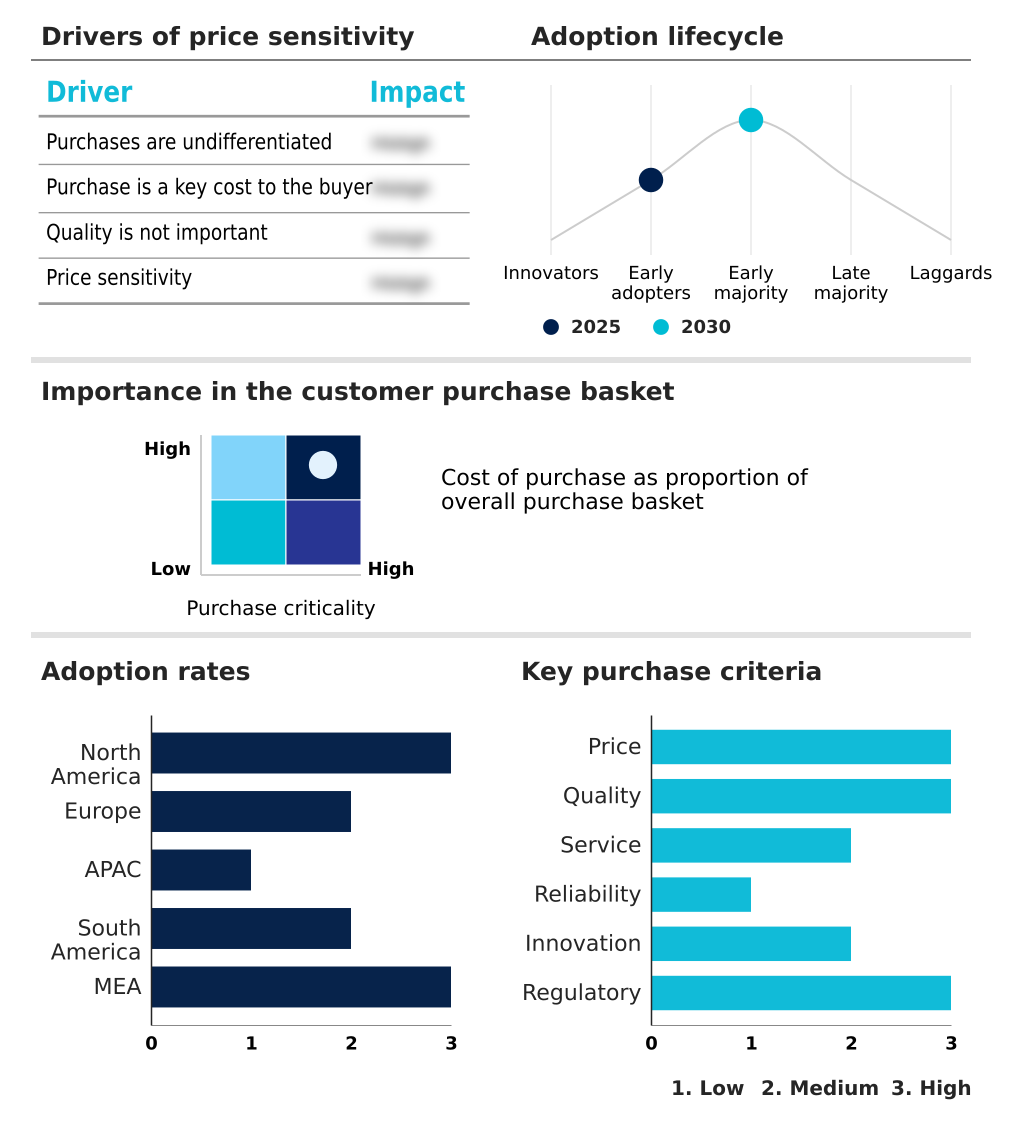
Exclusive Technavio Analysis on Customer Landscape

The supply risk analytics market forecasting report includes the adoption lifecycle of the market, covering from the innovator’s stage to the laggard’s stage. It focuses on adoption rates in different regions based on penetration. Furthermore, the supply risk analytics market report also includes key purchase criteria and drivers of price sensitivity to help companies evaluate and develop their market growth analysis strategies.

Customer Landscape of Supply Risk Analytics Industry

Competitive Landscape

Companies are implementing various strategies, such as strategic alliances, supply risk analytics market forecast, partnerships, mergers and acquisitions, geographical expansion, and product/service launches, to enhance their presence in the industry.

Alchemai - This solution leverages artificial intelligence to automate complex supply chain mapping, enabling proactive threat mitigation and comprehensive operational visibility across global procurement networks.

The industry research and growth report includes detailed analyses of the competitive landscape of the market and information about key companies, including:

  • Alchemai
  • Avetta LLC
  • Blue Yonder Group Inc.
  • Coupa Software Inc.
  • Dun and Bradstreet Holdings Inc.
  • EcoVadis SAS
  • EiQ
  • Everstream Analytics
  • Exiger
  • Interos Inc.
  • Intertek Group Plc
  • Ivalua Inc.
  • Jaggaer LLC
  • KHARON
  • NQC Ltd.
  • Oracle Corp.
  • Prewave GmbH
  • Resilinc Corp.
  • SAP SE
  • Sphera Solutions Inc.

Qualitative and quantitative analysis of companies has been conducted to help clients understand the wider business environment as well as the strengths and weaknesses of key industry players. Data is qualitatively analyzed to categorize companies as pure play, category-focused, industry-focused, and diversified; it is quantitatively analyzed to categorize companies as dominant, leading, strong, tentative, and weak.

Recent Development and News in Supply risk analytics market

  • In the Application Software industry, the widespread transition toward cloud-based risk architecture has fundamentally democratized advanced simulation capabilities, directly impacting Supply Risk Analytics demand by enabling real-time network oversight.
  • The enforcement of stringent enterprise data privacy regulations mandates robust compliance frameworks, prompting organizations to integrate algorithmic threat detection protocols that measure the cyber vulnerability of interconnected supply nodes.
  • The rapid adoption of cognitive intelligence within enterprise resource planning suites has significantly automated unstructured data extraction, elevating the precision of deep network mapping for complex manufacturing sectors.
  • The integration of sustainability tracking into legacy system workflows has accelerated automated reporting, enabling organizations to deploy carbon footprint tracking when confronting sudden trade policy shifts or climate regulations.

Dive into Technavio’s robust research methodology, blending expert interviews, extensive data synthesis, and validated models for unparalleled Supply Risk Analytics Market insights. See full methodology.

Market Scope
Page number 320
Base year 2025
Historic period 2020-2024
Forecast period 2026-2030
Growth momentum & CAGR Accelerate at a CAGR of 15.2%
Market growth 2026-2030 USD 2578.6 million
Market structure Fragmented
YoY growth 2025-2026(%) 14.5%
Key countries US, Canada, Mexico, Germany, UK, France, The Netherlands, Italy, Spain, China, Japan, India, South Korea, Australia, Indonesia, Brazil, Argentina, Colombia, Saudi Arabia, UAE, South Africa, Israel and Turkey
Competitive landscape Leading Companies, Market Positioning of Companies, Competitive Strategies, and Industry Risks

Request Free Sample

Research Analyst Overview

  • The integration of predictive intelligence into global enterprise resource planning represents a massive operational shift, compelling corporate leadership to align risk management directly with long-term product strategy. Executives now mandate continuous supply surveillance to safeguard highly complex manufacturing ecosystems against unforeseen friction.
  • By utilizing deep dependency mapping, organizations can accurately visualize the cascading effects of a localized failure on their broader global output. This level of transparency is essential for boardrooms prioritizing dynamic sourcing and evaluating corporate governance standards across secondary vendor networks.
  • Empirical data demonstrates that enterprises deploying distributed tracing to authenticate raw material origins achieve a 30% reduction in compliance violation penalties compared to organizations lacking automated oversight. Furthermore, the application of cybersecurity evaluation within procurement workflows ensures that digital vulnerabilities among third-party contractors do not compromise the parent organization.
  • Ultimately, the ability to anticipate and neutralize logistical disruptions via algorithmic forecasting empowers strategic planners to optimize inventory buffers, protect brand equity, and navigate volatile international trade environments with absolute precision.

What are the Key Data Covered in this Supply Risk Analytics Market Research and Growth Report?

  • What is the expected growth of the Supply Risk Analytics Market between 2026 and 2030?

    • USD 2.58 billion, at a CAGR of 15.2%

  • What segmentation does the market report cover?

    • The report is segmented by Type (Supplier risk, Operational risk, Cybersecurity risk, Geopolitical risk, and Financial risk), End-user (Manufacturing, Retail and consumer goods, Automotive, Pharmaceuticals, and Others), Technology (AI analytics, Predictive analytics, Big data analytics, IoT enabled monitoring, and Blockchain traceability) and Geography (North America, Europe, APAC, South America, Middle East and Africa)

  • Which regions are analyzed in the report?

    • North America, Europe, APAC, South America and Middle East and Africa

  • What are the key growth drivers and market challenges?

    • Escalating frequency of global supply disruptions, Complexities in data aggregation and company information quality assurance

  • Who are the major players in the Supply Risk Analytics Market?

    • Alchemai, Avetta LLC, Blue Yonder Group Inc., Coupa Software Inc., Dun and Bradstreet Holdings Inc., EcoVadis SAS, EiQ, Everstream Analytics, Exiger, Interos Inc., Intertek Group Plc, Ivalua Inc., Jaggaer LLC, KHARON, NQC Ltd., Oracle Corp., Prewave GmbH, Resilinc Corp., SAP SE and Sphera Solutions Inc.

Market Research Insights

  • Supply chain resilience has transitioned from a backend logistical function into a critical boardroom priority. By implementing automated monitoring, enterprises actively minimize their exposure to unpredictable global shocks. Organizations leveraging advanced weather forecasting have improved their strategic warehousing efficiency by 28%, significantly reducing the financial burden of over-stocking capital-intensive merchandise.
  • Furthermore, the integration of predictive algorithms enables procurement teams to identify subtle component shortage signals weeks in advance. This proactive visibility ensures that manufacturers utilizing multi-tier visibility experience a 35% reduction in costly factory downtime compared to those employing reactive management strategies, directly enhancing overall return on investment and sustaining competitive market advantages.

We can help! Our analysts can customize this supply risk analytics market research report to meet your requirements.

Get in touch

1. Executive Summary

1.1 Market overview

Executive Summary - Chart on Market Overview
Executive Summary - Data Table on Market Overview
Executive Summary - Chart on Global Market Characteristics
Executive Summary - Chart on Market by Geography
Executive Summary - Chart on Market Segmentation by Type
Executive Summary - Chart on Market Segmentation by End-user
Executive Summary - Chart on Market Segmentation by Technology
Executive Summary - Chart on Incremental Growth
Executive Summary - Data Table on Incremental Growth
Executive Summary - Chart on Company Market Positioning

2. Technavio Analysis

2.1 Analysis of price sensitivity, lifecycle, customer purchase basket, adoption rates, and purchase criteria

2.2 Criticality of inputs and Factors of differentiation

Chart on Overview on criticality of inputs and factors of differentiation

2.3 Factors of disruption

Chart on Overview on factors of disruption

2.4 Impact of drivers and challenges

Chart on Impact of drivers and challenges in 2025 and 2030

3. Market Landscape

3.1 Market ecosystem

Chart on Parent Market
Data Table on - Parent Market

3.2 Market characteristics

Chart on Market characteristics analysis

3.3 Value chain analysis

Chart on Value chain analysis

4. Market Sizing

4.1 Market definition

Data Table on Offerings of companies included in the market definition

4.2 Market segment analysis

Market segments

4.3 Market size 2025

4.4 Market outlook: Forecast for 2025-2030

Chart on Global - Market size and forecast 2025-2030 ($ million)
Data Table on Global - Market size and forecast 2025-2030 ($ million)
Chart on Global Market: Year-over-year growth 2025-2030 (%)
Data Table on Global Market: Year-over-year growth 2025-2030 (%)

5. Historic Market Size

5.1 Global Supply Risk Analytics Market 2020 - 2024

Historic Market Size - Data Table on Global Supply Risk Analytics Market 2020 - 2024 ($ million)

5.2 Type segment analysis 2020 - 2024

Historic Market Size - Type Segment 2020 - 2024 ($ million)

5.3 End-user segment analysis 2020 - 2024

Historic Market Size - End-user Segment 2020 - 2024 ($ million)

5.4 Technology segment analysis 2020 - 2024

Historic Market Size - Technology Segment 2020 - 2024 ($ million)

5.5 Geography segment analysis 2020 - 2024

Historic Market Size - Geography Segment 2020 - 2024 ($ million)

5.6 Country segment analysis 2020 - 2024

Historic Market Size - Country Segment 2020 - 2024 ($ million)

6. Qualitative Analysis

6.1 Impact of AI on Global Supply Risk Analytics Market

6.2 Impact of Geopolitical Conflicts on Global Supply Risk Analytics Market

7. Five Forces Analysis

7.1 Five forces summary

Five forces analysis - Comparison between 2025 and 2030

7.2 Bargaining power of buyers

Bargaining power of buyers - Impact of key factors 2025 and 2030

7.3 Bargaining power of suppliers

Bargaining power of suppliers - Impact of key factors in 2025 and 2030

7.4 Threat of new entrants

Threat of new entrants - Impact of key factors in 2025 and 2030

7.5 Threat of substitutes

Threat of substitutes - Impact of key factors in 2025 and 2030

7.6 Threat of rivalry

Threat of rivalry - Impact of key factors in 2025 and 2030

7.7 Market condition

Chart on Market condition - Five forces 2025 and 2030

8. Market Segmentation by Type

8.1 Market segments

Chart on Type - Market share 2025-2030 (%)
Data Table on Type - Market share 2025-2030 (%)

8.2 Comparison by Type

Chart on Comparison by Type
Data Table on Comparison by Type

8.3 Supplier risk - Market size and forecast 2025-2030

Chart on Supplier risk - Market size and forecast 2025-2030 ($ million)
Data Table on Supplier risk - Market size and forecast 2025-2030 ($ million)
Chart on Supplier risk - Year-over-year growth 2025-2030 (%)
Data Table on Supplier risk - Year-over-year growth 2025-2030 (%)

8.4 Operational risk - Market size and forecast 2025-2030

Chart on Operational risk - Market size and forecast 2025-2030 ($ million)
Data Table on Operational risk - Market size and forecast 2025-2030 ($ million)
Chart on Operational risk - Year-over-year growth 2025-2030 (%)
Data Table on Operational risk - Year-over-year growth 2025-2030 (%)

8.5 Cybersecurity risk - Market size and forecast 2025-2030

Chart on Cybersecurity risk - Market size and forecast 2025-2030 ($ million)
Data Table on Cybersecurity risk - Market size and forecast 2025-2030 ($ million)
Chart on Cybersecurity risk - Year-over-year growth 2025-2030 (%)
Data Table on Cybersecurity risk - Year-over-year growth 2025-2030 (%)

8.6 Geopolitical risk - Market size and forecast 2025-2030

Chart on Geopolitical risk - Market size and forecast 2025-2030 ($ million)
Data Table on Geopolitical risk - Market size and forecast 2025-2030 ($ million)
Chart on Geopolitical risk - Year-over-year growth 2025-2030 (%)
Data Table on Geopolitical risk - Year-over-year growth 2025-2030 (%)

8.7 Financial risk - Market size and forecast 2025-2030

Chart on Financial risk - Market size and forecast 2025-2030 ($ million)
Data Table on Financial risk - Market size and forecast 2025-2030 ($ million)
Chart on Financial risk - Year-over-year growth 2025-2030 (%)
Data Table on Financial risk - Year-over-year growth 2025-2030 (%)

8.8 Market opportunity by Type

Market opportunity by Type ($ million)
Data Table on Market opportunity by Type ($ million)

9. Market Segmentation by End-user

9.1 Market segments

Chart on End-user - Market share 2025-2030 (%)
Data Table on End-user - Market share 2025-2030 (%)

9.2 Comparison by End-user

Chart on Comparison by End-user
Data Table on Comparison by End-user

9.3 Manufacturing - Market size and forecast 2025-2030

Chart on Manufacturing - Market size and forecast 2025-2030 ($ million)
Data Table on Manufacturing - Market size and forecast 2025-2030 ($ million)
Chart on Manufacturing - Year-over-year growth 2025-2030 (%)
Data Table on Manufacturing - Year-over-year growth 2025-2030 (%)

9.4 Retail and consumer goods - Market size and forecast 2025-2030

Chart on Retail and consumer goods - Market size and forecast 2025-2030 ($ million)
Data Table on Retail and consumer goods - Market size and forecast 2025-2030 ($ million)
Chart on Retail and consumer goods - Year-over-year growth 2025-2030 (%)
Data Table on Retail and consumer goods - Year-over-year growth 2025-2030 (%)

9.5 Automotive - Market size and forecast 2025-2030

Chart on Automotive - Market size and forecast 2025-2030 ($ million)
Data Table on Automotive - Market size and forecast 2025-2030 ($ million)
Chart on Automotive - Year-over-year growth 2025-2030 (%)
Data Table on Automotive - Year-over-year growth 2025-2030 (%)

9.6 Pharmaceuticals - Market size and forecast 2025-2030

Chart on Pharmaceuticals - Market size and forecast 2025-2030 ($ million)
Data Table on Pharmaceuticals - Market size and forecast 2025-2030 ($ million)
Chart on Pharmaceuticals - Year-over-year growth 2025-2030 (%)
Data Table on Pharmaceuticals - Year-over-year growth 2025-2030 (%)

9.7 Others - Market size and forecast 2025-2030

Chart on Others - Market size and forecast 2025-2030 ($ million)
Data Table on Others - Market size and forecast 2025-2030 ($ million)
Chart on Others - Year-over-year growth 2025-2030 (%)
Data Table on Others - Year-over-year growth 2025-2030 (%)

9.8 Market opportunity by End-user

Market opportunity by End-user ($ million)
Data Table on Market opportunity by End-user ($ million)

10. Market Segmentation by Technology

10.1 Market segments

Chart on Technology - Market share 2025-2030 (%)
Data Table on Technology - Market share 2025-2030 (%)

10.2 Comparison by Technology

Chart on Comparison by Technology
Data Table on Comparison by Technology

10.3 AI analytics - Market size and forecast 2025-2030

Chart on AI analytics - Market size and forecast 2025-2030 ($ million)
Data Table on AI analytics - Market size and forecast 2025-2030 ($ million)
Chart on AI analytics - Year-over-year growth 2025-2030 (%)
Data Table on AI analytics - Year-over-year growth 2025-2030 (%)

10.4 Predictive analytics - Market size and forecast 2025-2030

Chart on Predictive analytics - Market size and forecast 2025-2030 ($ million)
Data Table on Predictive analytics - Market size and forecast 2025-2030 ($ million)
Chart on Predictive analytics - Year-over-year growth 2025-2030 (%)
Data Table on Predictive analytics - Year-over-year growth 2025-2030 (%)

10.5 Big data analytics - Market size and forecast 2025-2030

Chart on Big data analytics - Market size and forecast 2025-2030 ($ million)
Data Table on Big data analytics - Market size and forecast 2025-2030 ($ million)
Chart on Big data analytics - Year-over-year growth 2025-2030 (%)
Data Table on Big data analytics - Year-over-year growth 2025-2030 (%)

10.6 IoT enabled monitoring - Market size and forecast 2025-2030

Chart on IoT enabled monitoring - Market size and forecast 2025-2030 ($ million)
Data Table on IoT enabled monitoring - Market size and forecast 2025-2030 ($ million)
Chart on IoT enabled monitoring - Year-over-year growth 2025-2030 (%)
Data Table on IoT enabled monitoring - Year-over-year growth 2025-2030 (%)

10.7 Blockchain traceability - Market size and forecast 2025-2030

Chart on Blockchain traceability - Market size and forecast 2025-2030 ($ million)
Data Table on Blockchain traceability - Market size and forecast 2025-2030 ($ million)
Chart on Blockchain traceability - Year-over-year growth 2025-2030 (%)
Data Table on Blockchain traceability - Year-over-year growth 2025-2030 (%)

10.8 Market opportunity by Technology

Market opportunity by Technology ($ million)
Data Table on Market opportunity by Technology ($ million)

11. Customer Landscape

11.1 Customer landscape overview

Analysis of price sensitivity, lifecycle, customer purchase basket, adoption rates, and purchase criteria

12. Geographic Landscape

12.1 Geographic segmentation

Chart on Market share by geography 2025-2030 (%)
Data Table on Market share by geography 2025-2030 (%)

12.2 Geographic comparison

Chart on Geographic comparison
Data Table on Geographic comparison

12.3 North America - Market size and forecast 2025-2030

Chart on North America - Market size and forecast 2025-2030 ($ million)
Data Table on North America - Market size and forecast 2025-2030 ($ million)
Chart on North America - Year-over-year growth 2025-2030 (%)
Data Table on North America - Year-over-year growth 2025-2030 (%)
Chart on Regional Comparison - North America
Data Table on Regional Comparison - North America

12.3.1 US - Market size and forecast 2025-2030

Chart on US - Market size and forecast 2025-2030 ($ million)
Data Table on US - Market size and forecast 2025-2030 ($ million)
Chart on US - Year-over-year growth 2025-2030 (%)
Data Table on US - Year-over-year growth 2025-2030 (%)

12.3.2 Canada - Market size and forecast 2025-2030

Chart on Canada - Market size and forecast 2025-2030 ($ million)
Data Table on Canada - Market size and forecast 2025-2030 ($ million)
Chart on Canada - Year-over-year growth 2025-2030 (%)
Data Table on Canada - Year-over-year growth 2025-2030 (%)

12.3.3 Mexico - Market size and forecast 2025-2030

Chart on Mexico - Market size and forecast 2025-2030 ($ million)
Data Table on Mexico - Market size and forecast 2025-2030 ($ million)
Chart on Mexico - Year-over-year growth 2025-2030 (%)
Data Table on Mexico - Year-over-year growth 2025-2030 (%)

12.4 Europe - Market size and forecast 2025-2030

Chart on Europe - Market size and forecast 2025-2030 ($ million)
Data Table on Europe - Market size and forecast 2025-2030 ($ million)
Chart on Europe - Year-over-year growth 2025-2030 (%)
Data Table on Europe - Year-over-year growth 2025-2030 (%)
Chart on Regional Comparison - Europe
Data Table on Regional Comparison - Europe

12.4.1 Germany - Market size and forecast 2025-2030

Chart on Germany - Market size and forecast 2025-2030 ($ million)
Data Table on Germany - Market size and forecast 2025-2030 ($ million)
Chart on Germany - Year-over-year growth 2025-2030 (%)
Data Table on Germany - Year-over-year growth 2025-2030 (%)

12.4.2 UK - Market size and forecast 2025-2030

Chart on UK - Market size and forecast 2025-2030 ($ million)
Data Table on UK - Market size and forecast 2025-2030 ($ million)
Chart on UK - Year-over-year growth 2025-2030 (%)
Data Table on UK - Year-over-year growth 2025-2030 (%)

12.4.3 France - Market size and forecast 2025-2030

Chart on France - Market size and forecast 2025-2030 ($ million)
Data Table on France - Market size and forecast 2025-2030 ($ million)
Chart on France - Year-over-year growth 2025-2030 (%)
Data Table on France - Year-over-year growth 2025-2030 (%)

12.4.4 The Netherlands - Market size and forecast 2025-2030

Chart on The Netherlands - Market size and forecast 2025-2030 ($ million)
Data Table on The Netherlands - Market size and forecast 2025-2030 ($ million)
Chart on The Netherlands - Year-over-year growth 2025-2030 (%)
Data Table on The Netherlands - Year-over-year growth 2025-2030 (%)

12.4.5 Italy - Market size and forecast 2025-2030

Chart on Italy - Market size and forecast 2025-2030 ($ million)
Data Table on Italy - Market size and forecast 2025-2030 ($ million)
Chart on Italy - Year-over-year growth 2025-2030 (%)
Data Table on Italy - Year-over-year growth 2025-2030 (%)

12.4.6 Spain - Market size and forecast 2025-2030

Chart on Spain - Market size and forecast 2025-2030 ($ million)
Data Table on Spain - Market size and forecast 2025-2030 ($ million)
Chart on Spain - Year-over-year growth 2025-2030 (%)
Data Table on Spain - Year-over-year growth 2025-2030 (%)

12.5 APAC - Market size and forecast 2025-2030

Chart on APAC - Market size and forecast 2025-2030 ($ million)
Data Table on APAC - Market size and forecast 2025-2030 ($ million)
Chart on APAC - Year-over-year growth 2025-2030 (%)
Data Table on APAC - Year-over-year growth 2025-2030 (%)
Chart on Regional Comparison - APAC
Data Table on Regional Comparison - APAC

12.5.1 China - Market size and forecast 2025-2030

Chart on China - Market size and forecast 2025-2030 ($ million)
Data Table on China - Market size and forecast 2025-2030 ($ million)
Chart on China - Year-over-year growth 2025-2030 (%)
Data Table on China - Year-over-year growth 2025-2030 (%)

12.5.2 Japan - Market size and forecast 2025-2030

Chart on Japan - Market size and forecast 2025-2030 ($ million)
Data Table on Japan - Market size and forecast 2025-2030 ($ million)
Chart on Japan - Year-over-year growth 2025-2030 (%)
Data Table on Japan - Year-over-year growth 2025-2030 (%)

12.5.3 India - Market size and forecast 2025-2030

Chart on India - Market size and forecast 2025-2030 ($ million)
Data Table on India - Market size and forecast 2025-2030 ($ million)
Chart on India - Year-over-year growth 2025-2030 (%)
Data Table on India - Year-over-year growth 2025-2030 (%)

12.5.4 South Korea - Market size and forecast 2025-2030

Chart on South Korea - Market size and forecast 2025-2030 ($ million)
Data Table on South Korea - Market size and forecast 2025-2030 ($ million)
Chart on South Korea - Year-over-year growth 2025-2030 (%)
Data Table on South Korea - Year-over-year growth 2025-2030 (%)

12.5.5 Australia - Market size and forecast 2025-2030

Chart on Australia - Market size and forecast 2025-2030 ($ million)
Data Table on Australia - Market size and forecast 2025-2030 ($ million)
Chart on Australia - Year-over-year growth 2025-2030 (%)
Data Table on Australia - Year-over-year growth 2025-2030 (%)

12.5.6 Indonesia - Market size and forecast 2025-2030

Chart on Indonesia - Market size and forecast 2025-2030 ($ million)
Data Table on Indonesia - Market size and forecast 2025-2030 ($ million)
Chart on Indonesia - Year-over-year growth 2025-2030 (%)
Data Table on Indonesia - Year-over-year growth 2025-2030 (%)

12.6 South America - Market size and forecast 2025-2030

Chart on South America - Market size and forecast 2025-2030 ($ million)
Data Table on South America - Market size and forecast 2025-2030 ($ million)
Chart on South America - Year-over-year growth 2025-2030 (%)
Data Table on South America - Year-over-year growth 2025-2030 (%)
Chart on Regional Comparison - South America
Data Table on Regional Comparison - South America

12.6.1 Brazil - Market size and forecast 2025-2030

Chart on Brazil - Market size and forecast 2025-2030 ($ million)
Data Table on Brazil - Market size and forecast 2025-2030 ($ million)
Chart on Brazil - Year-over-year growth 2025-2030 (%)
Data Table on Brazil - Year-over-year growth 2025-2030 (%)

12.6.2 Argentina - Market size and forecast 2025-2030

Chart on Argentina - Market size and forecast 2025-2030 ($ million)
Data Table on Argentina - Market size and forecast 2025-2030 ($ million)
Chart on Argentina - Year-over-year growth 2025-2030 (%)
Data Table on Argentina - Year-over-year growth 2025-2030 (%)

12.6.3 Colombia - Market size and forecast 2025-2030

Chart on Colombia - Market size and forecast 2025-2030 ($ million)
Data Table on Colombia - Market size and forecast 2025-2030 ($ million)
Chart on Colombia - Year-over-year growth 2025-2030 (%)
Data Table on Colombia - Year-over-year growth 2025-2030 (%)

12.7 Middle East and Africa - Market size and forecast 2025-2030

Chart on Middle East and Africa - Market size and forecast 2025-2030 ($ million)
Data Table on Middle East and Africa - Market size and forecast 2025-2030 ($ million)
Chart on Middle East and Africa - Year-over-year growth 2025-2030 (%)
Data Table on Middle East and Africa - Year-over-year growth 2025-2030 (%)
Chart on Regional Comparison - Middle East and Africa
Data Table on Regional Comparison - Middle East and Africa

12.7.1 Saudi Arabia - Market size and forecast 2025-2030

Chart on Saudi Arabia - Market size and forecast 2025-2030 ($ million)
Data Table on Saudi Arabia - Market size and forecast 2025-2030 ($ million)
Chart on Saudi Arabia - Year-over-year growth 2025-2030 (%)
Data Table on Saudi Arabia - Year-over-year growth 2025-2030 (%)

12.7.2 UAE - Market size and forecast 2025-2030

Chart on UAE - Market size and forecast 2025-2030 ($ million)
Data Table on UAE - Market size and forecast 2025-2030 ($ million)
Chart on UAE - Year-over-year growth 2025-2030 (%)
Data Table on UAE - Year-over-year growth 2025-2030 (%)

12.7.3 South Africa - Market size and forecast 2025-2030

Chart on South Africa - Market size and forecast 2025-2030 ($ million)
Data Table on South Africa - Market size and forecast 2025-2030 ($ million)
Chart on South Africa - Year-over-year growth 2025-2030 (%)
Data Table on South Africa - Year-over-year growth 2025-2030 (%)

12.7.4 Israel - Market size and forecast 2025-2030

Chart on Israel - Market size and forecast 2025-2030 ($ million)
Data Table on Israel - Market size and forecast 2025-2030 ($ million)
Chart on Israel - Year-over-year growth 2025-2030 (%)
Data Table on Israel - Year-over-year growth 2025-2030 (%)

12.7.5 Turkey - Market size and forecast 2025-2030

Chart on Turkey - Market size and forecast 2025-2030 ($ million)
Data Table on Turkey - Market size and forecast 2025-2030 ($ million)
Chart on Turkey - Year-over-year growth 2025-2030 (%)
Data Table on Turkey - Year-over-year growth 2025-2030 (%)

12.8 Market opportunity by geography

Market opportunity by geography ($ million)
Data Tables on Market opportunity by geography ($ million)

13. Drivers, Challenges, and Opportunity

13.1 Market drivers

Escalating frequency of global supply disruptions
Rapid integration of AI and machine learning capabilities
Increasingly stringent regulatory compliance and sustainability mandates

13.2 Market challenges

Complexities in data aggregation and company information quality assurance
Exorbitant implementation costs and resource intensive system deployments
Acute global shortage of specialized analytical and procurement professionals

13.3 Impact of drivers and challenges

Impact of drivers and challenges in 2025 and 2030

13.4 Market opportunities

Proliferation of digital twin technology for advanced scenario modeling
Expansion of tier-N visibility and deep supplier network mapping
Convergence of supply risk analytics with cybersecurity threat management

14. Competitive Landscape

14.1 Overview

14.2

Overview on criticality of inputs and factors of differentiation

14.3 Landscape disruption

Overview on factors of disruption

14.4 Industry risks

Impact of key risks on business

15. Competitive Analysis

15.1 Companies profiled

Companies covered

15.2 Company ranking index

15.3 Market positioning of companies

Matrix on companies position and classification

15.4 Alchemai

Alchemai - Overview
Alchemai - Product / Service
Alchemai - Key offerings
SWOT

15.5 Coupa Software Inc.

Coupa Software Inc. - Overview
Coupa Software Inc. - Product / Service
Coupa Software Inc. - Key offerings
SWOT

15.6 Dun and Bradstreet Holdings Inc.

Dun and Bradstreet Holdings Inc. - Overview
Dun and Bradstreet Holdings Inc. - Business segments
Dun and Bradstreet Holdings Inc. - Key offerings
Dun and Bradstreet Holdings Inc. - Segment focus
SWOT

15.7 EiQ

EiQ - Overview
EiQ - Product / Service
EiQ - Key offerings
SWOT

15.8 Everstream Analytics

Everstream Analytics - Overview
Everstream Analytics - Product / Service
Everstream Analytics - Key offerings
SWOT

15.9 Interos Inc.

Interos Inc. - Overview
Interos Inc. - Product / Service
Interos Inc. - Key offerings
SWOT

15.10 Intertek Group Plc

Intertek Group Plc - Overview
Intertek Group Plc - Business segments
Intertek Group Plc - Key offerings
Intertek Group Plc - Segment focus
SWOT

15.11 Jaggaer LLC

Jaggaer LLC - Overview
Jaggaer LLC - Product / Service
Jaggaer LLC - Key offerings
SWOT

15.12 KHARON

KHARON - Overview
KHARON - Product / Service
KHARON - Key offerings
SWOT

15.13 NQC Ltd.

NQC Ltd. - Overview
NQC Ltd. - Product / Service
NQC Ltd. - Key offerings
SWOT

15.14 Oracle Corp.

Oracle Corp. - Overview
Oracle Corp. - Business segments
Oracle Corp. - Key news
Oracle Corp. - Key offerings
Oracle Corp. - Segment focus
SWOT

15.15 Prewave GmbH

Prewave GmbH - Overview
Prewave GmbH - Product / Service
Prewave GmbH - Key offerings
SWOT

15.16 Resilinc Corp.

Resilinc Corp. - Overview
Resilinc Corp. - Product / Service
Resilinc Corp. - Key offerings
SWOT

15.17 SAP SE

SAP SE - Overview
SAP SE - Business segments
SAP SE - Key news
SAP SE - Key offerings
SAP SE - Segment focus
SWOT

15.18 Sphera Solutions Inc.

Sphera Solutions Inc. - Overview
Sphera Solutions Inc. - Product / Service
Sphera Solutions Inc. - Key offerings
SWOT

16. Appendix

16.1 Scope of the report

Market definition
Objectives
Notes and caveats

16.2 Inclusions and exclusions checklist

Inclusions checklist
Exclusions checklist

16.3 Currency conversion rates for US$

16.4 Research methodology

16.5 Data procurement

Information sources

16.6 Data validation

16.7 Validation techniques employed for market sizing

16.8 Data synthesis

16.9 360 degree market analysis

16.10 List of abbreviations

Research Methodology

Technavio presents a detailed picture of the market by way of study, synthesis, and summation of data from multiple sources. The analysts have presented the various facets of the market with a particular focus on identifying the key industry influencers. The data thus presented is comprehensive, reliable, and the result of extensive research, both primary and secondary.

INFORMATION SOURCES

Primary sources

  • Manufacturers and suppliers
  • Channel partners
  • Industry experts
  • Strategic decision makers

Secondary sources

  • Industry journals and periodicals
  • Government data
  • Financial reports of key industry players
  • Historical data
  • Press releases

DATA ANALYSIS

Data Synthesis

  • Collation of data
  • Estimation of key figures
  • Analysis of derived insights

Data Validation

  • Triangulation with data models
  • Reference against proprietary databases
  • Corroboration with industry experts

REPORT WRITING

Qualitative

  • Market drivers
  • Market challenges
  • Market trends
  • Five forces analysis

Quantitative

  • Market size and forecast
  • Market segmentation
  • Geographical insights
  • Competitive landscape

Interested in this report?

Get your sample now to see our research methodology and insights!

Download Now

Frequently Asked Questions

Supply Risk Analytics market growth will increase by USD 2578.6 million during 2026-2030.

The Supply Risk Analytics market is expected to grow at a CAGR of 15.2% during 2026-2030.

Supply Risk Analytics market is segmented by Type (Supplier risk, Operational risk, Cybersecurity risk, Geopolitical risk, Financial risk) End-user (Manufacturing, Retail and consumer goods, Automotive, Pharmaceuticals, Others) Technology (AI analytics, Predictive analytics, Big data analytics, IoT enabled monitoring, Blockchain traceability)

Alchemai, Avetta LLC, Blue Yonder Group Inc., Coupa Software Inc., Dun and Bradstreet Holdings Inc., EcoVadis SAS, EiQ, Everstream Analytics, Exiger, Interos Inc., Intertek Group Plc, Ivalua Inc., Jaggaer LLC, KHARON, NQC Ltd., Oracle Corp., Prewave GmbH, Resilinc Corp., SAP SE, Sphera Solutions Inc. are a few of the key vendors in the Supply Risk Analytics market.

North America will register the highest growth rate of 31.6% among the other regions. Therefore, the Supply Risk Analytics market in North America is expected to garner significant business opportunities for the vendors during the forecast period.

US, Canada, Mexico, Germany, UK, France, The Netherlands, Italy, Spain, China, Japan, India, South Korea, Australia, Indonesia, Brazil, Argentina, Colombia, Saudi Arabia, UAE, South Africa, Israel, Turkey

  • Escalating frequency of global supply disruptions is the driving factor this market.

The Supply Risk Analytics market vendors should focus on grabbing business opportunities from the Type segment as it accounted for the largest market share in the base year.
RIA - Research AI Assistant
Ask RIA