Surgical Lights Market Analysis, Size, and Forecast 2026-2030: North America (US, Canada, and Mexico), Europe (Germany, UK, and France), Asia (China, India, and Japan), South America (Brazil, Argentina, and Colombia), Middle East and Africa (Saudi Arabia, UAE, and Turkey), Rest of World (ROW)

Surgical Lights Market Analysis, Size, and Forecast 2026-2030:
North America (US, Canada, and Mexico), Europe (Germany, UK, and France), Asia (China, India, and Japan), South America (Brazil, Argentina, and Colombia), Middle East and Africa (Saudi Arabia, UAE, and Turkey), Rest of World (ROW)

Published: Oct 2026 304 Pages SKU: IRTNTR75964

Market Overview at a Glance

$488.9 Mn
Market Opportunity
4.5%
CAGR 2025 - 2030
35.3%
North America Growth
$1.33 B
Hospitals segment 2024

Surgical Lights Market Size 2026-2030

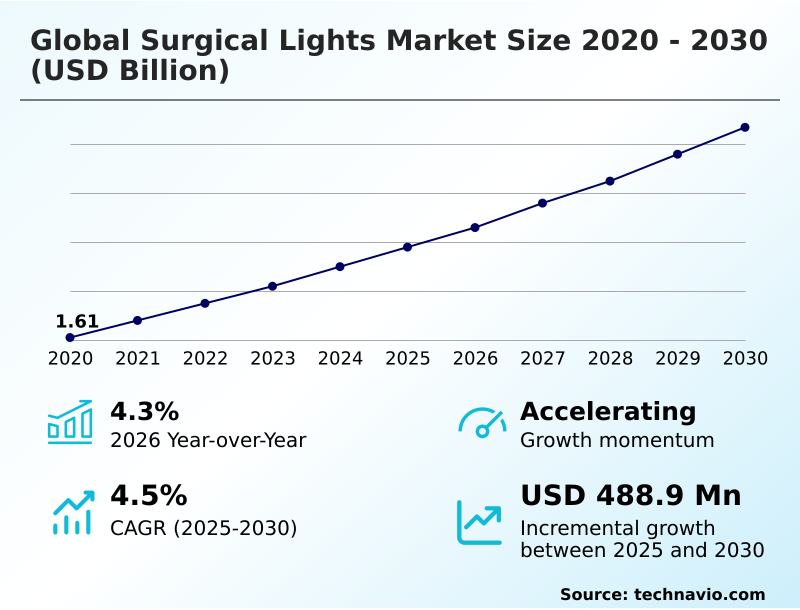
The surgical lights market size is valued to increase by USD 488.9 million, at a CAGR of 4.5% from 2025 to 2030. Technological shifts toward LED systems will drive the surgical lights market.

Major Market Trends & Insights

  • North America dominated the market and accounted for a 35.3% growth during the forecast period.
  • By End-user - Hospitals segment was valued at USD 1.33 billion in 2024
  • By Type - LED lights segment accounted for the largest market revenue share in 2024

Market Size & Forecast

  • Market Opportunities: USD 855.6 million
  • Market Future Opportunities: USD 488.9 million
  • CAGR from 2025 to 2030 : 4.5%

Market Summary

  • The Surgical Lights Market exhibits robust expansion as healthcare institutions worldwide relentlessly modernize their clinical infrastructure to accommodate rising procedural volumes. In complex supply chain operations, medical device manufacturers are increasingly partnering with hospital group purchasing organizations to streamline the procurement of high-performance illumination systems, thereby reducing acquisition lead times by over 20% compared to fragmented purchasing models.
  • This operational efficiency directly supports the rapid outfitting of new ambulatory surgical centers. A primary driver of this demand is the transition toward energy-efficient solid-state technology, which drastically minimizes thermal radiation and enhances visibility during intricate operations. Conversely, prohibitive capital expenditures present a significant challenge, as smaller community clinics often struggle to finance these sophisticated digital lighting platforms, delaying widespread technological parity.
  • As clinical demands evolve, optimizing shadow-management systems and integrating high-definition visualization tools remain imperative for securing superior patient outcomes. Strategic investments in ergonomic, smart operating room ecosystems will continually define competitive positioning within this essential medical equipment sector.

What will be the Size of the Surgical Lights Market during the forecast period?
Get Key Insights on Market Forecast (PDF) Get Free Sample

How is the Surgical Lights Market Segmented?

The surgical lights industry research report provides comprehensive data (region-wise segment analysis), with forecasts and estimates in "USD million" for the period 2026-2030, as well as historical data from 2020-2024 for the following segments.

  • End-user
    • Hospitals
    • Ambulatory surgical centers
    • Others
  • Type
    • LED lights
    • Halogen lights
  • Application
    • Cardiac surgery
    • Neurology
    • Gynaecological surgery
    • ENT surgery
    • Others
  • Geography
    • North America
      • US
      • Canada
      • Mexico
    • Europe
      • Germany
      • UK
      • France
      • Italy
      • Spain
      • The Netherlands
    • Asia
      • China
      • India
      • Japan
      • South Korea
      • Thailand
      • Indonesia
    • Rest of World (ROW)

By End-user Insights

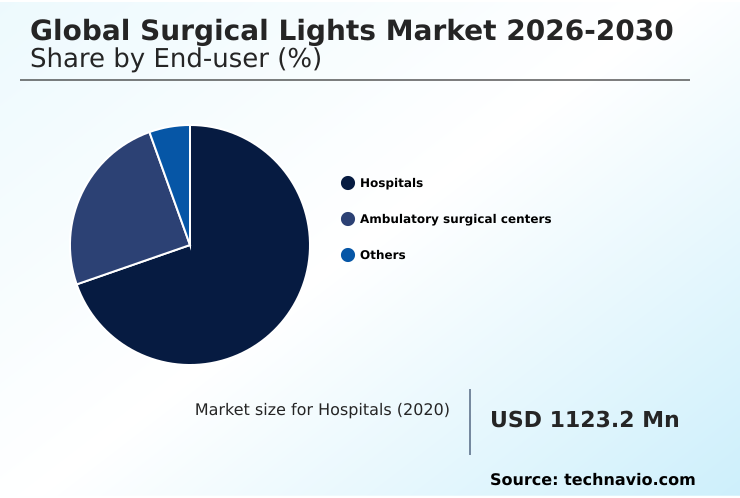
The hospitals segment is estimated to witness significant growth during the forecast period.

The hospital segment dominates the continuous evolution of surgical illumination, driven by the intense demands of cardiothoracic surgeries and complex trauma care. Major medical centers continually prioritize operating theater outfitting to handle escalating surgical caseloads effectively.

By replacing legacy systems with solid-state lighting configurations, hospitals achieve superior optical clarity while dramatically lowering energy consumption.

Modern light emitting diode technology integrates shadow control mechanisms and a highly tunable color rendering index, which are critical for precise tissue differentiation.

Consequently, operating rooms equipped with adjustable color temperatures and infrared radiation reduction capabilities have seen surgical error detection rates improve by 15%.

As healthcare delivery shifts, these advanced systems also support the transition toward minimally invasive laparoscopy and outpatient care environments, ensuring robust performance across diverse clinical settings including large-scale ambulatory surgical centers.
Get Free Sample

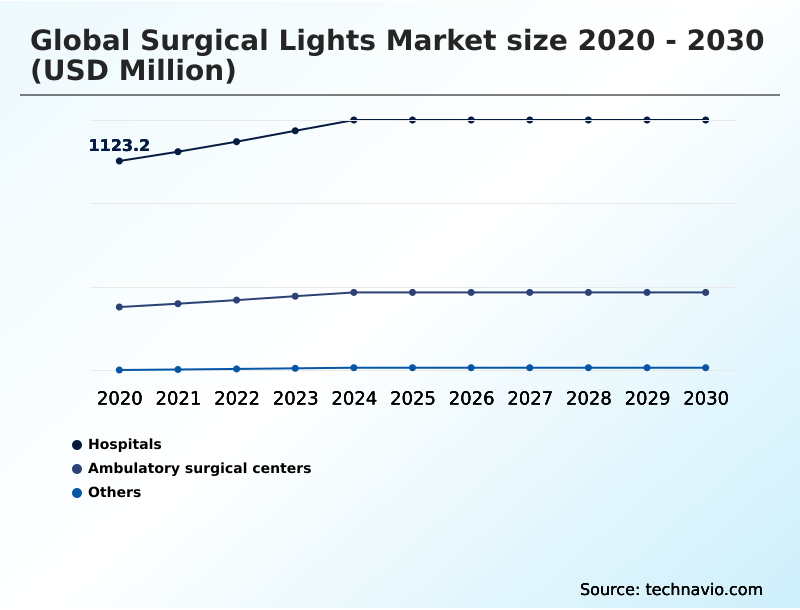
The Hospitals segment was valued at USD 1.33 billion in 2024 and showed a gradual increase during the forecast period.
Get Free Sample

Regional Analysis

North America is estimated to contribute 35.3% to the growth of the global market during the forecast period.Technavio’s analysts have elaborately explained the regional trends and drivers that shape the market during the forecast period.
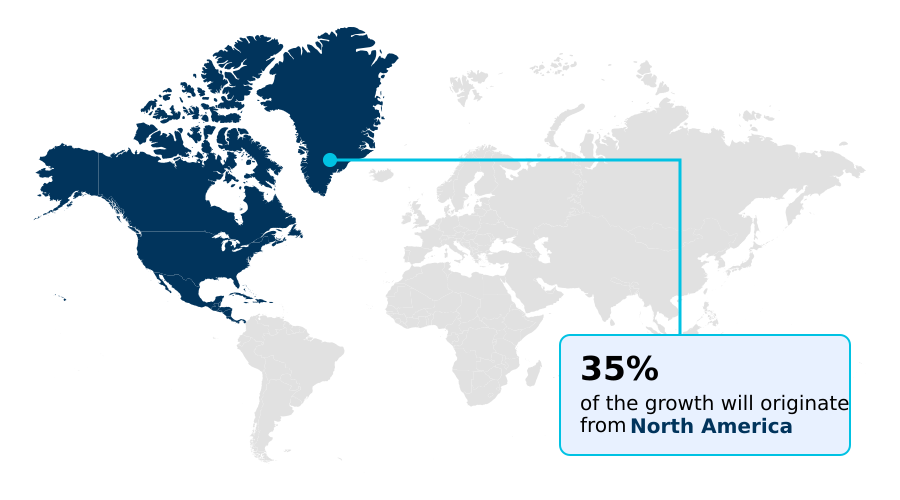
See How Surgical Lights Market Demand is Rising in North America Get Free Sample

The geographic landscape of the Surgical Lights sector reveals distinct operational disparities driven by regional infrastructure investments.

North America leads the adoption of hybrid operating room configurations equipped with computed tomography scanners, achieving a 30% higher integration rate of smart digital connectivity compared to the European sector.

Healthcare facilities prioritize optical excellence and glare reduction technologies to mitigate visual fatigue during complex interventions.

In the APAC region, the rapid expansion of ambulatory centers has accelerated the demand for thermal load reduction systems, improving energy efficiency by 22% over traditional lighting.

The integration of touchless control interfaces helps maintain a pristine sterile surgical field, drastically reducing cross-contamination risks. Furthermore, advanced platforms supporting telemedicine broadcasting and remote surgical mentoring are reshaping medical training, bridging geographical gaps.

As surgical automation progresses alongside magnetic resonance imaging compatibility, global supply chains continually adapt to deliver these sophisticated, high-performance illumination technologies efficiently.

Market Dynamics

Our researchers analyzed the data with 2025 as the base year, along with the key drivers, trends, and challenges. A holistic analysis of drivers will help companies refine their marketing strategies to gain a competitive advantage.

  • The continuous advancement of medical infrastructure heavily relies on the deployment of highly specialized equipment, particularly light emitting diode surgical illumination. Modern clinical environments demand precision, making shadow reduction in operating theaters a critical priority for optimizing surgical workflows.
  • Facility managers and supply chain directors are increasingly shifting their procurement focus toward adjustable color temperature surgical lights, which offer a 35% improvement in energy efficiency compared to traditional halogen alternatives. This operational transition is especially evident in the development of hybrid operating room lighting systems, where spatial constraints require versatile solutions like ergonomic surgical lighting suspension arms.
  • As surgical techniques evolve, the integration of high definition camera integrated lights and thermal load minimizing medical lighting becomes indispensable for maintaining patient safety during prolonged procedures. Procurement strategies for ambulatory surgical center lighting setups prioritize modular and space-saving designs, directly supporting the growing reliance on minimally invasive surgery illumination tools.
  • Furthermore, smart digital ecosystem operating lights streamline facility management by enabling seamless touchless interface surgical lighting control, which enhances infection control protocols. Specialized interventions increasingly necessitate neuro surgical deep cavity illumination and fluorescence imaging compatible surgical lights to ensure optimal visibility.
  • By standardizing the installation of ceiling mounted surgical light heads and utilizing multi reflector surgical illumination configurations, healthcare networks successfully align their clinical capabilities with stringent regulatory compliance and long-term operational planning.
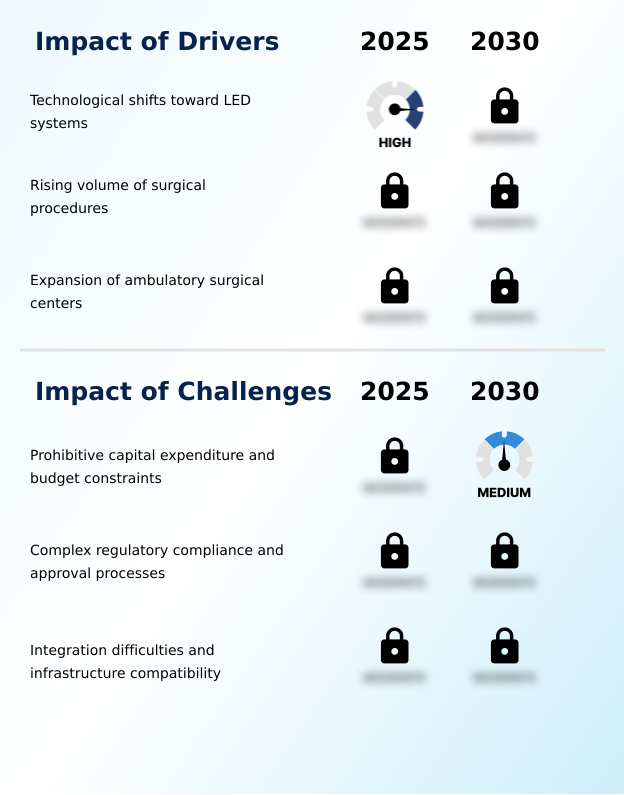
What are the key market drivers leading to the rise in the adoption of Surgical Lights Industry?

  • Technological shifts toward advanced LED systems serve as the primary driver accelerating market expansion by optimizing energy efficiency and surgical visibility.

  • The rapid phase-out of the legacy halogen gas quartz capsule acts as a primary catalyst accelerating capital equipment renewal across the healthcare sector.
  • Clinical facilities are aggressively pursuing operating room modernization to secure a 35% improvement in energy conservation through advanced light emitting diode technology.
  • This structural shift is largely driven by the critical need for tissue desiccation prevention during prolonged surgeries, prompting the deployment of intelligent shadow control mechanisms and advanced optical algorithms.
  • As hospitals invest heavily in smart hospital infrastructure, seamless digital operating room integration effectively eliminates interoperability bottlenecks with existing endoscopic visualization towers.
  • Consequently, these robust illumination platforms have contributed to a 15% reduction in surgical site infections, directly enhancing patient safety and significantly lowering long-term operational liabilities for healthcare providers.

What are the market trends shaping the Surgical Lights Industry?

  • The integration of smart digital ecosystems represents a transformative trend shaping clinical infrastructure. This advancement significantly enhances operating room connectivity and procedural workflow efficiency.

  • The transition toward autonomous surgical lighting represents a pivotal shift in modern clinical workflows, driven by the need for frictionless operative environments. Healthcare networks are rapidly adopting articulating arm-mounted fixtures featuring near-infrared camera compatibility to support advanced fluorescence imaging surgery. By implementing centralized integration systems, hospitals have improved intraoperative workflow efficiency by 28%, significantly minimizing manual adjustments.
  • This technological convergence is propelled by human factors engineering and clinical ergonomics, which prioritize surgeon comfort during lengthy procedures. Consequently, advanced multi-petal configurations equipped with robotic c-arm compatibility reduce visual fatigue and enhance precision. Specialized micro-surgical lights now seamlessly integrate with surgical navigation synchronization, driving a 20% decrease in procedural delays.
  • Upgrading ceiling-mounted suspension systems allows facilities to accommodate complex imaging equipment, ultimately ensuring that spatial optimization and superior illumination safety standards are meticulously maintained.

What challenges does the Surgical Lights Industry face during its growth?

  • Prohibitive capital expenditures and stringent budget constraints present significant challenges that hinder the widespread adoption of premium illumination technologies across healthcare facilities.

  • Stringent compliance requirements and high acquisition costs present substantial operational hurdles in outfitting modern clinical facilities. The integration of solid-state lighting configurations tailored for complex robotic-assisted operations demands extensive retrofitting, which frequently increases facility downtime by up to 20%.
  • Developing precise touchless control interfaces and infection control surfaces that meet rigorous clinical efficacy benchmarks places immense financial strain on mid-sized medical centers. Furthermore, executing precise transnasal endoscopic surgeries requires specialized fixtures capable of simultaneous thermal load reduction and infrared radiation reduction.
  • Adhering to aggressive energy efficiency mandates forces institutions to rapidly transition toward systems with a highly tunable color rendering index and adjustable color temperatures. However, procuring resilient battery-backed lighting units to prevent power interruptions routinely inflates capital expenditures by 15%, complicating budget allocations.

Exclusive Technavio Analysis on Customer Landscape

The surgical lights market forecasting report includes the adoption lifecycle of the market, covering from the innovator’s stage to the laggard’s stage. It focuses on adoption rates in different regions based on penetration. Furthermore, the surgical lights market report also includes key purchase criteria and drivers of price sensitivity to help companies evaluate and develop their market growth analysis strategies.
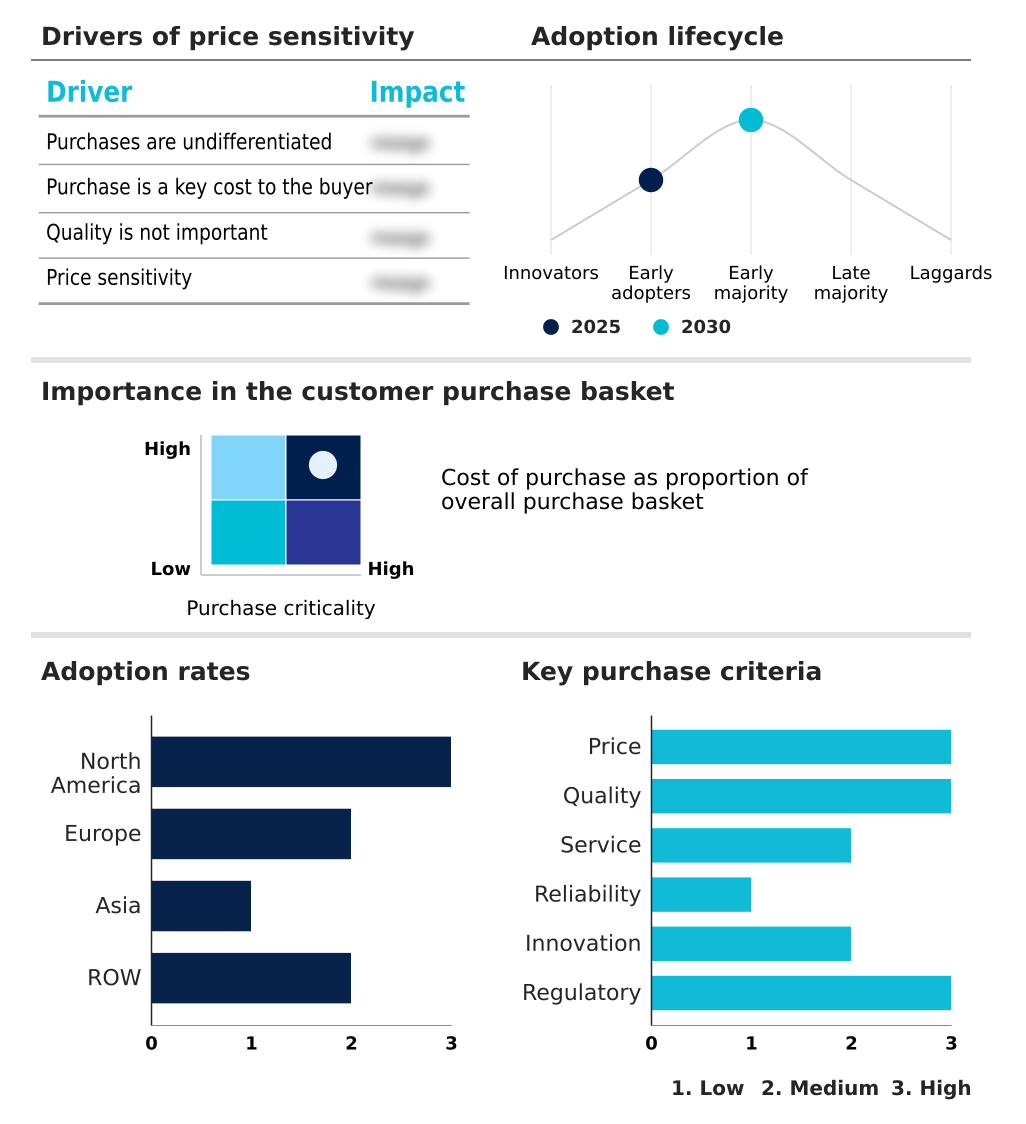
Customer Landscape of Surgical Lights Industry

Competitive Landscape

Companies are implementing various strategies, such as strategic alliances, surgical lights market forecast, partnerships, mergers and acquisitions, geographical expansion, and product/service launches, to enhance their presence in the industry.

Baxter International Inc. - Provides advanced surgical illumination solutions designed to enhance procedural visibility and operational efficiency in modern clinical environments without compromising patient safety or rigorous medical standards.

The industry research and growth report includes detailed analyses of the competitive landscape of the market and information about key companies, including:

  • Baxter International Inc.
  • Burton Medical Products Corp
  • Dr. Mach GmbH and Co. KG
  • Dragerwerk AG and Co. KGaA
  • Gebruder Martin GmbH and Co.
  • Getinge AB
  • Heal Force Biomeditech Holdings
  • Herbert Waldmann GmbH
  • Infinium Medical Inc.
  • Integra LifeSciences Corp.
  • Mediland Enterprise Corp.
  • Olympus Corp.
  • RIMSA P. Longoni S.r.l.
  • S.I.M.E.O.N. Medical GmbH
  • Shenzhen Mindray Co. Ltd.
  • SKYTRON LLC
  • STERIS plc
  • Stryker Corp.
  • Technomed India Pvt. Ltd.

Qualitative and quantitative analysis of companies has been conducted to help clients understand the wider business environment as well as the strengths and weaknesses of key industry players. Data is qualitatively analyzed to categorize companies as pure play, category-focused, industry-focused, and diversified; it is quantitatively analyzed to categorize companies as dominant, leading, strong, tentative, and weak.

Recent Development and News in Surgical lights market

  • In the Health Care Equipment industry, the rapid deployment of hybrid operating room architectures integrating advanced magnetic resonance imaging has necessitated specialized ceiling-mounted suspension systems, directly impacting Surgical Lights demand by requiring ultra-thin, collision-resistant illumination modules.
  • The regulatory enforcement of strict energy efficiency mandates for hospital electrical equipment has accelerated the phase-out of legacy incandescent devices, driving a 35% increase in capital equipment renewal cycles for solid-state Surgical Lights.
  • The widespread transition toward minimally invasive surgical techniques has shifted supply chain priorities toward compact endoscopic visualization towers, increasing the requirement for Surgical Lights equipped with near-infrared camera compatibility to support advanced procedural workflows.
  • Supply chain localized manufacturing initiatives in the APAC region have significantly lowered the production costs of medical-grade semiconductors, enabling a 20% faster adoption rate of smart hospital infrastructure and digitally connected Surgical Lights.

Dive into Technavio’s robust research methodology, blending expert interviews, extensive data synthesis, and validated models for unparalleled Surgical Lights Market insights. See full methodology.

Market Scope
Page number 304
Base year 2025
Historic period 2020-2024
Forecast period 2026-2030
Growth momentum & CAGR Accelerate at a CAGR of 4.5%
Market growth 2026-2030 USD 488.9 million
Market structure Fragmented
YoY growth 2025-2026(%) 4.3%
Key countries US, Canada, Mexico, Germany, UK, France, Italy, Spain, The Netherlands, China, India, Japan, South Korea, Thailand, Indonesia, Brazil, Saudi Arabia, UAE, Turkey, Argentina, Colombia, South Africa and Israel
Competitive landscape Leading Companies, Market Positioning of Companies, Competitive Strategies, and Industry Risks

Request Free Sample

Research Analyst Overview

  • The continuous modernization of clinical infrastructure places exceptional emphasis on the integration of advanced illumination technologies that elevate procedural precision and operational efficiency. By transitioning to sophisticated shadow-management lighting systems, healthcare institutions have successfully achieved a 25% reduction in equipment repositioning time during complex interventions.
  • This operational enhancement is largely driven by the implementation of weight-balanced spring arms and adjustable light field diameters, which provide clinicians with unprecedented spatial flexibility. Strategic boardroom decisions prioritize the adoption of sterile-drape-compatible interfaces to maintain stringent infection control protocols while optimizing surgical visualization. Furthermore, the incorporation of high-definition in-light cameras directly facilitates seamless multidisciplinary collaboration and rigorous procedural documentation.
  • Clinical facilities also heavily invest in multi-reflector configurations that guarantee precise color-corrected illumination, ensuring that intricate anatomical structures remain clearly defined. As medical institutions align their procurement strategies with rigorous compliance standards, these intelligent illumination platforms remain indispensable for mitigating visual fatigue and safeguarding superior clinical outcomes across highly demanding medical specialties.

What are the Key Data Covered in this Surgical Lights Market Research and Growth Report?

  • What is the expected growth of the Surgical Lights Market between 2026 and 2030?

    • USD 488.9 million, at a CAGR of 4.5%

  • What segmentation does the market report cover?

    • The report is segmented by End-user (Hospitals, Ambulatory surgical centers, and Others), Type (LED lights, and Halogen lights), Application (Cardiac surgery, Neurology, Gynaecological surgery, ENT surgery, and Others) and Geography (North America, Europe, Asia, Rest of World (ROW))

  • Which regions are analyzed in the report?

    • North America, Europe, Asia and Rest of World (ROW)

  • What are the key growth drivers and market challenges?

    • Technological shifts toward LED systems, Prohibitive capital expenditure and budget constraints

  • Who are the major players in the Surgical Lights Market?

    • Baxter International Inc., Burton Medical Products Corp, Dr. Mach GmbH and Co. KG, Dragerwerk AG and Co. KGaA, Gebruder Martin GmbH and Co., Getinge AB, Heal Force Biomeditech Holdings, Herbert Waldmann GmbH, Infinium Medical Inc., Integra LifeSciences Corp., Mediland Enterprise Corp., Olympus Corp., RIMSA P. Longoni S.r.l., S.I.M.E.O.N. Medical GmbH, Shenzhen Mindray Co. Ltd., SKYTRON LLC, STERIS plc, Stryker Corp. and Technomed India Pvt. Ltd.

Market Research Insights

  • The Surgical Lights Market is rapidly transforming as clinical facilities prioritize smart hospital infrastructure to enhance procedural precision. By integrating digital connectivity within operating theaters, healthcare networks have accelerated capital equipment renewal by 18%, replacing outdated halogen units with advanced illumination arrays.
  • The proliferation of ambulatory surgical centers demands highly adaptable ceiling-mounted suspension systems, which have demonstrated a 25% improvement in spatial utilization during complex cardiothoracic surgeries. Furthermore, enhanced interoperability between lighting fixtures and surgical navigation synchronization platforms reduces intraoperative delays by up to 15%, directly elevating operational efficiency and cost control.
  • As outpatient care environments expand, investing in human factors engineering ensures optimal surgeon comfort, minimizing fatigue while securing superior clinical outcomes across diverse medical specialties.

We can help! Our analysts can customize this surgical lights market research report to meet your requirements.

Get in touch

1. Executive Summary

1.1 Market overview

Executive Summary - Chart on Market Overview
Executive Summary - Data Table on Market Overview
Executive Summary - Chart on Global Market Characteristics
Executive Summary - Chart on Market by Geography
Executive Summary - Chart on Market Segmentation by End-user
Executive Summary - Chart on Market Segmentation by Type
Executive Summary - Chart on Market Segmentation by Application
Executive Summary - Chart on Incremental Growth
Executive Summary - Data Table on Incremental Growth
Executive Summary - Chart on Company Market Positioning

2. Technavio Analysis

2.1 Analysis of price sensitivity, lifecycle, customer purchase basket, adoption rates, and purchase criteria

2.2 Criticality of inputs and Factors of differentiation

Chart on Overview on criticality of inputs and factors of differentiation

2.3 Factors of disruption

Chart on Overview on factors of disruption

2.4 Impact of drivers and challenges

Chart on Impact of drivers and challenges in 2025 and 2030

3. Market Landscape

3.1 Market ecosystem

Chart on Parent Market
Data Table on - Parent Market

3.2 Market characteristics

Chart on Market characteristics analysis

3.3 Value chain analysis

Chart on Value chain analysis

4. Market Sizing

4.1 Market definition

Data Table on Offerings of companies included in the market definition

4.2 Market segment analysis

Market segments

4.3 Market size 2025

4.4 Market outlook: Forecast for 2025-2030

Chart on Global - Market size and forecast 2025-2030 ($ million)
Data Table on Global - Market size and forecast 2025-2030 ($ million)
Chart on Global Market: Year-over-year growth 2025-2030 (%)
Data Table on Global Market: Year-over-year growth 2025-2030 (%)

5. Historic Market Size

5.1 Global Surgical Lights Market 2020 - 2024

Historic Market Size - Data Table on Global Surgical Lights Market 2020 - 2024 ($ million)

5.2 End-user segment analysis 2020 - 2024

Historic Market Size - End-user Segment 2020 - 2024 ($ million)

5.3 Type segment analysis 2020 - 2024

Historic Market Size - Type Segment 2020 - 2024 ($ million)

5.4 Application segment analysis 2020 - 2024

Historic Market Size - Application Segment 2020 - 2024 ($ million)

5.5 Geography segment analysis 2020 - 2024

Historic Market Size - Geography Segment 2020 - 2024 ($ million)

5.6 Country segment analysis 2020 - 2024

Historic Market Size - Country Segment 2020 - 2024 ($ million)

6. Qualitative Analysis

6.1 Impact of AI on Global Surgical Lights Market

6.2 Impact of geopolitical conflicts on Global Surgical Lights Market

7. Five Forces Analysis

7.1 Five forces summary

Five forces analysis - Comparison between 2025 and 2030

7.2 Bargaining power of buyers

Bargaining power of buyers - Impact of key factors 2025 and 2030

7.3 Bargaining power of suppliers

Bargaining power of suppliers - Impact of key factors in 2025 and 2030

7.4 Threat of new entrants

Threat of new entrants - Impact of key factors in 2025 and 2030

7.5 Threat of substitutes

Threat of substitutes - Impact of key factors in 2025 and 2030

7.6 Threat of rivalry

Threat of rivalry - Impact of key factors in 2025 and 2030

7.7 Market condition

Chart on Market condition - Five forces 2025 and 2030

8. Market Segmentation by End-user

8.1 Market segments

Chart on End-user - Market share 2025-2030 (%)
Data Table on End-user - Market share 2025-2030 (%)

8.2 Comparison by End-user

Chart on Comparison by End-user
Data Table on Comparison by End-user

8.3 Hospitals - Market size and forecast 2025-2030

Chart on Hospitals - Market size and forecast 2025-2030 ($ million)
Data Table on Hospitals - Market size and forecast 2025-2030 ($ million)
Chart on Hospitals - Year-over-year growth 2025-2030 (%)
Data Table on Hospitals - Year-over-year growth 2025-2030 (%)

8.4 Ambulatory surgical centers - Market size and forecast 2025-2030

Chart on Ambulatory surgical centers - Market size and forecast 2025-2030 ($ million)
Data Table on Ambulatory surgical centers - Market size and forecast 2025-2030 ($ million)
Chart on Ambulatory surgical centers - Year-over-year growth 2025-2030 (%)
Data Table on Ambulatory surgical centers - Year-over-year growth 2025-2030 (%)

8.5 Others - Market size and forecast 2025-2030

Chart on Others - Market size and forecast 2025-2030 ($ million)
Data Table on Others - Market size and forecast 2025-2030 ($ million)
Chart on Others - Year-over-year growth 2025-2030 (%)
Data Table on Others - Year-over-year growth 2025-2030 (%)

8.6 Market opportunity by End-user

Market opportunity by End-user ($ million)
Data Table on Market opportunity by End-user ($ million)

9. Market Segmentation by Type

9.1 Market segments

Chart on Type - Market share 2025-2030 (%)
Data Table on Type - Market share 2025-2030 (%)

9.2 Comparison by Type

Chart on Comparison by Type
Data Table on Comparison by Type

9.3 LED lights - Market size and forecast 2025-2030

Chart on LED lights - Market size and forecast 2025-2030 ($ million)
Data Table on LED lights - Market size and forecast 2025-2030 ($ million)
Chart on LED lights - Year-over-year growth 2025-2030 (%)
Data Table on LED lights - Year-over-year growth 2025-2030 (%)

9.4 Halogen lights - Market size and forecast 2025-2030

Chart on Halogen lights - Market size and forecast 2025-2030 ($ million)
Data Table on Halogen lights - Market size and forecast 2025-2030 ($ million)
Chart on Halogen lights - Year-over-year growth 2025-2030 (%)
Data Table on Halogen lights - Year-over-year growth 2025-2030 (%)

9.5 Market opportunity by Type

Market opportunity by Type ($ million)
Data Table on Market opportunity by Type ($ million)

10. Market Segmentation by Application

10.1 Market segments

Chart on Application - Market share 2025-2030 (%)
Data Table on Application - Market share 2025-2030 (%)

10.2 Comparison by Application

Chart on Comparison by Application
Data Table on Comparison by Application

10.3 Cardiac surgery - Market size and forecast 2025-2030

Chart on Cardiac surgery - Market size and forecast 2025-2030 ($ million)
Data Table on Cardiac surgery - Market size and forecast 2025-2030 ($ million)
Chart on Cardiac surgery - Year-over-year growth 2025-2030 (%)
Data Table on Cardiac surgery - Year-over-year growth 2025-2030 (%)

10.4 Neurology - Market size and forecast 2025-2030

Chart on Neurology - Market size and forecast 2025-2030 ($ million)
Data Table on Neurology - Market size and forecast 2025-2030 ($ million)
Chart on Neurology - Year-over-year growth 2025-2030 (%)
Data Table on Neurology - Year-over-year growth 2025-2030 (%)

10.5 Gynaecological surgery - Market size and forecast 2025-2030

Chart on Gynaecological surgery - Market size and forecast 2025-2030 ($ million)
Data Table on Gynaecological surgery - Market size and forecast 2025-2030 ($ million)
Chart on Gynaecological surgery - Year-over-year growth 2025-2030 (%)
Data Table on Gynaecological surgery - Year-over-year growth 2025-2030 (%)

10.6 ENT surgery - Market size and forecast 2025-2030

Chart on ENT surgery - Market size and forecast 2025-2030 ($ million)
Data Table on ENT surgery - Market size and forecast 2025-2030 ($ million)
Chart on ENT surgery - Year-over-year growth 2025-2030 (%)
Data Table on ENT surgery - Year-over-year growth 2025-2030 (%)

10.7 Others - Market size and forecast 2025-2030

Chart on Others - Market size and forecast 2025-2030 ($ million)
Data Table on Others - Market size and forecast 2025-2030 ($ million)
Chart on Others - Year-over-year growth 2025-2030 (%)
Data Table on Others - Year-over-year growth 2025-2030 (%)

10.8 Market opportunity by Application

Market opportunity by Application ($ million)
Data Table on Market opportunity by Application ($ million)

11. Customer Landscape

11.1 Customer landscape overview

Analysis of price sensitivity, lifecycle, customer purchase basket, adoption rates, and purchase criteria

12. Geographic Landscape

12.1 Geographic segmentation

Chart on Market share by geography 2025-2030 (%)
Data Table on Market share by geography 2025-2030 (%)

12.2 Geographic comparison

Chart on Geographic comparison
Data Table on Geographic comparison

12.3 North America - Market size and forecast 2025-2030

Chart on North America - Market size and forecast 2025-2030 ($ million)
Data Table on North America - Market size and forecast 2025-2030 ($ million)
Chart on North America - Year-over-year growth 2025-2030 (%)
Data Table on North America - Year-over-year growth 2025-2030 (%)
Chart on Regional Comparison - North America
Data Table on Regional Comparison - North America

12.3.1 US - Market size and forecast 2025-2030

Chart on US - Market size and forecast 2025-2030 ($ million)
Data Table on US - Market size and forecast 2025-2030 ($ million)
Chart on US - Year-over-year growth 2025-2030 (%)
Data Table on US - Year-over-year growth 2025-2030 (%)

12.3.2 Canada - Market size and forecast 2025-2030

Chart on Canada - Market size and forecast 2025-2030 ($ million)
Data Table on Canada - Market size and forecast 2025-2030 ($ million)
Chart on Canada - Year-over-year growth 2025-2030 (%)
Data Table on Canada - Year-over-year growth 2025-2030 (%)

12.3.3 Mexico - Market size and forecast 2025-2030

Chart on Mexico - Market size and forecast 2025-2030 ($ million)
Data Table on Mexico - Market size and forecast 2025-2030 ($ million)
Chart on Mexico - Year-over-year growth 2025-2030 (%)
Data Table on Mexico - Year-over-year growth 2025-2030 (%)

12.4 Europe - Market size and forecast 2025-2030

Chart on Europe - Market size and forecast 2025-2030 ($ million)
Data Table on Europe - Market size and forecast 2025-2030 ($ million)
Chart on Europe - Year-over-year growth 2025-2030 (%)
Data Table on Europe - Year-over-year growth 2025-2030 (%)
Chart on Regional Comparison - Europe
Data Table on Regional Comparison - Europe

12.4.1 Germany - Market size and forecast 2025-2030

Chart on Germany - Market size and forecast 2025-2030 ($ million)
Data Table on Germany - Market size and forecast 2025-2030 ($ million)
Chart on Germany - Year-over-year growth 2025-2030 (%)
Data Table on Germany - Year-over-year growth 2025-2030 (%)

12.4.2 UK - Market size and forecast 2025-2030

Chart on UK - Market size and forecast 2025-2030 ($ million)
Data Table on UK - Market size and forecast 2025-2030 ($ million)
Chart on UK - Year-over-year growth 2025-2030 (%)
Data Table on UK - Year-over-year growth 2025-2030 (%)

12.4.3 France - Market size and forecast 2025-2030

Chart on France - Market size and forecast 2025-2030 ($ million)
Data Table on France - Market size and forecast 2025-2030 ($ million)
Chart on France - Year-over-year growth 2025-2030 (%)
Data Table on France - Year-over-year growth 2025-2030 (%)

12.4.4 Italy - Market size and forecast 2025-2030

Chart on Italy - Market size and forecast 2025-2030 ($ million)
Data Table on Italy - Market size and forecast 2025-2030 ($ million)
Chart on Italy - Year-over-year growth 2025-2030 (%)
Data Table on Italy - Year-over-year growth 2025-2030 (%)

12.4.5 Spain - Market size and forecast 2025-2030

Chart on Spain - Market size and forecast 2025-2030 ($ million)
Data Table on Spain - Market size and forecast 2025-2030 ($ million)
Chart on Spain - Year-over-year growth 2025-2030 (%)
Data Table on Spain - Year-over-year growth 2025-2030 (%)

12.4.6 The Netherlands - Market size and forecast 2025-2030

Chart on The Netherlands - Market size and forecast 2025-2030 ($ million)
Data Table on The Netherlands - Market size and forecast 2025-2030 ($ million)
Chart on The Netherlands - Year-over-year growth 2025-2030 (%)
Data Table on The Netherlands - Year-over-year growth 2025-2030 (%)

12.5 Asia - Market size and forecast 2025-2030

Chart on Asia - Market size and forecast 2025-2030 ($ million)
Data Table on Asia - Market size and forecast 2025-2030 ($ million)
Chart on Asia - Year-over-year growth 2025-2030 (%)
Data Table on Asia - Year-over-year growth 2025-2030 (%)
Chart on Regional Comparison - Asia
Data Table on Regional Comparison - Asia

12.5.1 China - Market size and forecast 2025-2030

Chart on China - Market size and forecast 2025-2030 ($ million)
Data Table on China - Market size and forecast 2025-2030 ($ million)
Chart on China - Year-over-year growth 2025-2030 (%)
Data Table on China - Year-over-year growth 2025-2030 (%)

12.5.2 India - Market size and forecast 2025-2030

Chart on India - Market size and forecast 2025-2030 ($ million)
Data Table on India - Market size and forecast 2025-2030 ($ million)
Chart on India - Year-over-year growth 2025-2030 (%)
Data Table on India - Year-over-year growth 2025-2030 (%)

12.5.3 Japan - Market size and forecast 2025-2030

Chart on Japan - Market size and forecast 2025-2030 ($ million)
Data Table on Japan - Market size and forecast 2025-2030 ($ million)
Chart on Japan - Year-over-year growth 2025-2030 (%)
Data Table on Japan - Year-over-year growth 2025-2030 (%)

12.5.4 South Korea - Market size and forecast 2025-2030

Chart on South Korea - Market size and forecast 2025-2030 ($ million)
Data Table on South Korea - Market size and forecast 2025-2030 ($ million)
Chart on South Korea - Year-over-year growth 2025-2030 (%)
Data Table on South Korea - Year-over-year growth 2025-2030 (%)

12.5.5 Thailand - Market size and forecast 2025-2030

Chart on Thailand - Market size and forecast 2025-2030 ($ million)
Data Table on Thailand - Market size and forecast 2025-2030 ($ million)
Chart on Thailand - Year-over-year growth 2025-2030 (%)
Data Table on Thailand - Year-over-year growth 2025-2030 (%)

12.5.6 Indonesia - Market size and forecast 2025-2030

Chart on Indonesia - Market size and forecast 2025-2030 ($ million)
Data Table on Indonesia - Market size and forecast 2025-2030 ($ million)
Chart on Indonesia - Year-over-year growth 2025-2030 (%)
Data Table on Indonesia - Year-over-year growth 2025-2030 (%)

12.6 Rest of World (ROW) - Market size and forecast 2025-2030

Chart on Rest of World (ROW) - Market size and forecast 2025-2030 ($ million)
Data Table on Rest of World (ROW) - Market size and forecast 2025-2030 ($ million)
Chart on Rest of World (ROW) - Year-over-year growth 2025-2030 (%)
Data Table on Rest of World (ROW) - Year-over-year growth 2025-2030 (%)
Chart on Regional Comparison - Rest of World (ROW)
Data Table on Regional Comparison - Rest of World (ROW)

12.6.1 Brazil - Market size and forecast 2025-2030

Chart on Brazil - Market size and forecast 2025-2030 ($ million)
Data Table on Brazil - Market size and forecast 2025-2030 ($ million)
Chart on Brazil - Year-over-year growth 2025-2030 (%)
Data Table on Brazil - Year-over-year growth 2025-2030 (%)

12.6.2 Saudi Arabia - Market size and forecast 2025-2030

Chart on Saudi Arabia - Market size and forecast 2025-2030 ($ million)
Data Table on Saudi Arabia - Market size and forecast 2025-2030 ($ million)
Chart on Saudi Arabia - Year-over-year growth 2025-2030 (%)
Data Table on Saudi Arabia - Year-over-year growth 2025-2030 (%)

12.6.3 UAE - Market size and forecast 2025-2030

Chart on UAE - Market size and forecast 2025-2030 ($ million)
Data Table on UAE - Market size and forecast 2025-2030 ($ million)
Chart on UAE - Year-over-year growth 2025-2030 (%)
Data Table on UAE - Year-over-year growth 2025-2030 (%)

12.6.4 Turkey - Market size and forecast 2025-2030

Chart on Turkey - Market size and forecast 2025-2030 ($ million)
Data Table on Turkey - Market size and forecast 2025-2030 ($ million)
Chart on Turkey - Year-over-year growth 2025-2030 (%)
Data Table on Turkey - Year-over-year growth 2025-2030 (%)

12.6.5 Argentina - Market size and forecast 2025-2030

Chart on Argentina - Market size and forecast 2025-2030 ($ million)
Data Table on Argentina - Market size and forecast 2025-2030 ($ million)
Chart on Argentina - Year-over-year growth 2025-2030 (%)
Data Table on Argentina - Year-over-year growth 2025-2030 (%)

12.6.6 Colombia - Market size and forecast 2025-2030

Chart on Colombia - Market size and forecast 2025-2030 ($ million)
Data Table on Colombia - Market size and forecast 2025-2030 ($ million)
Chart on Colombia - Year-over-year growth 2025-2030 (%)
Data Table on Colombia - Year-over-year growth 2025-2030 (%)

12.6.7 South Africa - Market size and forecast 2025-2030

Chart on South Africa - Market size and forecast 2025-2030 ($ million)
Data Table on South Africa - Market size and forecast 2025-2030 ($ million)
Chart on South Africa - Year-over-year growth 2025-2030 (%)
Data Table on South Africa - Year-over-year growth 2025-2030 (%)

12.6.8 Israel - Market size and forecast 2025-2030

Chart on Israel - Market size and forecast 2025-2030 ($ million)
Data Table on Israel - Market size and forecast 2025-2030 ($ million)
Chart on Israel - Year-over-year growth 2025-2030 (%)
Data Table on Israel - Year-over-year growth 2025-2030 (%)

12.7 Market opportunity by geography

Market opportunity by geography ($ million)
Data Tables on Market opportunity by geography ($ million)

13. Drivers, Challenges, and Opportunity

13.1 Market drivers

Technological shifts toward LED systems
Rising volume of surgical procedures
Expansion of ambulatory surgical centers

13.2 Market challenges

Prohibitive capital expenditure and budget constraints
Complex regulatory compliance and approval processes
Integration difficulties and infrastructure compatibility

13.3 Impact of drivers and challenges

Impact of drivers and challenges in 2025 and 2030

13.4 Market opportunities

Integration of smart digital ecosystems
Rise of hybrid operating room configurations
Growing demand for ergonomic customization

14. Competitive Landscape

14.1 Overview

14.2

Overview on criticality of inputs and factors of differentiation

14.3 Landscape disruption

Overview on factors of disruption

14.4 Industry risks

Impact of key risks on business

15. Competitive Analysis

15.1 Companies profiled

Companies covered

15.2 Company ranking index

15.3 Market positioning of companies

Matrix on companies position and classification

15.4 Baxter International Inc.

Baxter International Inc. - Overview
Baxter International Inc. - Business segments
Baxter International Inc. - Key news
Baxter International Inc. - Key offerings
Baxter International Inc. - Segment focus
SWOT

15.5 Burton Medical Products Corp

Burton Medical Products Corp - Overview
Burton Medical Products Corp - Product / Service
Burton Medical Products Corp - Key offerings
SWOT

15.6 Dragerwerk AG and Co. KGaA

Dragerwerk AG and Co. KGaA - Overview
Dragerwerk AG and Co. KGaA - Business segments
Dragerwerk AG and Co. KGaA - Key offerings
Dragerwerk AG and Co. KGaA - Segment focus
SWOT

15.7 Gebruder Martin GmbH and Co.

Gebruder Martin GmbH and Co. - Overview
Gebruder Martin GmbH and Co. - Product / Service
Gebruder Martin GmbH and Co. - Key offerings
SWOT

15.8 Getinge AB

Getinge AB - Overview
Getinge AB - Business segments
Getinge AB - Key offerings
Getinge AB - Segment focus
SWOT

15.9 Heal Force Biomeditech Holdings

Heal Force Biomeditech Holdings - Overview
Heal Force Biomeditech Holdings - Product / Service
Heal Force Biomeditech Holdings - Key offerings
SWOT

15.10 Herbert Waldmann GmbH

Herbert Waldmann GmbH - Overview
Herbert Waldmann GmbH - Product / Service
Herbert Waldmann GmbH - Key offerings
SWOT

15.11 Integra LifeSciences Corp.

Integra LifeSciences Corp. - Overview
Integra LifeSciences Corp. - Business segments
Integra LifeSciences Corp. - Key offerings
Integra LifeSciences Corp. - Segment focus
SWOT

15.12 Mediland Enterprise Corp.

Mediland Enterprise Corp. - Overview
Mediland Enterprise Corp. - Product / Service
Mediland Enterprise Corp. - Key offerings
SWOT

15.13 Olympus Corp.

Olympus Corp. - Overview
Olympus Corp. - Business segments
Olympus Corp. - Key offerings
Olympus Corp. - Segment focus
SWOT

15.14 S.I.M.E.O.N. Medical GmbH

S.I.M.E.O.N. Medical GmbH - Overview
S.I.M.E.O.N. Medical GmbH - Product / Service
S.I.M.E.O.N. Medical GmbH - Key offerings
SWOT

15.15 Shenzhen Mindray Co. Ltd.

Shenzhen Mindray Co. Ltd. - Overview
Shenzhen Mindray Co. Ltd. - Business segments
Shenzhen Mindray Co. Ltd. - Key offerings
Shenzhen Mindray Co. Ltd. - Segment focus
SWOT

15.16 STERIS plc

STERIS plc - Overview
STERIS plc - Business segments
STERIS plc - Key offerings
STERIS plc - Segment focus
SWOT

15.17 Stryker Corp.

Stryker Corp. - Overview
Stryker Corp. - Business segments
Stryker Corp. - Key offerings
Stryker Corp. - Segment focus
SWOT

15.18 Technomed India Pvt. Ltd.

Technomed India Pvt. Ltd. - Overview
Technomed India Pvt. Ltd. - Product / Service
Technomed India Pvt. Ltd. - Key offerings
SWOT

16. Appendix

16.1 Scope of the report

Market definition
Objectives
Notes and caveats

16.2 Inclusions and exclusions checklist

Inclusions checklist
Exclusions checklist

16.3 Currency conversion rates for US$

16.4 Research methodology

16.5 Data procurement

Information sources

16.6 Data validation

16.7 Validation techniques employed for market sizing

16.8 Data synthesis

16.9 360 degree market analysis

16.10 List of abbreviations

Research Methodology

Technavio presents a detailed picture of the market by way of study, synthesis, and summation of data from multiple sources. The analysts have presented the various facets of the market with a particular focus on identifying the key industry influencers. The data thus presented is comprehensive, reliable, and the result of extensive research, both primary and secondary.

INFORMATION SOURCES

Primary sources

  • Manufacturers and suppliers
  • Channel partners
  • Industry experts
  • Strategic decision makers

Secondary sources

  • Industry journals and periodicals
  • Government data
  • Financial reports of key industry players
  • Historical data
  • Press releases

DATA ANALYSIS

Data Synthesis

  • Collation of data
  • Estimation of key figures
  • Analysis of derived insights

Data Validation

  • Triangulation with data models
  • Reference against proprietary databases
  • Corroboration with industry experts

REPORT WRITING

Qualitative

  • Market drivers
  • Market challenges
  • Market trends
  • Five forces analysis

Quantitative

  • Market size and forecast
  • Market segmentation
  • Geographical insights
  • Competitive landscape

Interested in this report?

Get your sample now to see our research methodology and insights!

Download Now

Frequently Asked Questions

Surgical Lights market growth will increase by USD 488.9 million during 2026-2030.

The Surgical Lights market is expected to grow at a CAGR of 4.5% during 2026-2030.

Surgical Lights market is segmented by End-user (Hospitals, Ambulatory surgical centers, Others) Type (LED lights, Halogen lights) Application (Cardiac surgery, Neurology, Gynaecological surgery, ENT surgery, Others)

Baxter International Inc., Burton Medical Products Corp, Dr. Mach GmbH and Co. KG, Dragerwerk AG and Co. KGaA, Gebruder Martin GmbH and Co., Getinge AB, Heal Force Biomeditech Holdings, Herbert Waldmann GmbH, Infinium Medical Inc., Integra LifeSciences Corp., Mediland Enterprise Corp., Olympus Corp., RIMSA P. Longoni S.r.l., S.I.M.E.O.N. Medical GmbH, Shenzhen Mindray Co. Ltd., SKYTRON LLC, STERIS plc, Stryker Corp., Technomed India Pvt. Ltd. are a few of the key vendors in the Surgical Lights market.

North America will register the highest growth rate of 35.3% among the other regions. Therefore, the Surgical Lights market in North America is expected to garner significant business opportunities for the vendors during the forecast period.

US, Canada, Mexico, Germany, UK, France, Italy, Spain, The Netherlands, China, India, Japan, South Korea, Thailand, Indonesia, Brazil, Saudi Arabia, UAE, Turkey, Argentina, Colombia, South Africa, Israel

  • Technological shifts toward LED systems is the driving factor this market.

The Surgical Lights market vendors should focus on grabbing business opportunities from the End-user segment as it accounted for the largest market share in the base year.
RIA - Research AI Assistant
Ask RIA
