Synthetic Data Generation For AI Training Market Analysis, Size, and Forecast 2026-2030: North America (US, Canada, and Mexico), Europe (Germany, UK, and France), APAC (China, India, and Japan), Middle East and Africa (Saudi Arabia, UAE, and South Africa), South America (Brazil, Argentina, and Colombia), and Rest of World (ROW)

Synthetic Data Generation For AI Training Market Analysis, Size, and Forecast 2026-2030:
North America (US, Canada, and Mexico), Europe (Germany, UK, and France), APAC (China, India, and Japan), Middle East and Africa (Saudi Arabia, UAE, and South Africa), South America (Brazil, Argentina, and Colombia), and Rest of World (ROW)

Published: May 2026 313 Pages SKU: IRTNTR81366

Market Overview at a Glance

$704.88 Mn
Market Opportunity
37.3%
CAGR 2025 - 2030
37.6%
North America Growth
$55.56 Mn
Tabular data segment 2024

Synthetic Data Generation For Ai Training Market Size and Growth Forecast 2026-2030

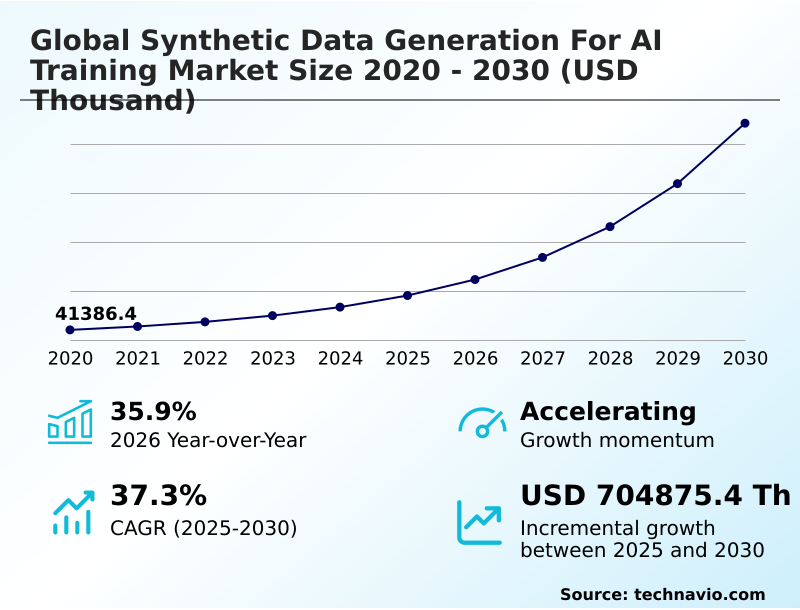
The Synthetic Data Generation For Ai Training Market size was valued at USD 182.01 million in 2025 growing at a CAGR of 37.3% during the forecast period 2026-2030.

North America accounts for 37.6% of incremental growth during the forecast period. The Tabular data segment by Type was valued at USD 55.56 million in 2024, while the BFSI segment holds the largest revenue share by End-user.

The market is projected to grow by from 2020 to 2030, with USD 704.88 million of the growth expected during the forecast period of 2025 to 2030.

Get Key Insights on Market Forecast (PDF) Request Free Sample

Synthetic Data Generation For Ai Training Market Overview

The synthetic data generation for ai training market is expanding as organizations navigate stringent data privacy laws like GDPR and CCPA, which restrict the use of real-world personal information. This regulatory pressure makes privacy-enhancing technologies and high-fidelity data generation essential for innovation. The core challenge remains preventing model collapse prevention, where AI systems trained on artificial data lose touch with real-world nuances. To address this, developers use generative adversarial networks for statistical property replication, ensuring AI model robustness. For example, a leading automotive manufacturer, by leveraging computer vision simulation and over five billion miles of synthetic sensor data for autonomous systems training data, reduced its safety validation timeline by nearly 40%. With North America contributing over 37% of the incremental growth and the overall market accelerating at a 35.9% year-over-year rate, the focus is on creating scalable, trustworthy data scarcity solutions. This includes developing advanced data anonymization techniques and automated data annotation to fuel the next generation of AI.

Drivers, Trends, and Challenges in the Synthetic Data Generation For Ai Training Market

The complexity of modern AI systems necessitates advanced approaches to data provisioning, moving beyond simple data collection.

The use of synthetic data for rare event modeling is now standard practice in safety-critical sectors; for instance, in autonomous driving, billions of simulated miles are used to train models for scenarios that are too dangerous to test physically, demonstrating the value of high-fidelity synthetic data for autonomous driving.

Concurrently, the imperative for generating balanced datasets for AI fairness, mandated by frameworks like the EU AI Act, is reshaping development priorities. This is particularly relevant when training large language models synthetically, as it allows developers to mitigate inherent biases found in web-scraped data and avoid the data exhaustion problem.

A key technical focus is on mitigating model collapse in AI, a phenomenon where models lose diversity when trained on their own output. To counter this, techniques such as privacy-preserving federated learning with synthetic data are being deployed, allowing models to be updated without centralizing sensitive information.

In practice, the time required for synthetic data for computer vision applications can be over 30% faster than traditional methods. Firms creating synthetic data for financial modeling and synthetic medical diagnosis data are leveraging these efficiencies to accelerate innovation while ensuring compliance.

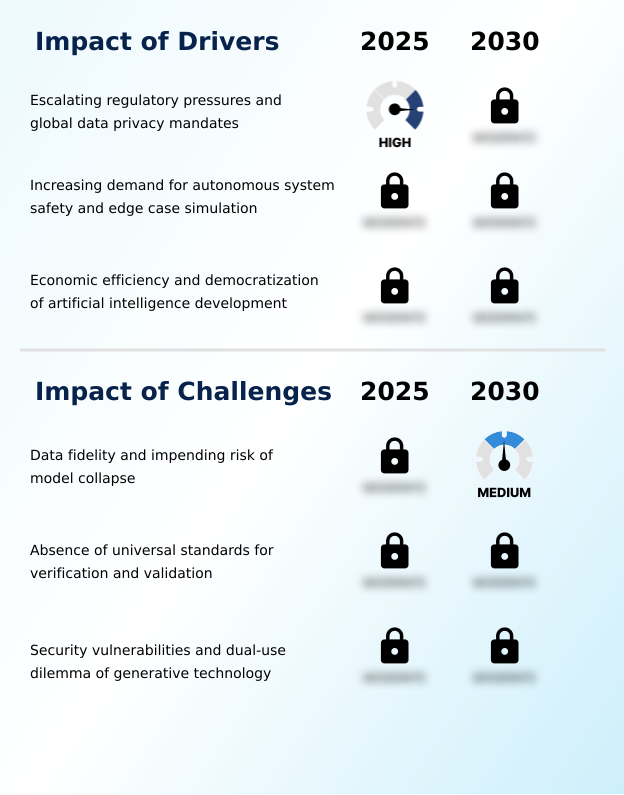
Primary Growth Driver: Escalating regulatory pressures and global data privacy mandates are a key driver for market growth.

Stringent data privacy regulations, including GDPR and CCPA, are a primary driver, compelling organizations to adopt privacy-by-design principles and utilize synthetic data to avoid non-compliance penalties.

Another major factor is the demand for AI model robustness in autonomous systems, which require vast amounts of training data for edge case simulation that is impractical to collect in the real world.

The automotive sector's growing adoption reflects this need. Additionally, economic efficiency accelerates adoption, as automated data anonymization techniques and pre-labeled dataset creation offer a cost-effective alternative to manual data acquisition.

This democratization of AI development also supports algorithmic bias mitigation by enabling the creation of balanced and representative training sets.

Emerging Market Trend: A key trend is the emergence of high-fidelity, multi-modal synthetic environments designed for spatial computing. These advanced simulations are becoming essential for training sophisticated AI applications.

The market is advancing beyond static datasets toward high-fidelity, multi-modal synthetic environments. This trend is driven by demand from spatial computing and robotics, which require synchronized data for applications like AI gesture recognition.

A significant development is the convergence of synthetic data generation with federated learning integration, a technique gaining momentum in APAC, which is projected to grow at a CAGR of 38.0%. This approach addresses data sovereignty and privacy concerns.

Furthermore, the industry is moving toward autonomous data curation through closed-loop training systems, where AI models identify their own performance gaps and request specific synthetic datasets to improve, indicating a maturation of AI-powered fraud detection and optimization capabilities.

Key Industry Challenge: Maintaining data fidelity and mitigating the impending risk of model collapse represent a key challenge affecting industry growth.

A significant technical challenge is maintaining data fidelity to prevent model collapse, where AI models degrade after being trained on their own synthetic outputs. This requires sophisticated methods for ensuring statistical property replication without sacrificing diversity.

The absence of universal standards for AI model validation creates adoption friction, especially in safety-critical industries that require verifiable quality benchmarks, a need highlighted by the formation of a global standards committee in July 2025.

Moreover, the dual-use nature of generative adversarial networks presents a security risk, as the technology can be used for malicious purposes like creating deepfakes, demanding robust AI training data security and provenance technologies to ensure responsible use.

Explore Full Market Dynamics Analysis Request Free Sample

Synthetic Data Generation For Ai Training Market Segmentation

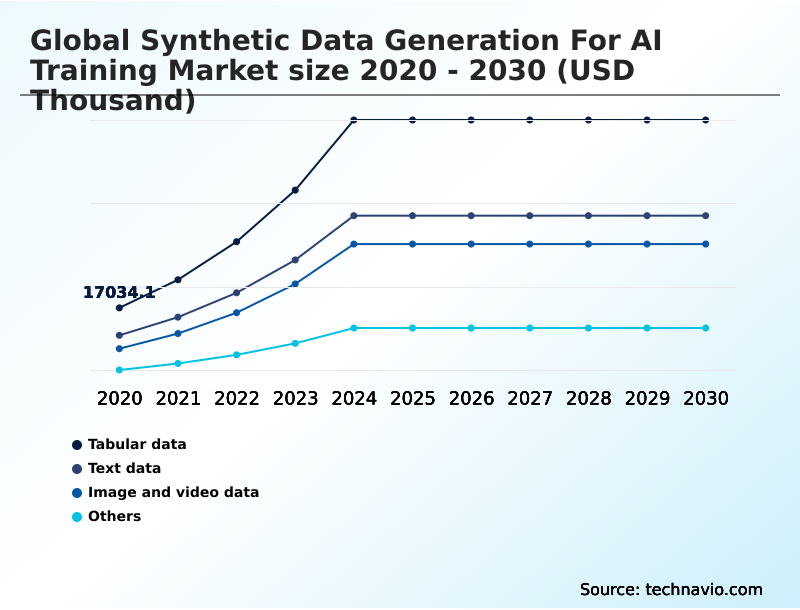
The synthetic data generation for ai training industry research report provides comprehensive data including region-wise segment analysis, with forecasts and analysis for the period 2026-2030, as well as historical data from 2020-2024 for the following segments.

Market Segment by Type
  • Tabular data
  • Text data
  • Image and video data
  • Others
Market Segment by End-user
  • BFSI
  • Healthcare
  • Automotive
  • IT and telecom
  • Others
Market Segment by Product
  • Fully synthetic data
  • Partially synthetic data
Market Segment by Geography
North America
US, Canada, Mexico
Europe
Germany, UK, France, Italy, Spain, The Netherlands
APAC
China, India, Japan, South Korea, Australia, Singapore
Middle East and Africa
Saudi Arabia, UAE, South Africa, Israel, Turkey
South America
Brazil, Argentina, Colombia

Type Segment Analysis

The tabular data segment is estimated to witness significant growth during the forecast period.

The synthetic data generation for ai training market is segmented by data type and end-user, addressing distinct operational needs.

Tabular data, which includes synthetic tabular data generation, is pivotal for regulated sectors like BFSI and healthcare, where privacy-enhancing technologies are mandated for applications such as AI-powered risk assessment.

Image and video data are essential for computer vision simulation and providing autonomous systems training data.

The BFSI segment represents a significant portion of end-user demand, driven by strict regulatory data compliance needs under frameworks like the General Data Protection Regulation (GDPR).

This necessity for secure, high-quality information to train models without compromising sensitive data underpins the market's structure and growth, with North America leading in adoption, contributing over 37% of the market opportunity.

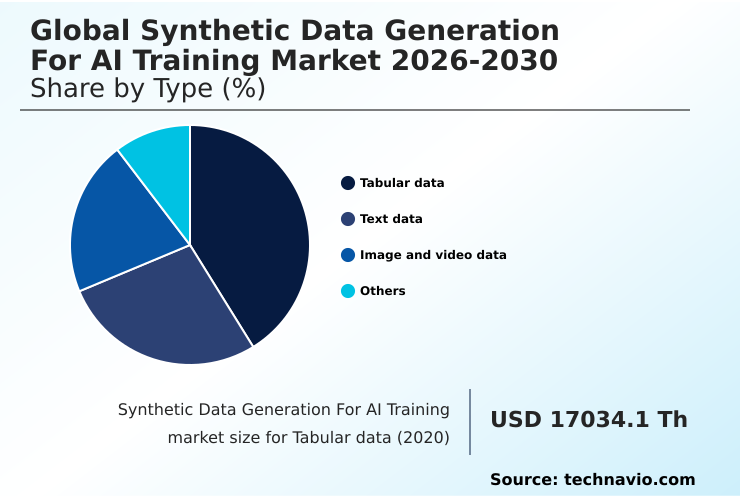
The Tabular data segment was valued at USD 55.56 million in 2024 and showed a gradual increase during the forecast period.

Synthetic Data Generation For Ai Training Market by Region: North America Leads with 37.6% Growth Share

North America is estimated to contribute 37.6% to the growth of the global market during the forecast period.

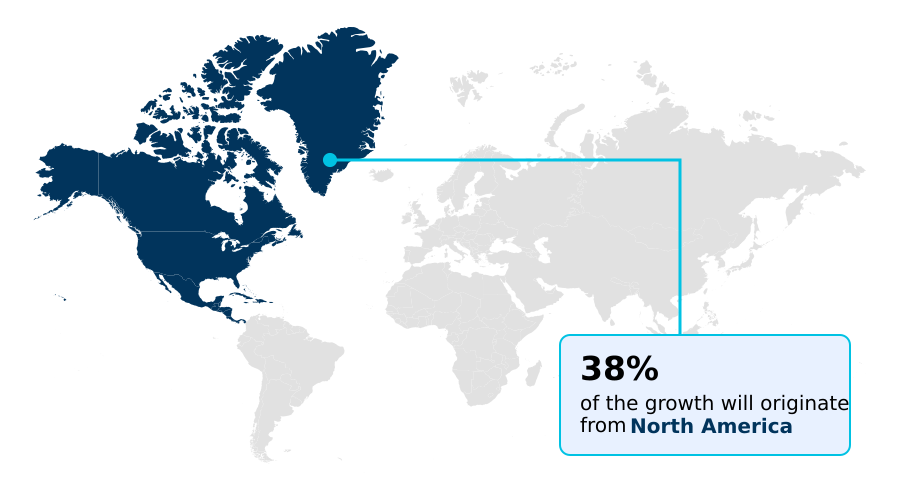
The geographic landscape is led by North America, which accounts for over 37% of the global market opportunity, driven by advanced autonomous vehicle simulation and AI model validation requirements in its established technology sector.

Europe, representing nearly 28% of the market, prioritizes regulatory data compliance under GDPR, fueling adoption in finance and healthcare.

The fastest growth is in APAC, which holds a 25% market share and is propelled by large-scale AI in smart cities projects and manufacturing modernization. These initiatives demand sophisticated sensor data simulation and AI-driven data curation.

Across all regions, the need for data sovereignty solutions is accelerating the deployment of localized platforms for synthetic data for cybersecurity and other critical applications, ensuring that generative AI for NLP and other models can be trained without cross-border data transfers.

Customer Landscape Analysis for the Synthetic Data Generation For Ai Training Market

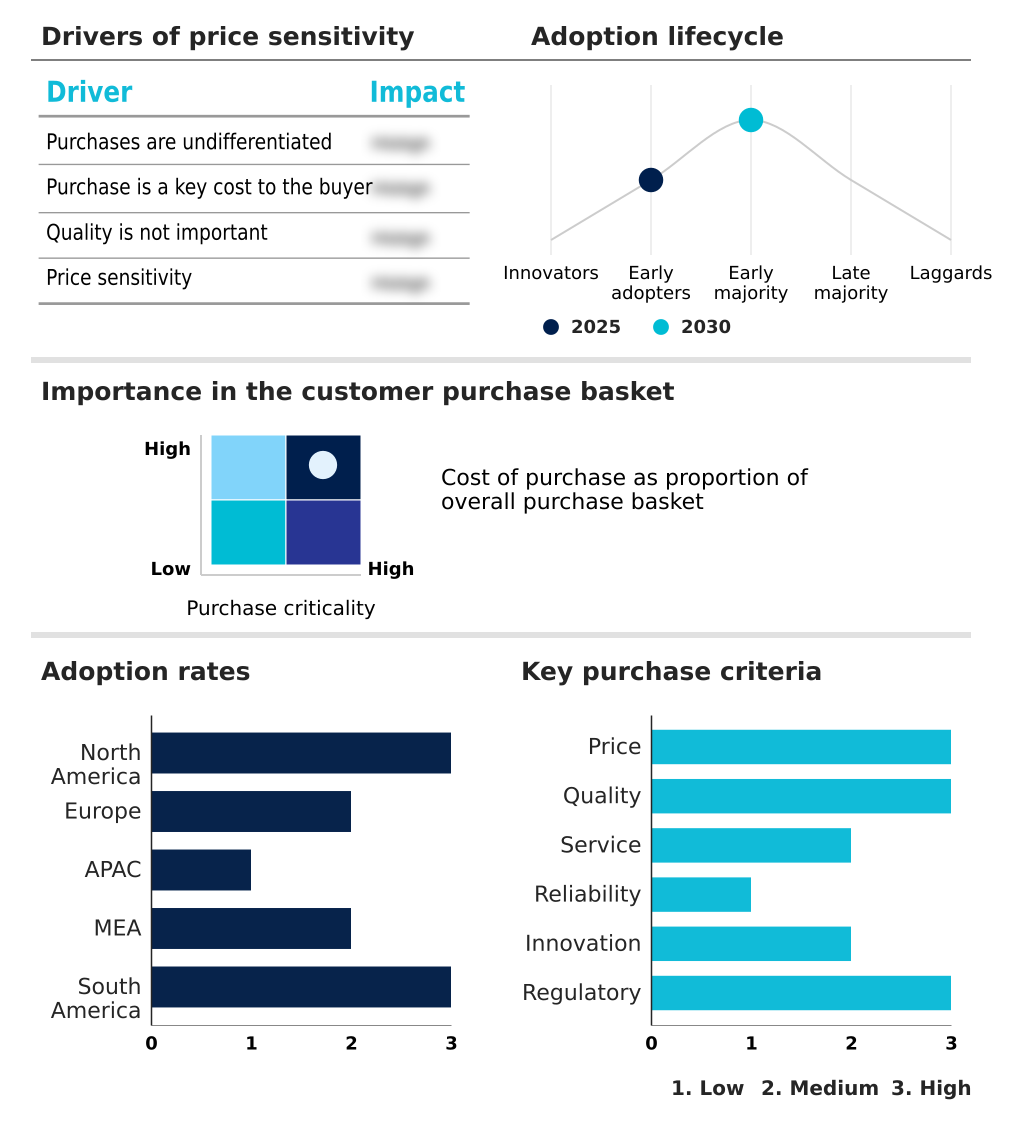
The synthetic data generation for ai training market forecasting report includes the adoption lifecycle of the market, covering from the innovator’s stage to the laggard’s stage. It focuses on adoption rates in different regions based on penetration. Furthermore, the synthetic data generation for ai training market report also includes key purchase criteria and drivers of price sensitivity to help companies evaluate and develop their market growth analysis strategies.

Competitive Landscape of the Synthetic Data Generation For Ai Training Market

Companies are implementing various strategies, such as strategic alliances, partnerships, mergers and acquisitions, geographical expansion, and product/service launches, to enhance their presence in the synthetic data generation for ai training market industry.

Anonos. - Offerings focus on generating privacy-preserving data assets through advanced anonymization, enabling secure AI model development while maintaining strict regulatory compliance.

The industry research and growth report includes detailed analyses of the competitive landscape of the market and information about key companies, including:

  • Anonos.
  • BetterData Pte Ltd.
  • Broadcom Inc.
  • Capgemini SE
  • DataGen
  • Facteus Inc
  • GenRocket Inc.
  • Gretel AI
  • IBM Corp.
  • Informatica Inc.
  • K2view Ltd.
  • MDClone Ltd.
  • MOSTLY AI
  • NVIDIA Corp.
  • Parallel Domain
  • Rendered.ai
  • Synthesise AI.
  • Syntho
  • Tonic AI Inc.
  • YData Labs Inc

Qualitative and quantitative analysis of companies has been conducted to help clients understand the wider business environment as well as the strengths and weaknesses of key industry players. Data is qualitatively analyzed to categorize companies as pure play, category-focused, industry-focused, and diversified; it is quantitatively analyzed to categorize companies as dominant, leading, strong, tentative, and weak.

Recent Developments in the Synthetic Data Generation For Ai Training Market

  • In January, 2025, a leading technology corporation in Seattle launched an initiative to provide synthetic datasets for simulating complex weather patterns to assist disaster response teams.
  • In February, 2025, a major national space exploration agency in the United States initiated a public-private partnership to develop high-resolution synthetic imagery of lunar and Martian surfaces for training autonomous rovers.
  • In March, 2025, a leading telecommunications equipment provider in North America utilized synthetic network traffic data to test the scalability of its new cloud-native core architecture before its official product launch.
  • In April, 2025, a prominent engineering firm in Stuttgart revealed a new synthetic simulation platform designed for training collaborative robots that work alongside human operators in industrial settings.

Research Analyst Overview: Synthetic Data Generation For Ai Training Market

The increasing reliance on generative adversarial networks and variational autoencoders is fundamentally shifting enterprise focus from data acquisition to the quality assurance of synthesized information. This transition compels a strategic re-evaluation of R&D budgets at the boardroom level, redirecting investment from manual data labeling toward platforms that support high-fidelity data generation and specialized talent for AI model validation.

The BFSI sector's position as the largest end-user, accounting for a significant share of the market, underscores the critical role of privacy-enhancing technologies in regulated industries. Adherence to mandates like the California Consumer Privacy Act (CCPA) is non-negotiable, making statistical property replication a primary vendor qualification criterion.

As multi-modal data synthesis becomes more common for applications like NLP training datasets, ensuring algorithmic bias mitigation is a paramount concern. The ability to provide robust data scarcity solutions while preventing model collapse prevention will differentiate leading providers in this evolving landscape.

Dive into Technavio’s robust research methodology, blending expert interviews, extensive data synthesis, and validated models for unparalleled Synthetic Data Generation For Ai Training Market insights. See full methodology.

Request Free Sample

Market Scope
Page number 313
Base year 2025
Historic period 2020-2024
Forecast period 2026-2030
Growth momentum & CAGR Accelerate at a CAGR of 37.3%
Market growth 2026-2030 USD 704875.4 thousand
Market structure Fragmented
YoY growth 2025-2026(%) 35.9%
Key countries US, Canada, Mexico, Germany, UK, France, Italy, Spain, The Netherlands, China, India, Japan, South Korea, Australia, Singapore, Saudi Arabia, UAE, South Africa, Israel, Turkey, Brazil, Argentina and Colombia
Competitive landscape Leading Companies, Market Positioning of Companies, Competitive Strategies, and Industry Risks

Synthetic Data Generation For Ai Training Market: Key Questions Answered in This Report

  • What is the expected growth of the Synthetic Data Generation For Ai Training Market between 2026 and 2030?

    • The Synthetic Data Generation For Ai Training Market is expected to grow by USD 704.88 million during 2026-2030, registering a CAGR of 37.3%. Year-over-year growth in 2026 is estimated at 35.9%%. This acceleration is shaped by escalating regulatory pressures and global data privacy mandates, which is intensifying demand across multiple end-use verticals covered in the report.

  • What segmentation does the market report cover?

    • The report is segmented by Type (Tabular data, Text data, Image and video data, and Others), End-user (BFSI, Healthcare, Automotive, IT and telecom, and Others), Product (Fully synthetic data, and Partially synthetic data) and Geography (North America, Europe, APAC, Middle East and Africa, South America). Among these, the Tabular data segment is estimated to witness significant growth during the forecast period, driven by rising adoption across key application areas. Each segment includes detailed qualitative and quantitative analysis, along with historical data from 2020-2024 and forecasts through 2030 with year-over-year growth rates.

  • Which regions are analyzed in the report?

    • The report covers North America, Europe, APAC, Middle East and Africa and South America. North America is estimated to contribute 37.6% to market growth during the forecast period. Country-level analysis includes US, Canada, Mexico, Germany, UK, France, Italy, Spain, The Netherlands, China, India, Japan, South Korea, Australia, Singapore, Saudi Arabia, UAE, South Africa, Israel, Turkey, Brazil, Argentina and Colombia, with dedicated market size tables and year-over-year growth for each.

  • What are the key growth drivers and market challenges?

    • The primary driver is escalating regulatory pressures and global data privacy mandates, which is accelerating investment and industry demand. The main challenge is data fidelity and impending risk of model collapse, creating operational barriers for key market participants. The report quantifies the impact of each driver and challenge across 2026 and 2030 with comparative analysis.

  • Who are the major players in the Synthetic Data Generation For Ai Training Market?

    • Key vendors include Anonos., BetterData Pte Ltd., Broadcom Inc., Capgemini SE, DataGen, Facteus Inc, GenRocket Inc., Gretel AI, IBM Corp., Informatica Inc., K2view Ltd., MDClone Ltd., MOSTLY AI, NVIDIA Corp., Parallel Domain, Rendered.ai, Synthesise AI., Syntho, Tonic AI Inc. and YData Labs Inc. The report provides qualitative and quantitative analysis categorizing companies as dominant, leading, strong, tentative, and weak based on their market positioning. Company profiles include business segment analysis, SWOT assessment, key offerings, and recent strategic developments.

Synthetic Data Generation For Ai Training Market Research Insights

Market dynamics are defined by the tension between rapid innovation and the need for regulatory adherence under frameworks like GDPR. This drives demand for data-centric AI platforms that embed privacy by design principles.

For instance, the growing reliance on synthetic healthcare data for AI in clinical trials and AI in drug discovery highlights the need for datasets that are both medically accurate and fully anonymized. While the tabular data segment is larger than the image and video data segment, both are critical for different use cases, from financial modeling to autonomous systems.

The adoption of synthetic data allows organizations to accelerate machine learning development and improve AI ethics and fairness by creating balanced datasets, fundamentally altering how AI models are trained and deployed across industries.

We can help! Our analysts can customize this synthetic data generation for ai training market research report to meet your requirements.

Get in touch

1. Executive Summary

1.1 Market overview

Executive Summary - Chart on Market Overview
Executive Summary - Data Table on Market Overview
Executive Summary - Chart on Global Market Characteristics
Executive Summary - Chart on Market by Geography
Executive Summary - Chart on Market Segmentation by Type
Executive Summary - Chart on Market Segmentation by End-user
Executive Summary - Chart on Market Segmentation by Product
Executive Summary - Chart on Incremental Growth
Executive Summary - Data Table on Incremental Growth
Executive Summary - Chart on Company Market Positioning

2. Technavio Analysis

2.1 Analysis of price sensitivity, lifecycle, customer purchase basket, adoption rates, and purchase criteria

2.2 Criticality of inputs and Factors of differentiation

Chart on Overview on criticality of inputs and factors of differentiation

2.3 Factors of disruption

Chart on Overview on factors of disruption

2.4 Impact of drivers and challenges

Chart on Impact of drivers and challenges in 2025 and 2030

3. Market Landscape

3.1 Market ecosystem

Chart on Parent Market
Data Table on - Parent Market

3.2 Market characteristics

Chart on Market characteristics analysis

3.3 Value chain analysis

Chart on Value chain analysis

4. Market Sizing

4.1 Market definition

Data Table on Offerings of companies included in the market definition

4.2 Market segment analysis

Market segments

4.3 Market size 2025

4.4 Market outlook: Forecast for 2025-2030

Chart on Global - Market size and forecast 2025-2030 ($ thousand)
Data Table on Global - Market size and forecast 2025-2030 ($ thousand)
Chart on Global Market: Year-over-year growth 2025-2030 (%)
Data Table on Global Market: Year-over-year growth 2025-2030 (%)

5. Historic Market Size

5.1 Global Synthetic Data Generation For AI Training Market 2020 - 2024

Historic Market Size - Data Table on Global Synthetic Data Generation For AI Training Market 2020 - 2024 ($ thousand)

5.2 Type segment analysis 2020 - 2024

Historic Market Size - Type Segment 2020 - 2024 ($ thousand)

5.3 End-user segment analysis 2020 - 2024

Historic Market Size - End-user Segment 2020 - 2024 ($ thousand)

5.4 Product segment analysis 2020 - 2024

Historic Market Size - Product Segment 2020 - 2024 ($ thousand)

5.5 Geography segment analysis 2020 - 2024

Historic Market Size - Geography Segment 2020 - 2024 ($ thousand)

5.6 Country segment analysis 2020 - 2024

Historic Market Size - Country Segment 2020 - 2024 ($ thousand)

6. Qualitative Analysis

6.1 The AI impact on Global Synthetic Data Generation for AI Training Market

6.2 Impact of geopolitical conflicts on Global Synthetic Data Generation for AI Training Market

7. Five Forces Analysis

7.1 Five forces summary

Five forces analysis - Comparison between 2025 and 2030

7.2 Bargaining power of buyers

Bargaining power of buyers - Impact of key factors 2025 and 2030

7.3 Bargaining power of suppliers

Bargaining power of suppliers - Impact of key factors in 2025 and 2030

7.4 Threat of new entrants

Threat of new entrants - Impact of key factors in 2025 and 2030

7.5 Threat of substitutes

Threat of substitutes - Impact of key factors in 2025 and 2030

7.6 Threat of rivalry

Threat of rivalry - Impact of key factors in 2025 and 2030

7.7 Market condition

Chart on Market condition - Five forces 2025 and 2030

8. Market Segmentation by Type

8.1 Market segments

Chart on Type - Market share 2025-2030 (%)
Data Table on Type - Market share 2025-2030 (%)

8.2 Comparison by Type

Chart on Comparison by Type
Data Table on Comparison by Type

8.3 Tabular data - Market size and forecast 2025-2030

Chart on Tabular data - Market size and forecast 2025-2030 ($ thousand)
Data Table on Tabular data - Market size and forecast 2025-2030 ($ thousand)
Chart on Tabular data - Year-over-year growth 2025-2030 (%)
Data Table on Tabular data - Year-over-year growth 2025-2030 (%)

8.4 Text data - Market size and forecast 2025-2030

Chart on Text data - Market size and forecast 2025-2030 ($ thousand)
Data Table on Text data - Market size and forecast 2025-2030 ($ thousand)
Chart on Text data - Year-over-year growth 2025-2030 (%)
Data Table on Text data - Year-over-year growth 2025-2030 (%)

8.5 Image and video data - Market size and forecast 2025-2030

Chart on Image and video data - Market size and forecast 2025-2030 ($ thousand)
Data Table on Image and video data - Market size and forecast 2025-2030 ($ thousand)
Chart on Image and video data - Year-over-year growth 2025-2030 (%)
Data Table on Image and video data - Year-over-year growth 2025-2030 (%)

8.6 Others - Market size and forecast 2025-2030

Chart on Others - Market size and forecast 2025-2030 ($ thousand)
Data Table on Others - Market size and forecast 2025-2030 ($ thousand)
Chart on Others - Year-over-year growth 2025-2030 (%)
Data Table on Others - Year-over-year growth 2025-2030 (%)

8.7 Market opportunity by Type

Market opportunity by Type ($ thousand)
Data Table on Market opportunity by Type ($ thousand)

9. Market Segmentation by End-user

9.1 Market segments

Chart on End-user - Market share 2025-2030 (%)
Data Table on End-user - Market share 2025-2030 (%)

9.2 Comparison by End-user

Chart on Comparison by End-user
Data Table on Comparison by End-user

9.3 BFSI - Market size and forecast 2025-2030

Chart on BFSI - Market size and forecast 2025-2030 ($ thousand)
Data Table on BFSI - Market size and forecast 2025-2030 ($ thousand)
Chart on BFSI - Year-over-year growth 2025-2030 (%)
Data Table on BFSI - Year-over-year growth 2025-2030 (%)

9.4 Healthcare - Market size and forecast 2025-2030

Chart on Healthcare - Market size and forecast 2025-2030 ($ thousand)
Data Table on Healthcare - Market size and forecast 2025-2030 ($ thousand)
Chart on Healthcare - Year-over-year growth 2025-2030 (%)
Data Table on Healthcare - Year-over-year growth 2025-2030 (%)

9.5 Automotive - Market size and forecast 2025-2030

Chart on Automotive - Market size and forecast 2025-2030 ($ thousand)
Data Table on Automotive - Market size and forecast 2025-2030 ($ thousand)
Chart on Automotive - Year-over-year growth 2025-2030 (%)
Data Table on Automotive - Year-over-year growth 2025-2030 (%)

9.6 IT and telecom - Market size and forecast 2025-2030

Chart on IT and telecom - Market size and forecast 2025-2030 ($ thousand)
Data Table on IT and telecom - Market size and forecast 2025-2030 ($ thousand)
Chart on IT and telecom - Year-over-year growth 2025-2030 (%)
Data Table on IT and telecom - Year-over-year growth 2025-2030 (%)

9.7 Others - Market size and forecast 2025-2030

Chart on Others - Market size and forecast 2025-2030 ($ thousand)
Data Table on Others - Market size and forecast 2025-2030 ($ thousand)
Chart on Others - Year-over-year growth 2025-2030 (%)
Data Table on Others - Year-over-year growth 2025-2030 (%)

9.8 Market opportunity by End-user

Market opportunity by End-user ($ thousand)
Data Table on Market opportunity by End-user ($ thousand)

10. Market Segmentation by Product

10.1 Market segments

Chart on Product - Market share 2025-2030 (%)
Data Table on Product - Market share 2025-2030 (%)

10.2 Comparison by Product

Chart on Comparison by Product
Data Table on Comparison by Product

10.3 Fully synthetic data - Market size and forecast 2025-2030

Chart on Fully synthetic data - Market size and forecast 2025-2030 ($ thousand)
Data Table on Fully synthetic data - Market size and forecast 2025-2030 ($ thousand)
Chart on Fully synthetic data - Year-over-year growth 2025-2030 (%)
Data Table on Fully synthetic data - Year-over-year growth 2025-2030 (%)

10.4 Partially synthetic data - Market size and forecast 2025-2030

Chart on Partially synthetic data - Market size and forecast 2025-2030 ($ thousand)
Data Table on Partially synthetic data - Market size and forecast 2025-2030 ($ thousand)
Chart on Partially synthetic data - Year-over-year growth 2025-2030 (%)
Data Table on Partially synthetic data - Year-over-year growth 2025-2030 (%)

10.5 Market opportunity by Product

Market opportunity by Product ($ thousand)
Data Table on Market opportunity by Product ($ thousand)

11. Customer Landscape

11.1 Customer landscape overview

Analysis of price sensitivity, lifecycle, customer purchase basket, adoption rates, and purchase criteria

12. Geographic Landscape

12.1 Geographic segmentation

Chart on Market share by geography 2025-2030 (%)
Data Table on Market share by geography 2025-2030 (%)

12.2 Geographic comparison

Chart on Geographic comparison
Data Table on Geographic comparison

12.3 North America - Market size and forecast 2025-2030

Chart on North America - Market size and forecast 2025-2030 ($ thousand)
Data Table on North America - Market size and forecast 2025-2030 ($ thousand)
Chart on North America - Year-over-year growth 2025-2030 (%)
Data Table on North America - Year-over-year growth 2025-2030 (%)
Chart on Regional Comparison - North America
Data Table on Regional Comparison - North America

12.3.1 US - Market size and forecast 2025-2030

Chart on US - Market size and forecast 2025-2030 ($ thousand)
Data Table on US - Market size and forecast 2025-2030 ($ thousand)
Chart on US - Year-over-year growth 2025-2030 (%)
Data Table on US - Year-over-year growth 2025-2030 (%)

12.3.2 Canada - Market size and forecast 2025-2030

Chart on Canada - Market size and forecast 2025-2030 ($ thousand)
Data Table on Canada - Market size and forecast 2025-2030 ($ thousand)
Chart on Canada - Year-over-year growth 2025-2030 (%)
Data Table on Canada - Year-over-year growth 2025-2030 (%)

12.3.3 Mexico - Market size and forecast 2025-2030

Chart on Mexico - Market size and forecast 2025-2030 ($ thousand)
Data Table on Mexico - Market size and forecast 2025-2030 ($ thousand)
Chart on Mexico - Year-over-year growth 2025-2030 (%)
Data Table on Mexico - Year-over-year growth 2025-2030 (%)

12.4 Europe - Market size and forecast 2025-2030

Chart on Europe - Market size and forecast 2025-2030 ($ thousand)
Data Table on Europe - Market size and forecast 2025-2030 ($ thousand)
Chart on Europe - Year-over-year growth 2025-2030 (%)
Data Table on Europe - Year-over-year growth 2025-2030 (%)
Chart on Regional Comparison - Europe
Data Table on Regional Comparison - Europe

12.4.1 Germany - Market size and forecast 2025-2030

Chart on Germany - Market size and forecast 2025-2030 ($ thousand)
Data Table on Germany - Market size and forecast 2025-2030 ($ thousand)
Chart on Germany - Year-over-year growth 2025-2030 (%)
Data Table on Germany - Year-over-year growth 2025-2030 (%)

12.4.2 UK - Market size and forecast 2025-2030

Chart on UK - Market size and forecast 2025-2030 ($ thousand)
Data Table on UK - Market size and forecast 2025-2030 ($ thousand)
Chart on UK - Year-over-year growth 2025-2030 (%)
Data Table on UK - Year-over-year growth 2025-2030 (%)

12.4.3 France - Market size and forecast 2025-2030

Chart on France - Market size and forecast 2025-2030 ($ thousand)
Data Table on France - Market size and forecast 2025-2030 ($ thousand)
Chart on France - Year-over-year growth 2025-2030 (%)
Data Table on France - Year-over-year growth 2025-2030 (%)

12.4.4 Italy - Market size and forecast 2025-2030

Chart on Italy - Market size and forecast 2025-2030 ($ thousand)
Data Table on Italy - Market size and forecast 2025-2030 ($ thousand)
Chart on Italy - Year-over-year growth 2025-2030 (%)
Data Table on Italy - Year-over-year growth 2025-2030 (%)

12.4.5 Spain - Market size and forecast 2025-2030

Chart on Spain - Market size and forecast 2025-2030 ($ thousand)
Data Table on Spain - Market size and forecast 2025-2030 ($ thousand)
Chart on Spain - Year-over-year growth 2025-2030 (%)
Data Table on Spain - Year-over-year growth 2025-2030 (%)

12.4.6 The Netherlands - Market size and forecast 2025-2030

Chart on The Netherlands - Market size and forecast 2025-2030 ($ thousand)
Data Table on The Netherlands - Market size and forecast 2025-2030 ($ thousand)
Chart on The Netherlands - Year-over-year growth 2025-2030 (%)
Data Table on The Netherlands - Year-over-year growth 2025-2030 (%)

12.5 APAC - Market size and forecast 2025-2030

Chart on APAC - Market size and forecast 2025-2030 ($ thousand)
Data Table on APAC - Market size and forecast 2025-2030 ($ thousand)
Chart on APAC - Year-over-year growth 2025-2030 (%)
Data Table on APAC - Year-over-year growth 2025-2030 (%)
Chart on Regional Comparison - APAC
Data Table on Regional Comparison - APAC

12.5.1 China - Market size and forecast 2025-2030

Chart on China - Market size and forecast 2025-2030 ($ thousand)
Data Table on China - Market size and forecast 2025-2030 ($ thousand)
Chart on China - Year-over-year growth 2025-2030 (%)
Data Table on China - Year-over-year growth 2025-2030 (%)

12.5.2 India - Market size and forecast 2025-2030

Chart on India - Market size and forecast 2025-2030 ($ thousand)
Data Table on India - Market size and forecast 2025-2030 ($ thousand)
Chart on India - Year-over-year growth 2025-2030 (%)
Data Table on India - Year-over-year growth 2025-2030 (%)

12.5.3 Japan - Market size and forecast 2025-2030

Chart on Japan - Market size and forecast 2025-2030 ($ thousand)
Data Table on Japan - Market size and forecast 2025-2030 ($ thousand)
Chart on Japan - Year-over-year growth 2025-2030 (%)
Data Table on Japan - Year-over-year growth 2025-2030 (%)

12.5.4 South Korea - Market size and forecast 2025-2030

Chart on South Korea - Market size and forecast 2025-2030 ($ thousand)
Data Table on South Korea - Market size and forecast 2025-2030 ($ thousand)
Chart on South Korea - Year-over-year growth 2025-2030 (%)
Data Table on South Korea - Year-over-year growth 2025-2030 (%)

12.5.5 Australia - Market size and forecast 2025-2030

Chart on Australia - Market size and forecast 2025-2030 ($ thousand)
Data Table on Australia - Market size and forecast 2025-2030 ($ thousand)
Chart on Australia - Year-over-year growth 2025-2030 (%)
Data Table on Australia - Year-over-year growth 2025-2030 (%)

12.5.6 Singapore - Market size and forecast 2025-2030

Chart on Singapore - Market size and forecast 2025-2030 ($ thousand)
Data Table on Singapore - Market size and forecast 2025-2030 ($ thousand)
Chart on Singapore - Year-over-year growth 2025-2030 (%)
Data Table on Singapore - Year-over-year growth 2025-2030 (%)

12.6 Middle East and Africa - Market size and forecast 2025-2030

Chart on Middle East and Africa - Market size and forecast 2025-2030 ($ thousand)
Data Table on Middle East and Africa - Market size and forecast 2025-2030 ($ thousand)
Chart on Middle East and Africa - Year-over-year growth 2025-2030 (%)
Data Table on Middle East and Africa - Year-over-year growth 2025-2030 (%)
Chart on Regional Comparison - Middle East and Africa
Data Table on Regional Comparison - Middle East and Africa

12.6.1 Saudi Arabia - Market size and forecast 2025-2030

Chart on Saudi Arabia - Market size and forecast 2025-2030 ($ thousand)
Data Table on Saudi Arabia - Market size and forecast 2025-2030 ($ thousand)
Chart on Saudi Arabia - Year-over-year growth 2025-2030 (%)
Data Table on Saudi Arabia - Year-over-year growth 2025-2030 (%)

12.6.2 UAE - Market size and forecast 2025-2030

Chart on UAE - Market size and forecast 2025-2030 ($ thousand)
Data Table on UAE - Market size and forecast 2025-2030 ($ thousand)
Chart on UAE - Year-over-year growth 2025-2030 (%)
Data Table on UAE - Year-over-year growth 2025-2030 (%)

12.6.3 South Africa - Market size and forecast 2025-2030

Chart on South Africa - Market size and forecast 2025-2030 ($ thousand)
Data Table on South Africa - Market size and forecast 2025-2030 ($ thousand)
Chart on South Africa - Year-over-year growth 2025-2030 (%)
Data Table on South Africa - Year-over-year growth 2025-2030 (%)

12.6.4 Israel - Market size and forecast 2025-2030

Chart on Israel - Market size and forecast 2025-2030 ($ thousand)
Data Table on Israel - Market size and forecast 2025-2030 ($ thousand)
Chart on Israel - Year-over-year growth 2025-2030 (%)
Data Table on Israel - Year-over-year growth 2025-2030 (%)

12.6.5 Turkey - Market size and forecast 2025-2030

Chart on Turkey - Market size and forecast 2025-2030 ($ thousand)
Data Table on Turkey - Market size and forecast 2025-2030 ($ thousand)
Chart on Turkey - Year-over-year growth 2025-2030 (%)
Data Table on Turkey - Year-over-year growth 2025-2030 (%)

12.7 South America - Market size and forecast 2025-2030

Chart on South America - Market size and forecast 2025-2030 ($ thousand)
Data Table on South America - Market size and forecast 2025-2030 ($ thousand)
Chart on South America - Year-over-year growth 2025-2030 (%)
Data Table on South America - Year-over-year growth 2025-2030 (%)
Chart on Regional Comparison - South America
Data Table on Regional Comparison - South America

12.7.1 Brazil - Market size and forecast 2025-2030

Chart on Brazil - Market size and forecast 2025-2030 ($ thousand)
Data Table on Brazil - Market size and forecast 2025-2030 ($ thousand)
Chart on Brazil - Year-over-year growth 2025-2030 (%)
Data Table on Brazil - Year-over-year growth 2025-2030 (%)

12.7.2 Argentina - Market size and forecast 2025-2030

Chart on Argentina - Market size and forecast 2025-2030 ($ thousand)
Data Table on Argentina - Market size and forecast 2025-2030 ($ thousand)
Chart on Argentina - Year-over-year growth 2025-2030 (%)
Data Table on Argentina - Year-over-year growth 2025-2030 (%)

12.7.3 Colombia - Market size and forecast 2025-2030

Chart on Colombia - Market size and forecast 2025-2030 ($ thousand)
Data Table on Colombia - Market size and forecast 2025-2030 ($ thousand)
Chart on Colombia - Year-over-year growth 2025-2030 (%)
Data Table on Colombia - Year-over-year growth 2025-2030 (%)

12.8 Market opportunity by geography

Market opportunity by geography ($ thousand)
Data Tables on Market opportunity by geography ($ thousand)

13. Drivers, Challenges, and Opportunity

13.1 Market drivers

Escalating regulatory pressures and global data privacy mandates
Increasing demand for autonomous system safety and edge case simulation
Economic efficiency and democratization of artificial intelligence development

13.2 Market challenges

Data fidelity and impending risk of model collapse
Absence of universal standards for verification and validation
Security vulnerabilities and dual-use dilemma of generative technology

13.3 Impact of drivers and challenges

Impact of drivers and challenges in 2025 and 2030

13.4 Market opportunities

Emergence of high-fidelity multi-modal synthetic environments for spatial computing
Convergence of synthetic data with federated learning for decentralized privacy
Development of autonomous data curation and self-correcting generative loops

14. Competitive Landscape

14.1 Overview

14.2

Overview on criticality of inputs and factors of differentiation

14.3 Landscape disruption

Overview on factors of disruption

14.4 Industry risks

Impact of key risks on business

15. Competitive Analysis

15.1 Companies profiled

Companies covered

15.2 Company ranking index

15.3 Market positioning of companies

Matrix on companies position and classification

15.4 Anonos.

Anonos. - Overview
Anonos. - Product / Service
Anonos. - Key offerings
SWOT

15.5 BetterData Pte Ltd.

BetterData Pte Ltd. - Overview
BetterData Pte Ltd. - Product / Service
BetterData Pte Ltd. - Key offerings
SWOT

15.6 Broadcom Inc.

Broadcom Inc. - Overview
Broadcom Inc. - Business segments
Broadcom Inc. - Key news
Broadcom Inc. - Key offerings
Broadcom Inc. - Segment focus
SWOT

15.7 Capgemini SE

Capgemini SE - Overview
Capgemini SE - Business segments
Capgemini SE - Key offerings
Capgemini SE - Segment focus
SWOT

15.8 DataGen

DataGen - Overview
DataGen - Product / Service
DataGen - Key offerings
SWOT

15.9 Facteus Inc

Facteus Inc - Overview
Facteus Inc - Product / Service
Facteus Inc - Key offerings
SWOT

15.10 GenRocket Inc.

GenRocket Inc. - Overview
GenRocket Inc. - Product / Service
GenRocket Inc. - Key offerings
SWOT

15.11 Gretel AI

Gretel AI - Overview
Gretel AI - Product / Service
Gretel AI - Key offerings
SWOT

15.12 IBM Corp.

IBM Corp. - Overview
IBM Corp. - Business segments
IBM Corp. - Key offerings
IBM Corp. - Segment focus
SWOT

15.13 Informatica Inc.

Informatica Inc. - Overview
Informatica Inc. - Business segments
Informatica Inc. - Key news
Informatica Inc. - Key offerings
Informatica Inc. - Segment focus
SWOT

15.14 K2view Ltd.

K2view Ltd. - Overview
K2view Ltd. - Product / Service
K2view Ltd. - Key offerings
SWOT

15.15 MDClone Ltd.

MDClone Ltd. - Overview
MDClone Ltd. - Product / Service
MDClone Ltd. - Key offerings
SWOT

15.16 MOSTLY AI

MOSTLY AI - Overview
MOSTLY AI - Product / Service
MOSTLY AI - Key offerings
SWOT

15.17 NVIDIA Corp.

NVIDIA Corp. - Overview
NVIDIA Corp. - Business segments
NVIDIA Corp. - Key news
NVIDIA Corp. - Key offerings
NVIDIA Corp. - Segment focus
SWOT

15.18 Parallel Domain

Parallel Domain - Overview
Parallel Domain - Product / Service
Parallel Domain - Key offerings
SWOT

16. Appendix

16.1 Scope of the report

Market definition
Objectives
Notes and caveats

16.2 Inclusions and exclusions checklist

Inclusions checklist
Exclusions checklist

16.3 Currency conversion rates for US$

16.4 Research methodology

16.5 Data procurement

Information sources

16.6 Data validation

16.7 Validation techniques employed for market sizing

16.8 Data synthesis

16.9 360 degree market analysis

16.10 List of abbreviations

Research Methodology

Technavio presents a detailed picture of the market by way of study, synthesis, and summation of data from multiple sources. The analysts have presented the various facets of the market with a particular focus on identifying the key industry influencers. The data thus presented is comprehensive, reliable, and the result of extensive research, both primary and secondary.

INFORMATION SOURCES

Primary sources

  • Manufacturers and suppliers
  • Channel partners
  • Industry experts
  • Strategic decision makers

Secondary sources

  • Industry journals and periodicals
  • Government data
  • Financial reports of key industry players
  • Historical data
  • Press releases

DATA ANALYSIS

Data Synthesis

  • Collation of data
  • Estimation of key figures
  • Analysis of derived insights

Data Validation

  • Triangulation with data models
  • Reference against proprietary databases
  • Corroboration with industry experts

REPORT WRITING

Qualitative

  • Market drivers
  • Market challenges
  • Market trends
  • Five forces analysis

Quantitative

  • Market size and forecast
  • Market segmentation
  • Geographical insights
  • Competitive landscape

Interested in this report?

Get your sample now to see our research methodology and insights!

Download Now

Frequently Asked Questions

Synthetic Data Generation For Ai Training market growth will increase by USD 704875.4 thousand thousand during 2026-2030.

The Synthetic Data Generation For Ai Training market is expected to grow at a CAGR of 37.3% during 2026-2030.

Synthetic Data Generation For Ai Training market is segmented by Type (Tabular data, Text data, Image and video data, Others) End-user (BFSI, Healthcare, Automotive, IT and telecom, Others) Product (Fully synthetic data, Partially synthetic data)

Anonos., BetterData Pte Ltd., Broadcom Inc., Capgemini SE, DataGen, Facteus Inc, GenRocket Inc., Gretel AI, IBM Corp., Informatica Inc., K2view Ltd., MDClone Ltd., MOSTLY AI, NVIDIA Corp., Parallel Domain, Rendered.ai, Synthesise AI., Syntho, Tonic AI Inc., YData Labs Inc are a few of the key vendors in the Synthetic Data Generation For Ai Training market.

North America will register the highest growth rate of 37.6% among the other regions. Therefore, the Synthetic Data Generation For Ai Training market in North America is expected to garner significant business opportunities for the vendors during the forecast period.

US, Canada, Mexico, Germany, UK, France, Italy, Spain, The Netherlands, China, India, Japan, South Korea, Australia, Singapore, Saudi Arabia, UAE, South Africa, Israel, Turkey, Brazil, Argentina, Colombia

  • Escalating regulatory pressures and global data privacy mandates is the driving factor this market.

The Synthetic Data Generation For Ai Training market vendors should focus on grabbing business opportunities from the Type segment as it accounted for the largest market share in the base year.
RIA - Research AI Assistant
Ask RIA